Attested Enclaves and Asterisked Benchmarks · Morning Gist
Saturday, October 35 stories · 11 min
Attested Enclaves and Asterisked Benchmarks
Privacy claims outsiders can verify, edge steps that show up in your traces, agents that survive crashes, and a speed ranking that jumped when the measurement changed.
Picked from 16 new articles across 23 sources · arrow keys for other days
Today in 30 seconds
30s left
Google now runs federated learning in attested TEEs. Devices encrypt to published policies, only DP weights leave, and Gboard already uses it. story 1 ↓
Ai2's open AstaBrief 8B replaces a multi-stage Claude pipeline and writes cited reports 3.5× faster. Filtering by citation density beat fancier filters. story 2 ↓
Cloudflare Traces (open beta) turns WAF, cache, routing and origin steps into OTLP spans, filling the CDN gap in your traces. story 3 ↓
Cloudflare now claims it's fastest in 74% of top networks, up from 60%. The jump came alongside a new Turnstile-based data source. story 4 ↓
Earendil's Pi Durable checkpoints every agent step outside the process. Crashed runs resume exactly, and tools can be swapped mid-run. story 5 ↓
1/5Google Research· Oct 2
Google moves federated learning into attested TEEs, with Gboard already on it
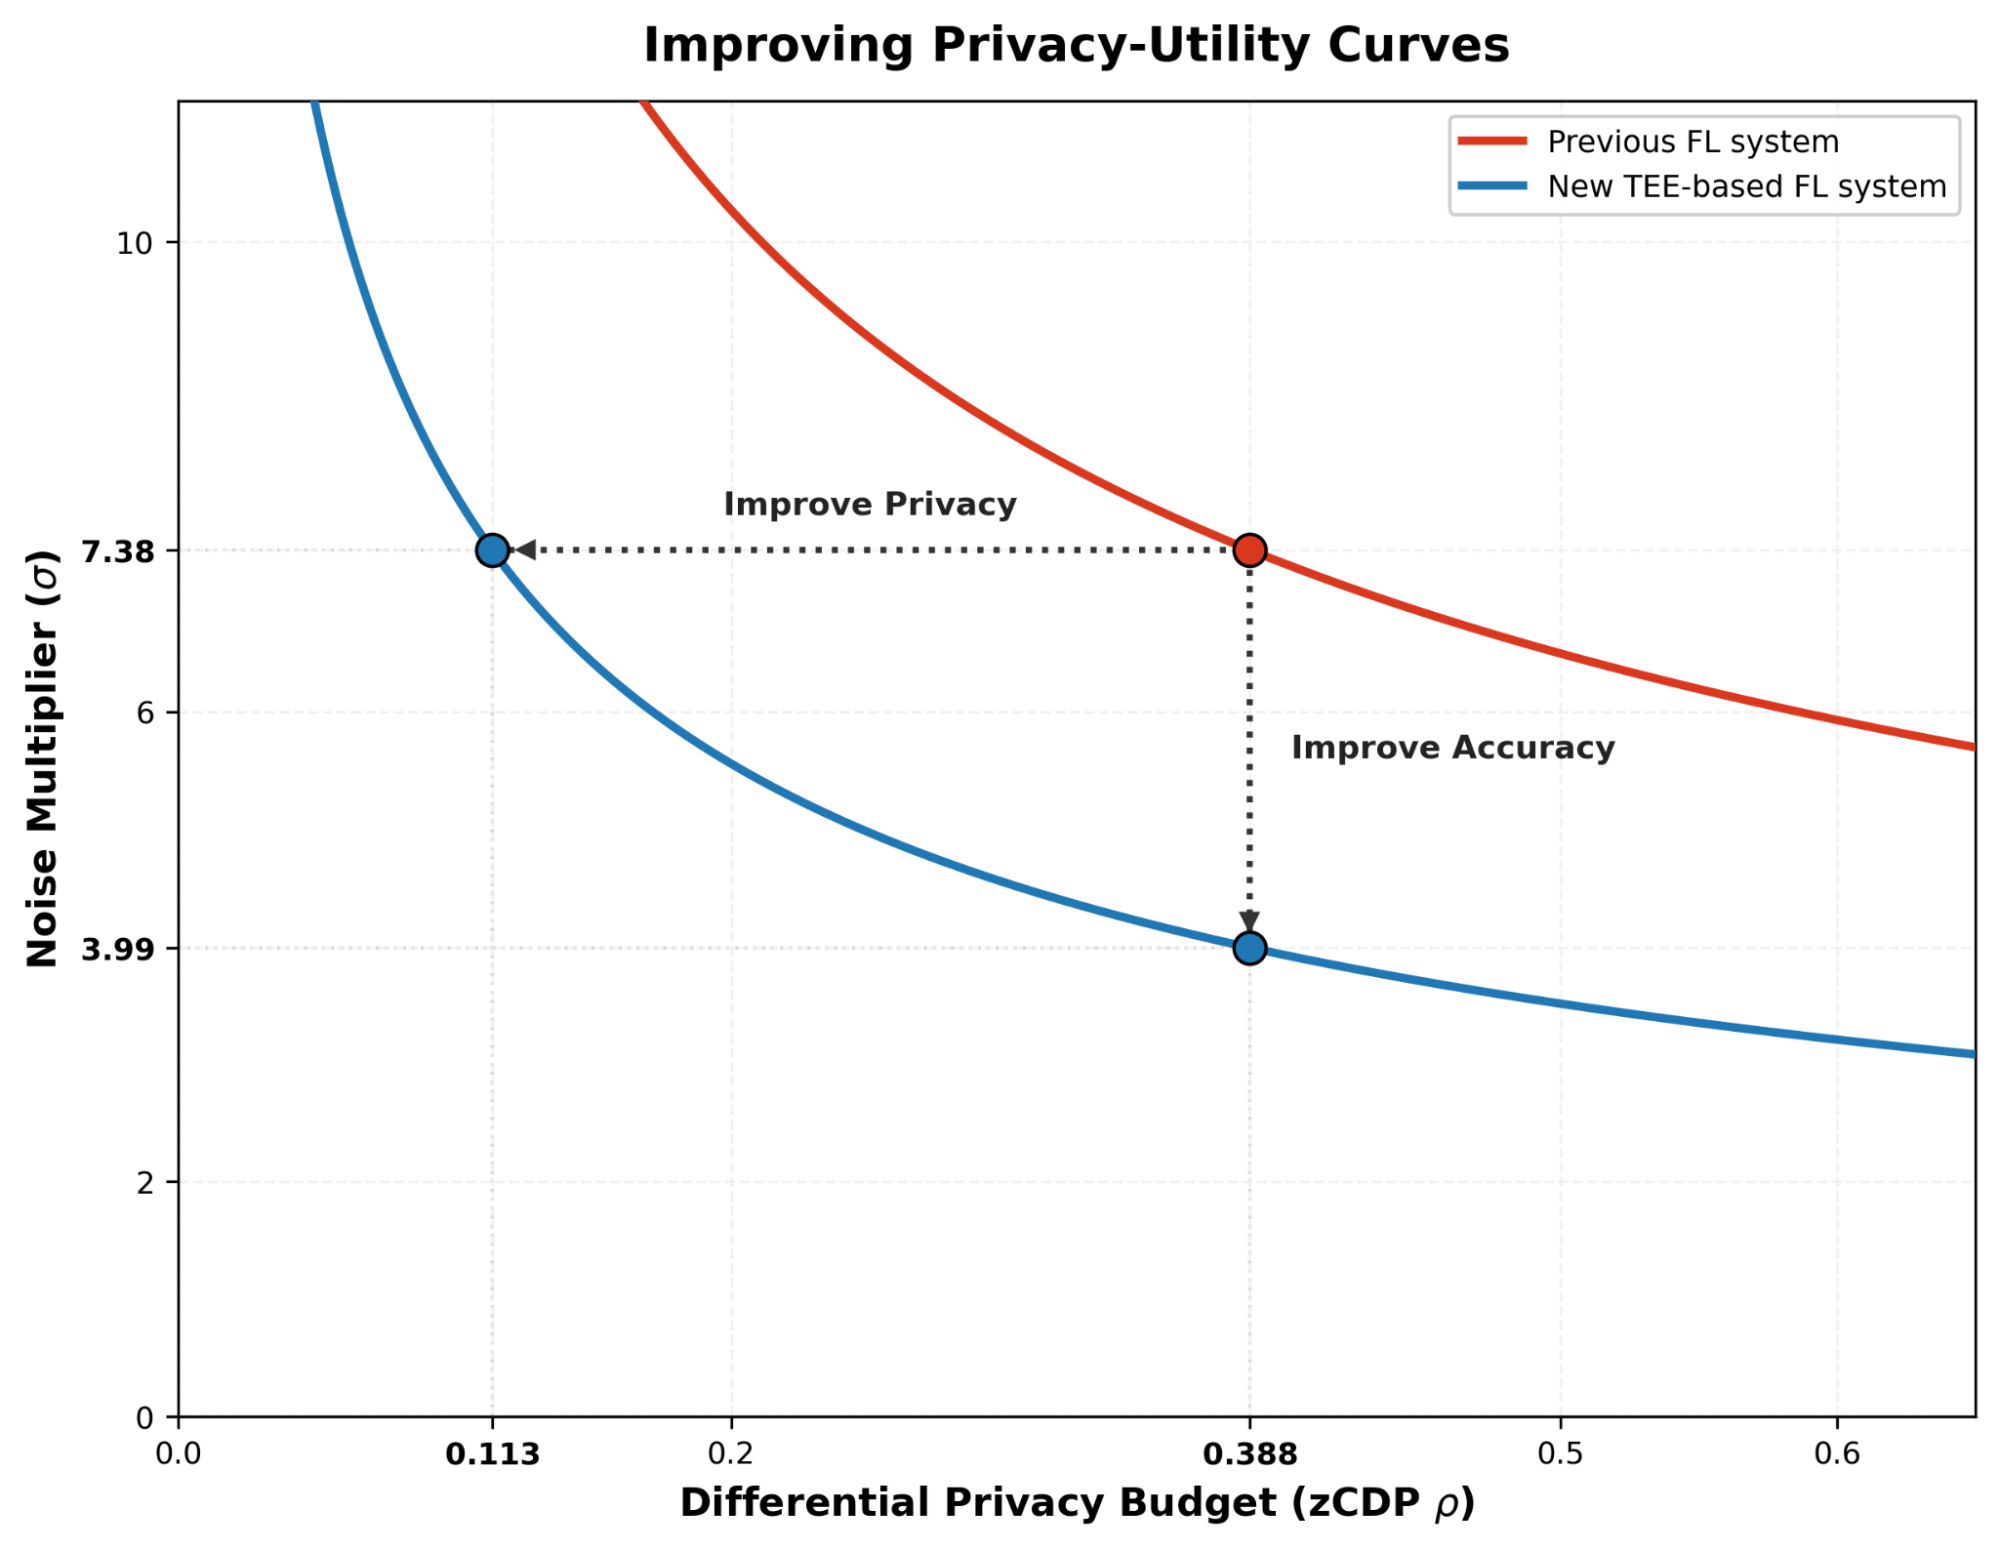
Devices upload encrypted data bound to published access policies; only DP model weights leave the enclaves, and gradient computation moves server-side.
Why it matters · This is a concrete design for making "we don't look at your data" checkable by outsiders: published policies, open-source reproducible binaries, attested execution, and key release gated by policy match. The same pattern applies to any privacy-sensitive server pipeline.
Image: Google Research
Google has rebuilt its federated learning (FL) stack around Trusted Execution Environments (TEEs). The aim is for outside auditors, not just Google, to be able to verify the privacy guarantees. Gboard already uses it for English and Japanese next-word prediction, and Google reports stronger privacy, better accuracy, and much faster training.
How it works
The system has four parts:
Upload: Devices encrypt their training examples locally and upload them. Each upload is bound to an access policy, which lists the TEE computations allowed to process that data. Devices require the policy to be published to Rekor, a public transparency log.
Key release: A Key Management System, itself a cluster of TEEs running Raft, hands out decryption keys only to TEE workloads whose attested code matches the policy.
Execution: A "root" TEE runs a Python training loop and sends parallel subtasks to worker TEEs. The distributed logic is written in Federated Language, an open-source orchestration language derived from TensorFlow Federated. Only metrics and differentially private model weights leave the enclaves.
Recovery: At the end of each round, the program saves its state encrypted under the KMS, so it can recover from root or worker failures without exposing extra data.
The KMS and data-processing binaries can be reproducibly built from the open-source Confidential Federated Compute repo. To keep model architectures and preprocessing proprietary, the Python program can load serialized logic at runtime (sideloading). This keeps verifiability only if all privacy-relevant logic, such as DP noise addition, stays hardcoded in the attested program. Google says side-channel attacks on sideloaded workloads are still an open issue, and that the TEE guarantees are "subject to current-generation TEE limitations."
2/5Hugging Face· Oct 2
Ai2's AstaBrief 8B: an open model that writes cited reports 3.5× faster
A Qwen3-8B fine-tune trained with SFT and DPO on 90K real research queries, released with its training data, replaces a multi-stage Claude pipeline with a single pass.
Why it matters · It shows a cheap, debuggable recipe for domain specialization: SFT plus judge-filtered DPO, no RL. One simple data filter, citation density, mattered more than combinations of fancier filters. Teams distilling a proprietary pipeline into a small self-hosted model can reuse both.
Benchmark table: AstaBrief vs. Claude pipeline, DR Tulu and Qwen3-8B on SQABench-CS2 and DeepScholarBench.1 / 2
Ai2 has open-sourced AstaBrief 8B and its training data. The model takes a research question plus retrieved literature excerpts and writes a cited report. It now runs as "Fast mode" in Asta's report generator, next to the Claude-powered "Thinking mode." Across the full pipeline, Fast mode averages 51.1 seconds per report versus 178.5, about 3.5× faster. Ai2 says generation time alone is down by nearly an order of magnitude. Most of the speedup comes from changing the system design. Thinking mode summarizes and clusters snippets, then writes section by section. AstaBrief writes the whole report in one pass, and Ai2 reports no loss in quality from doing so.
The recipe
The base model is Qwen3-8B. Ai2 considered RL, which helped its earlier DR Tulu model, but chose plain SFT + DPO because RL is unstable, expensive and harder to debug. Most of the effort went into the data instead:
Queries: real Asta/ScholarQA user logs, with bots, very short prompts, non-English and non-scientific requests, and personal information removed. That left 90K queries.
SFT targets: reports from the multi-step ScholarQA pipeline, backed by Claude 3.5/3.7 Sonnet, o3, o4-mini and GPT-4.1. 47K examples survived filtering.
3/5Cloudflare· Mar Witek· Oct 2
Cloudflare Traces makes its edge pipeline show up as OpenTelemetry spans
Now in open beta: WAF, transform rules, cache, routing and origin steps become per-request spans, with W3C traceparent propagation and OTLP export.
Why it matters · If Cloudflare sits in front of your origin, it has been a blind spot in your distributed traces. Traces turns those edge steps into standard OTLP spans, so "was it the CDN or my app?" can be answered from one trace rather than by correlating logs.
Image: Cloudflare
Cloudflare has released Cloudflare Traces in open beta. It takes the automatic instrumentation that Workers Tracing introduced last year and applies it to the whole HTTP request path. Every supported step a request passes through becomes a span with timing, outcome and attributes: security rules, transform rules, cache decisions, routing, Worker execution and origin handling. You enable it per domain. You don't need to add code, plugins or instrumentation config.
What the spans tell you
The post describes which spans answer which debugging questions:
Security: custom and managed rule evaluation shows up with its duration and resulting action. Span events name the rule behind a block or challenge.
Rewrites: the http_request_transform span lists each change, the part of the request it touched and the rule responsible. It also shows where the rewrite happened relative to routing and origin.
Routing: workers_routing shows whether a route matched, which routing type was used and the pattern that matched.
Latency: cache, upstream and origin spans nest inside each other. In Cloudflare's example, a cache miss spent 527 ms of a 539 ms request waiting on the origin.
Cloudflare says its own internal traces often contain thousands of spans from dozens of services. The public version is a subset of that.
Sampling, propagation, export
You set a baseline sampling rate per domain, such as 1%. override it for matching traffic and use the same Rules language as the rest of Cloudflare, so you can target hostname, IP, header, path, method or geography. One example: trace 100% of requests from a single customer, or 100% of requests carrying a temporary debug header, while everything else stays at the baseline.
4/5Cloudflare· Lai Yi Ohlsen· Oct 2
Cloudflare says it's fastest in 74% of top networks, after changing how it measures
The jump from 60% since April came at the same time as a new data source: background latency probes on Turnstile Challenge Pages.
Why it matters · This is a lesson in reading vendor benchmarks. A 14-point gain that lines up with a methodology change, in a ranking where 1–2 ms gaps decide first place, tells you more about statistics than about network speed.
Map of countries where Cloudflare ranks fastest across top networks as of August 2026.1 / 3
Cloudflare now reports that it is the fastest provider in 74% of the world's 1,000 largest networks, up from 60% in April 2026. That works out to 150 more networks and 38 more countries where it ranks first. The more useful part of the post is how the measurement works and how much the new number depends on a change to it.
How the ranking is computed
Cloudflare takes the top 1,000 networks by estimated user population from APNIC data. For each network it measures connection time, meaning how long the TCP handshake takes from a real user's browser. Providers are ranked by the trimean of those times, a weighted average of the 25th, 50th and 75th percentiles chosen to dampen outliers.
Since 2021 the samples have come from Cloudflare-branded error pages. When a user lands on one, the browser quietly fetches small files from Cloudflare, Amazon CloudFront, Google, Fastly and Akamai and records how long each connection took and whether it completed.
5/5Latent Space· Oct 2
Pi Durable checkpoints every agent step so crashed runs resume exactly
Earendil ships Pi 1.0 and a TypeScript rewrite that moves all agent state out of the process. GPT-6.1 Sol also cuts cost per task by 31%.
Why it matters · Long-running agents fail when processes die or code changes mid-run. Pi Durable handles this with checkpointed tasks, external state and hot-swappable tools, the same patterns used to build reliable workflow systems.
Image: Latent Space
Pi is a coding-agent harness often grouped with OpenClaw, and it now belongs to Earendil. Two Pi releases reached the Hacker News front page on the same day. Latent Space's AINews issue covers both, along with a busy day of model launches.
Pi 1.0 and Pi Durable
Pi 1.0 is a feature release:
"Codemode," with native support for MCP, Jev and image models
Extension support for virtual models
Deferred tool loading
Cache warming for Anthropic models
Mid-conversation system messages, so prompts and tools can change based on the transcript so far
A new TUI theme, with full-screen mode now the default
Pi Durable is the more interesting release architecturally. It ports Pi to TypeScript and moves every stateful component out of the process. Each step is recorded as a checkpointed task. If a process crashes or restarts, agents and subagents resume from their last exact state. Pi Durable runs on any JavaScript runtime (Node, Bun, Cloudflare), uses pluggable storage (memory, SQLite, JSONL) and supports local or remote execution.
Other mechanisms:
Concurrency: one harness runs several parallel, branching conversations, such as a main channel plus threads, without them blocking each other.
Durable extensions: installable bundles of system prompts, tools, hooks and durable tasks, for example a multi-step checkout with rollback.
Background compaction: older messages are summarized to stay within token limits, and the agent keeps working while this happens.
Previously, users had to trust Google to add DP noise correctly, because nobody outside could inspect the server code. Secure Aggregation protected uploads cryptographically, but it couldn't support state-of-the-art central DP.
The bigger architectural change is that client gradient computation now runs on the server. Uploads are collected first and training runs afterward, which has two effects:
Training no longer depends on when devices happen to be available during the day. The program can work out the best participation schedule at run time and use it to tune DP parameters.
The bottleneck moves from phones to servers. Gboard models used to take 1–2 months each to train, held back by device availability, on-device compute, and competing workloads. Training is now limited only by how many TEEs are available. Google gives no specific speedup figure.
Google's next steps are pairing TEEs with accelerators to train larger models, running other Python workloads such as synthetic data generation, and combining this with TEEs specialized for LLM inference. The long-term goal is formal correctness proofs for the DP implementations.
Remember
Privacy now rests on attested TEEs, a public Rekor policy log and reproducible open-source builds, not operator trust.
Gradients are computed server-side, so training is no longer limited by phones; old Gboard runs took 1–2 months.
Weak spots: runtime sideloading of proprietary logic, TEE side-channels, and no published speedup or DP numbers.
DPO pairs: built from a separate set of queries. A ScholarQA/Claude report was paired with one from o3, o4-mini, DeepSeek-V3 or R1 given the same excerpts. GPT-4.1 and DeepSeek-R1 judged each pair, and only pairs where both agreed were kept. The judges agreed with humans 95% of the time. About 6K pairs remained.
What moved the metrics
The first SFT runs improved content but trailed the Claude pipeline on answer precision and citation quality. Ai2 tested four filters: output-to-input token ratio, the relevance of cited papers, citation density, and citation diversity. Dropping synthetic reports with low citation density gave the biggest gain. More aggressive filtering, combining filters, and learning-rate sweeps added little. DPO on top of that checkpoint brought AstaBrief within range of the Claude pipeline and DR Tulu.
The main benchmark was SQABench-CS2, 200 user-written CS questions, scored on rubric coverage, answer precision, citation precision and citation recall. DeepScholarBench (63 queries) served as a secondary check. The post gives no headline scores in its text. In a 14-question human study with three researchers, DR Tulu won on overall preference, but two of the three preferred AstaBrief on citation accuracy. AstaBrief was also optimized during DPO for the same pairwise ranking used in the LLM-judged comparison, which favors it in that test.
Caveats
Training and evaluation were finished in 2025 and have not been rerun against current frontier models. The authors also admit their metrics don't catch scope inflation: a citation can be correct while the claim turns a finding about one sample into a universal one, or a description into a recommendation. Early usage: 374 users tried Fast mode, 29.1% used it on two or more days, and 23% never went back to Thinking mode. Positive feedback rates were 84.2% for Fast mode and 85.2% for Thinking mode.
Remember
One-pass generation by an 8B model cut Asta report time from 178.5s to 51.1s, with quality competitive on Ai2's benchmarks.
Filtering SFT data on citation density beat more elaborate filter combinations; DPO used only pairs where two LLM judges agreed.
Results date from 2025 and miss claim-scope inflation; human study had only 14 questions and three raters.
For distributed tracing, Cloudflare can accept an incoming W3C traceparent header, controlled by a propagation policy, and forward a new one to your origin. That lets downstream services continue the same trace. Spans export over OTLP to any compatible backend, configured per account and opted into per domain. Authenticated propagation, which would accept context only from trusted callers, is not available yet.
An Observability MCP server gives coding agents SQL access to traces. Cloudflare pitches this as a way for an agent to compare failed traces with successful ones and find where their spans diverge.
Pricing is based on data volume, not span count, and takes effect December 1, 2026 for both Traces and Workers Tracing. The Free plan gets 0.5 GB/day of ingestion with 7-day retention. Paid plans include 50 GB of ingestion and 10 GB-month of storage, then charge $0.25/GB ingested and $0.10/GB-month stored. Retention of up to one year is listed as coming soon.
The roadmap adds spans for DDoS rules, Access, Workflows, Queues and Pipelines, on-demand tracing of individual requests, and OpenTelemetry APIs in Workers for adding attributes to existing spans.
Remember
Cloudflare now emits OTLP spans for WAF, transform, cache, routing and origin steps, with no instrumentation needed.
Trace Rules let you sample 100% of one customer or debug header while the rest stays at 1%.
Pricing is by volume: $0.25/GB ingested and $0.10/GB-month stored, starting December 1, 2026.
Since April, Cloudflare has run the same background probe on Challenge Pages, the Turnstile-backed interstitials that WAF rules trigger to screen out bots. Challenge Pages appear across far more sites and networks than error pages, so they add a lot of sample volume and diversity, including networks outside the top 1,000. For now the probe runs on only a small fraction of eligible free Challenge Pages. Cloudflare says it will raise the sampling rate only if data quality improves and users see no added latency.
Read the 74% carefully
Cloudflare acknowledges that the improvement "coincides with" the new methodology. In many networks the leaders are 1–2 ms apart; the post's own example is Cloudflare at 50 ms and Fastly at 51 ms. A gap that small can reverse with normal daily variation. Cloudflare argues that more samples narrow the confidence interval around each trimean, so rankings get more stable. It also suggests that in some networks it used to rank second when it was only a millisecond or two slower.
The post doesn't separate how much of the 14-point gain came from actual network changes and how much came from the new sampling. It also publishes no confidence intervals or per-provider latency distributions. With more data, Cloudflare says it plans to weight results by user population, report per-country and global views, and estimate what share of total traffic the measured networks cover. Those views would say more than a count of networks won by a margin smaller than the noise.
Remember
Fastest-provider share rose from 60% to 74% of the top 1,000 networks, which is 150 more networks.
The ranking uses the trimean of TCP connection time from real browsers probing five CDNs.
The gain coincided with new Challenge Page sampling, and many network rankings turn on 1–2 ms gaps.
Shared state: app state such as a to-do list is stored in documents next to the transcripts, so multiple users or UIs can watch and steer one agent.
Hot-swapping: tool code can be updated while the agent runs. The next tool call picks up the new code.
The article gives no benchmarks for either release.
Model launches
GPT-6.1 Sol is mostly an efficiency update. Artificial Analysis measures $0.72 per Intelligence Index task at maximum effort. That compares with $1.04 for GPT-6 Sol and $3.26 for Astra. The savings come from fewer turns and cheaper cache reads, not just fewer output tokens.
Gemini 4 Argon shipped with revised pretraining mixtures and long-horizon post-training data. Google says it was tested for weeks by thousands of internal engineers before release. Its coding quality is disputed: Bloomberg cited anonymous insiders who criticized it, and a senior DeepMind engineer reportedly pushed back.
Upstage Solar Mini 4 has 35B total and 3B active parameters by the vendor's count, a 1M-token context window, and costs $0.10/$0.40 per million input/output tokens. It scores 83% on long-context reasoning but only 1% on Terminal-Bench 4.0. It produces about 88K output tokens per task, so even at 208 tokens/s the average task takes 7.1 minutes.
FLUX 3 adds native 4K image generation, up to ten reference images and bounding-box layout control.
Remember
Pi Durable records each agent step as a checkpointed task, so crashed agents and subagents resume from their exact last state.
Agent state and app documents live outside the process, which allows multiplayer steering and hot-swapping tool code while the agent runs.
GPT-6.1 Sol costs $0.72 per Intelligence Index task versus $1.04 for GPT-6 Sol, mainly from fewer turns and cheaper cache reads.