Meta Skips the Deploy Freeze at Halftime · Morning Gist
Friday, October 165 stories · 16 min
Meta Skips the Deploy Freeze at Halftime
Today Meta and Netflix explain how they run huge live traffic, build software with agents, ship a giant open coding model and measure recommendations honestly.
Picked from 29 new articles across 23 sources · arrow keys for other days
Today in 30 seconds
30s left
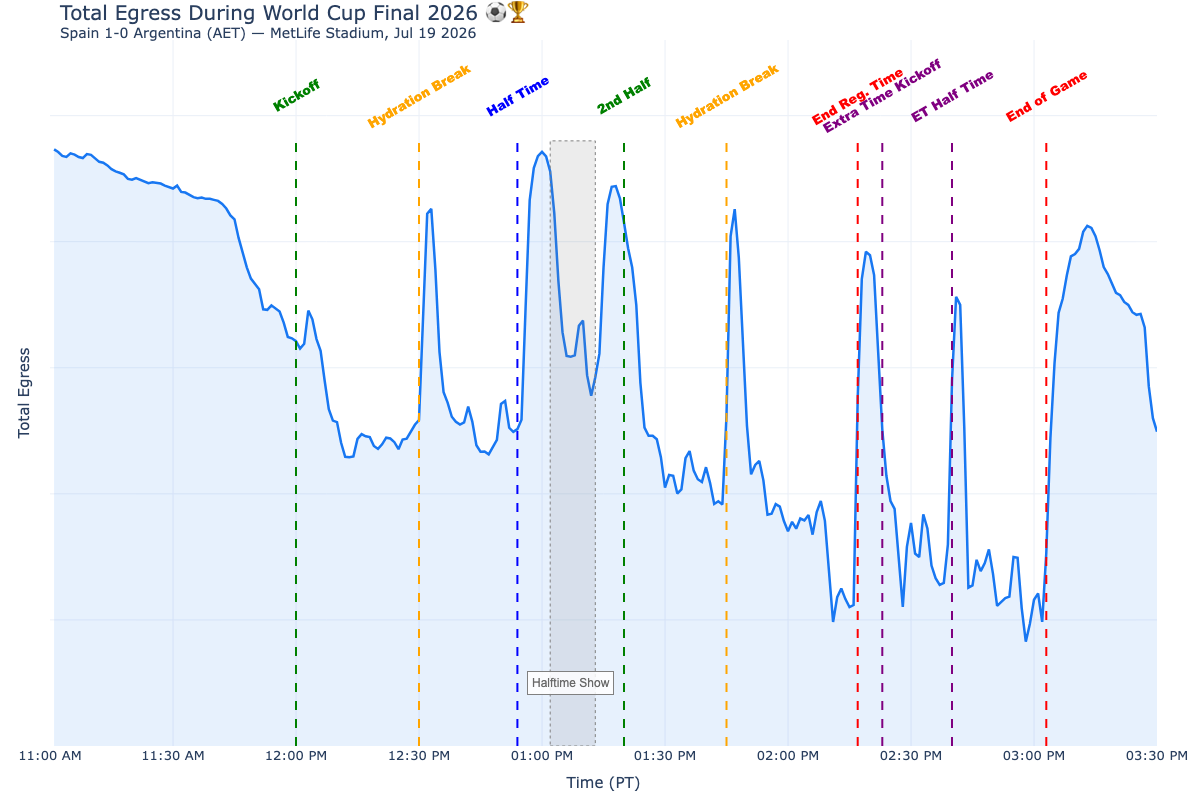
WhatsApp peaked at 30 million messages per second during the World Cup final. Meta kept deploying throughout, and the biggest surges came at breaks in play. story 1 ↓
Using AI agents to run the code-test loop, a small Meta team matched Facebook Groups features in eight weeks. Better tooling helped more than better prompts. story 2 ↓
Meta's open-weight Muse Spark Open has 816B parameters and runs 42B per token. A 2-bit version fits on a 512 GB Mac. story 3 ↓
Netflix dropped a database write from ad serving by joining streams in real time on Flink, and migrated the billing-critical system with no downtime. story 4 ↓
Netflix estimates its recommendations add 16% more viewing than random picks, mostly because they match titles to the right people. story 5 ↓
1/5Engineering at Meta· Oct 15
Meta's systems handled record World Cup traffic without a deploy freeze
During the 2026 World Cup, WhatsApp peaked at 30 million messages per second, an all-time record. Meta says it handled this with capacity reserved months ahead, per-region forecasts and selective load shedding, while still shipping code throughout.
Why it matters · It shows two usual safety moves, shifting load between regions and freezing deploys, being dropped on purpose, and it explains why each choice was made.
Know this first
Context from the editor, not the article · 38 sec
1 · Capacity planning for spikes
Big services run on a fixed pool of servers. A sudden surge, such as millions of people messaging at the same second, can overload them. Teams can buy spare capacity in advance or add machines automatically once load rises (autoscaling). Autoscaling takes minutes, though, and a spike can arrive in seconds.
2 · Two standard event playbooks
Before a known peak, operators often move traffic from busy regions to quiet ones, which works when peaks hit at different times. They also usually stop deploying new code (a 'freeze') so a bad release can't break things at the worst moment. This article explains why Meta did neither.
3 · Load shedding and cascades
2/5Engineering at Meta· Oct 15
Meta built its Forum app with AI agents running the code-test loop
Meta built Forum, a standalone app for Facebook Groups, with AI agents that plan, write, build and test code while engineers supervise and approve the results. The team says automated checks, not prompting, made this work.
Why it matters · This account of agentic development comes from a production team, and it argues that how much work you can hand to AI agents depends on how far you trust your automated checks.
Know this first
Context from the editor, not the article · 42 sec
1 · What a coding agent is
A coding agent is a large language model that does more than suggest text. It can run tools: edit files, start a build, run tests, read the output, and try again. Autocomplete helps one keystroke at a time. An agent can work through a whole task, from planning to producing code changes ready for review.
2 · The verification problem
AI-written code often looks correct and still fails. If nothing checks it automatically, a human has to read, run and debug every change. The bottleneck then moves from writing code to reviewing it. Teams try to fix this with automated checks such as compiling, unit tests and UI comparisons, which give a clear pass or fail.
3 · Mobile app development basics
3/5Hugging Face· Oct 15
Meta releases Muse Spark Open, an 816-billion-parameter open-weight coding model
Meta released downloadable weights for Muse Spark Open, a coding and agent model that reads text, images, audio and video. A mixture-of-experts design runs about 5% of its parameters per token. The launch includes no benchmark scores.
Why it matters · If its quality holds up, teams could self-host a frontier-scale coding agent on one 8-GPU server, or even one large Mac, instead of renting a closed model through an API.
Know this first
Context from the editor, not the article · 42 sec
1 · Open-weight models
An open-weight model is one whose trained numbers (the weights, or parameters) you can download and run on your own hardware. Closed models such as GPT or Claude are only reachable through the vendor's API. Open weights let you self-host, fine-tune and inspect the model, but you pay for the hardware.
2 · Tokens and memory
Language models read and write tokens, which are word fragments of a few characters. Every parameter has to sit in GPU memory. At 16 bits per number, 1 billion parameters take about 2 GB. Quantization stores each number in fewer bits (8, 4, even 2) to save memory, at some cost in accuracy.
3 · Agentic coding
4/5Netflix Tech Blog· Netflix Technology Blog· Oct 14
Netflix swaps an ad-serving database write for a real-time stream join
Netflix's ad server used to save details of every ad it showed to a database before the ad could play. Now it just logs them, and a Flink job matches each log with device events afterward. The database is retired.
Why it matters · It shows a common, reusable move: take a synchronous dependency off the critical path by logging first and joining later. It also shows how Netflix migrated a billing-critical system without downtime.
Know this first
Context from the editor, not the article · 37 sec
1 · What ad 'enrichment' means
When a device plays an ad, it reports events like "started" or "reached 25%" carrying only a small opaque token. Billing, reporting and partners need the full context: campaign, creative, price, tracking URLs. Only the ad server knows that. Enrichment means attaching that context to each device event.
2 · Kafka and stream processing
Kafka is a durable log that systems write events to and read from in order. Apache Flink is a framework that reads such streams continuously. It keeps per-key 'state' in memory or on local disk, and it saves periodic snapshots called checkpoints so a crashed job can resume without losing data.
3 · At-least-once delivery
5/5Netflix Tech Blog· Netflix Technology Blog· Oct 14
Netflix estimates its recommendations add 16% more viewing than random picks
Netflix researchers built a model of what members would watch under different recommenders and checked it against small randomized tests. Compared with today's system, random picks cut viewing 16%, popularity lists 12%, and an older personalized method 4%.
Why it matters · Recommendations decide what users see, so their effect can't be measured just by counting clicks. This shows one way to measure such a system honestly when switching it off isn't an option.
Know this first
Context from the editor, not the article · 38 sec
1 · What a recommender does
A recommender system ranks items, such as movies or products, for each user and shows the top ones. Netflix's homepage rows are built this way. The system shows each member titles it predicts they will like, so what a member sees depends on their past behavior.
2 · Correlation versus causation
Suppose people who are shown a title often watch it. That alone doesn't prove the showing caused the watching, because the system picked those people since they were already likely to watch. Separating the true effect of an action from this built-in selection is the classic problem of causal inference.
Under pressure, a system can deliberately drop low-priority work so the essential work keeps running. This is called graceful degradation. A cascade happens when overload in one layer floods the systems behind it, such as databases and data pipelines, and a local spike becomes a wider outage.
Meta's global outgoing traffic over the tournament, with surges lining up with breaks rather than gameplay.1 / 2
Meta has published how its apps handled the 2026 World Cup: 48 teams, 104 matches and 39 days, ending with the July 19 final between Argentina and Spain. WhatsApp hit more than 30 million messages per second during the final. That is an all-time record and 1.23× its New Year's Eve 2026 peak. The previous record, 29 million per second, had been set only 12 days earlier. In its busiest five minutes WhatsApp delivered nearly 8.4 billion messages, an average of about 28 million per second. Live-video watch time rose 242% on Facebook and 90% on Instagram.
Spikes came during breaks
When Meta lined match events up against outgoing traffic, the surges did not follow goals or exciting play. They followed pauses: halftime, hydration breaks, the final whistle and the awards ceremony. People watch while the ball is in play, then all share at once when it stops. The biggest peak of the tournament came at the end of regulation time in the final, when traffic rose 46% in about four minutes.
How the spikes were absorbed
Meta's routing systems spread the load. 1 decides which datacenter serves which users. 2, a network-level load balancer, and 3, an HTTP proxy, divide connections across servers. Autoscaling adds machines as demand grows.
Instagram added four protections:
Capacity buffers reserved in advance, so spikes never had to wait for 4. Meta calls these its most effective lever.
Graceful degradation, meaning non-critical background work was switched off in the busiest countries (Brazil, Argentina, India, Indonesia and Spain) during high-risk matches.
Cascade prevention, which stopped overload at the front-end servers from flooding the data systems behind them.
Early-warning alerts that fired before capacity limits were reached.
Two usual moves, skipped on purpose
For WhatsApp, Meta load-tested and resized more than 100 services, then retested them as the knockout rounds raised demand. It also broke from its normal event playbook in two ways.
First, it did not shift traffic between regions. That trick works on New Year's Eve, when midnight arrives hours apart in different places. A World Cup final peaks everywhere at the same moment, so no region has spare capacity to lend. Meta forecast each region's peak separately instead.
Second, it did not freeze deploys. Teams kept shipping code on their normal schedule, even during the peak. Meta credits years of reliability work for making that safe.
Caveats
This is a celebratory post, not a postmortem. It gives no error rates, latency figures or buffer sizes, and offers no evidence for why skipping the freeze was safe.
Meta's production engineering team has published a review of how its apps got through the 2026 FIFA World Cup. The tournament had 48 teams and 104 matches over 39 days, and it ended with the July 19 final between Argentina and Spain. Meta calls it "the largest planned stress test of our infrastructure," and several records fell at once. The post has no outages to report. Its interest lies in the traffic pattern it found and in two standard operating practices Meta chose to abandon.
The numbers
WhatsApp: more than 30 million messages per second during the final. That is an all-time platform record and 1.23× the New Year's Eve 2026 peak. The previous record, 29 million per second, had been set 12 days earlier during the Round of 16 match between Argentina and Egypt.
WhatsApp's busiest five minutes: nearly 8.4 billion messages delivered. That averages about 28 million per second (8.4B ÷ 300 s), so the peak was a sustained plateau rather than a single instant.
Messenger, Threads and Instagram Direct: 49 million messages per minute at peak.
Instagram: recommendation-system traffic up to 80% higher week over week. Players in the final squads gained 213.6 million followers between them, a 6.6% rise from 3.26 billion to 3.47 billion.
Live video watch time: up 90% on Instagram and 242% on Facebook against the July baseline.
Threads: 1.5 billion impressions on tournament-tagged posts, reaching about 15 million people a day with a peak of 25 million on July 6. Facebook: 80 million posts mentioned the World Cup.
Traffic followed the breaks, not the ball
Meta lined match events up against global 1, meaning data flowing out of its servers to users. The surges did not line up with goals or exciting play. They lined up with pauses: hydration breaks, halftime, extra time, the final whistle and the awards ceremony. The single biggest peak of the tournament came at the whistle ending regulation time in the final. Traffic rose 46% in about four minutes at the end of regular time, then 57% over about 15 minutes at the final whistle.
The explanation is simple once you see it. While the ball is in play, people watch. When play stops, they all reach for their phones together to react and share. Meta says every capacity decision it made followed from this pattern. The spikes are very steep, they are synchronised worldwide, and their timing is largely predictable, because a schedule fixes when halftime happens.
The infrastructure layers
Meta names the systems that absorbed these spikes without anyone stepping in by hand:
Months before kickoff, edge teams also worked with internet service providers (ISPs) to put network upgrades where they would most improve users' experience. That capacity is permanent and stays after the tournament.
Instagram: buffers first
For Instagram, the tournament meant 39 days in a row of spikes across machine-learning inference (running recommendation models live), Feed, Stories, Explore and the data pipelines behind them. In the final, the post says Instagram Feed traffic rose 76% above the previous day in the minute the match ended and stayed about 21% higher for two hours. The sentence also mentions halftime, so the exact moment it describes is unclear. Meta rolled out four measures in stages as the bracket narrowed:
Capacity buffers. Meta reserved extra capacity in advance on every serving tier, so spikes never had to wait for 7 to catch up. Meta calls this its single most effective lever. Autoscaling responds after demand appears, and a +46% jump in four minutes can arrive faster than new servers can start.
Meta has turned all of this, including the rollout timeline and the conditions for switching on degradation, into a reusable runbook for events such as the 2028 Olympics.
WhatsApp: two playbook moves skipped
WhatsApp's spikes came with goals and the final whistle and lasted four to five minutes each. To prepare, Meta load-tested and resized more than 100 internal services, then repeated the tests and resizing as the knockout rounds raised demand.
The more interesting part is what WhatsApp chose not to do.
It did not shift load between regions. For events like New Year's Eve, Meta normally spreads demand around the world. Midnight reaches each time zone hours apart, so quiet regions can take overflow from busy ones. A World Cup final happens at the same instant everywhere, so every region peaks together and no region has idle capacity to lend. Meta therefore stopped deriving each region's demand from one global multiplier and forecast each region's peak on its own.
It did not freeze deploys. The usual practice is to pause 9, the automated, frequent shipping of code changes, and to postpone risky operations such as disaster-recovery drills during a major event. Meta skipped the freeze entirely, citing years of reliability work. Teams shipped on their normal schedule throughout, including at the peak itself.
What the post leaves open
This is a celebratory write-up, not a postmortem. It reports no incidents and no error rates or latency figures, so "without interruption" has to be taken on trust. It does not say how large the capacity buffers were or what they cost, and it does not show the mechanics of 10 prevention. The no-freeze decision is the most notable claim, but the post gives no evidence for it, such as how many deploys went out during peak windows or how quickly bad changes are caught and rolled back. The useful lesson is the reasoning behind both skipped moves. Moving load between regions only helps if the peaks are spread out in time, and autoscaling only helps if the ramp is slower than the time it takes to add servers.
Remember
Traffic peaked during breaks in play, not during the action, so the timing of spikes could be largely predicted from the match schedule.
Shifting load between regions fails when every region peaks at the same moment, so Meta forecast each region separately.
Capacity reserved in advance beat autoscaling, because the spikes ramped up faster than new servers could come online.
Mobile engineers usually test apps in a simulator, a program that imitates a phone on a computer. The screen is built from a view hierarchy, a tree of on-screen elements. A build flavor is a variant of the same app compiled from shared code with different parts switched in or out.
feature gating
Shipping code that is switched off by a flag, so it exists in the app but isn't active.
Forum's interface: the standalone Groups app the team built with agents.1 / 3
Meta has described how a small team built Forum, a new standalone app for following Facebook Groups conversations, by making an AI 1 part of the engineering process. An agent here means a language model that can run tools such as builds and tests, not just suggest code. Forum reached core feature parity with Facebook Groups in eight weeks.
The shift: supervising instead of driving
In human-in-the-loop work, the engineer drives every step and the AI assists, for example by finishing a function. Meta aimed for 2: the agent runs the plan, build, test and fix cycle itself, while the engineer sets the goal, watches, steps in when it drifts, and approves the result. Meta calls this a target. Some stages still need an engineer in every iteration.
The catch is trust. The authors argue that unverified AI code just moves the bottleneck from writing code to reviewing code "that looks finished and isn't." So a task counted as done only after automated tests and visual checks passed, not when the code compiled. Each 3 (a proposed change submitted for review) arrived with build results, test outcomes and recorded verification sessions. An engineer still signed off on everything.
How they made it work
Meta says the gains came from changing code and tooling, not prompts:
Tools instead of descriptions. The agent kept editing the wrong screen. The team let it read the live 4 (the tree of on-screen elements) from a , a program that imitates a phone, before acting. Wrong-screen edits dropped sharply.
Agents as testers
Agents ran repeatable stress scenarios such as rapid scrolling and navigation across builds. One run found a memory problem. The agent reproduced it, proposed a fix and verified it, which roughly halved memory use and 7 (a sign of memory pressure) before launch. After launch, investigation agents look into user feedback and write up likely causes for engineers. One weak category of investigation improved only after the agent got the same onboarding docs a new hire would.
Caveats
Apart from the memory figure and the eight weeks, the post gives no hard numbers: nothing on defect rates, review time or team size. Forum was also a new codebase the team could freely rebuild, which legacy systems usually aren't.
Meta has published an account of how a small team built Forum, a new standalone app for people who want to go deeper into conversations in their Facebook groups. The team built it from scratch, and it also served as an experiment. Instead of using AI as faster autocomplete, the team made an AI 1 (a language model that can run tools such as builds and tests, not just write text) a participant in the engineering process. Success was not measured in lines of code produced. The team counted "verified, production-ready outcomes": changes that build, pass tests and survive human review.
From in-the-loop to on-the-loop
The post contrasts two setups. In human-in-the-loop, the engineer drives every step and the AI helps inside it: finishing a function, suggesting a fix, answering a question. Work moves at the speed of the person driving.
In 2, the agent runs the cycle itself: plan, implement, build, test, correct, repeat. The engineer sets the goal, watches, steps in when the agent drifts, and approves the result. Meta says this is a target, not where it is today. Some stages run on their own, while others still need an engineer in each iteration.
The payoff is parallelism. If engineers supervise instead of sitting through every cycle, several cycles can run at once. But this only works if the output can be trusted. The authors say weak verification doesn't remove the bottleneck, it moves it: engineers stop writing code and start reviewing code "that looks finished and isn't." So the team set the bar at verification, not compilation. A task counts as done only once automated tests and visual checks pass. The agent checks its own work first, so reviewers see fewer, higher-confidence changes. Every shipped change still needs an engineer's sign-off. Each 3 (a proposed code change submitted for review) arrives with build results, test outcomes and recorded verification sessions.
Four capabilities that let the loop run alone
Planning as specification. An engineer can resolve vague instructions by intuition, but an agent fails on them. The team invested in breaking work down carefully up front and writing context in a machine-readable form.
Verification inside the loop. Build status, unit tests (small automated checks of individual functions) and UI spec matching feed pass/fail signals straight back to the agent. Meta calls this the "force multiplier." It also says how much work can be handed off is limited by how much it trusts these checks.
Simulated users. "Navigation agents" tap through the live app the way a person would, read the screen, and report regressions (things that used to work and now don't). They can repeat the same paths continuously.
Production operations. After launch, agents take user feedback, look for possible regressions, and pass their analysis to engineers, who decide what to do.
The machinery
Five building blocks hold this together:
Rules are permanent project instructions. If the agent repeats a mistake more than twice, the correction is written down once and applies to everyone.
Changing the environment, not the prompts
Meta says the biggest gains came from changing code and tooling. Three examples:
Legible architecture. The team kept the codebase simple and split key pieces into modules agents could easily plug into. Where existing infrastructure was too tangled, they rebuilt it, giving up reuse in exchange for agent speed. Their reasoning: agents copy the patterns they read. If you fix a weak pattern once, every future session inherits the fix. If you leave it, the agent repeats it everywhere.
Tools, not descriptions. The main failure was the agent losing track of where it was in the app. It would edit the home feed when asked to change the group home screen, or guess at screen coordinates. Rather than describe the app in a prompt, the team gave the agent tools to check for itself. It could read the live 6 (the tree of on-screen elements) from the simulator, list what is actually on screen, and look up the path to a target view before acting. Misdirected edits "dropped sharply"; the post gives no figure.
Build-level isolation. Feature gating, where unfinished code ships but is switched off, still puts prototype code inside the production app. Meta wanted a stronger guarantee. It created a separate 7: a sandbox app with the same codebase, frameworks and design system. A plugin/socket architecture means prototype code is left out of the production build entirely. Designers could then prototype with AI tools without an engineer, sandbox work could move to production without being rebuilt, and prototype code could not crash the real app because it wasn't in it.
Agents as testers
The team didn't aim the agent at known bugs. It set up repeatable stress scenarios that imitate real use: aggressive scrolling, random group browsing, rapid navigation, repeated media loading. These ran routinely across builds and produced consistent signals: crashes, memory growth, 8 (when the app needs memory the operating system must fetch or map in, often a sign of memory pressure) and UI regressions. In one run the agent spotted a memory problem, isolated a reproduction, proposed a fix and verified it with the same harness. Meta says this roughly halved memory use and page faults, before any user saw the app. Engineers still made the architectural decisions.
The feed and investigations
For Forum's feed, agents laid out architectural options and trade-offs, and engineers chose. The team deliberately kept one thing human: deciding what a good outcome looks like, which it calls a product judgment. In operations, questions that once needed the one engineer who knew a code path now go to an investigation agent. It gathers evidence and posts a write-up with suggested fixes. An engineer then decides whether a finding is a real bug or a deliberate trade-off. The team hand-scored a batch of real investigations to arrive at this workflow. One category stayed weak until the agent got the same onboarding a new hire gets: pointers to the relevant code, example queries and design docs. Quality then "jumped." The difference from onboarding a person is that you do it once and every future session starts from it.
Results and open questions
Forum reached core feature parity with Facebook Groups in eight weeks. The memory issue was caught before launch, and agents now help triage user feedback. The evidence is thin, though. Apart from "roughly halving" memory, there are no numbers on defect rates, review time, how often agents' output was rejected, or how many engineers were involved. The two summary charts of what worked and what didn't come without text. And because Forum was a fresh codebase that could be rebuilt freely, the results may not carry over to large legacy systems.
Remember
Meta set "done" at passing tests and visual checks, not at compiling, so reviewers saw fewer, better-evidenced changes.
Letting the agent read the app's live state worked better than describing the app in prompts.
Giving agents onboarding-style context (code pointers, example queries, design docs) improved weak investigations more than prompt tweaks did.
An agentic coding model runs a loop. It plans a step, calls a tool (a shell, a file editor, a browser), reads the result and decides what to do next. This repeats until the task is done. These loops are long, so a large context window and reliable tool-call formatting matter more than in a single chat reply.
Architecture overview: the language model with mixture-of-experts layers plus image and audio encoders.1 / 4
Meta has released Muse Spark Open, a large 1 model, meaning anyone can download and run it. It reads text, images, audio and video, writes text, and was trained mainly for 2: reading a codebase, writing and debugging code, and calling tools in a loop over long tasks. Meta calls it the most capable US open-weights model to date. The Hugging Face launch post includes no benchmark scores to back that claim.
A big model that runs like a smaller one
The model has about 816 billion parameters, the learned numbers that make up a neural network. Only about 42 billion are used for each token (a word fragment). That is possible because it is a 3 model. Each of its 62 layers holds 256 small sub-networks called experts, and a router picks 8 of them for each token. The experts hold about 97% of the weights.
The catch is memory. All 256 experts must stay loaded because any token might need any of them. You pay for memory like an 816B model and for compute like a 42B one. The full 16-bit (4) checkpoint is about 1.5 TB and needs 32 Nvidia H200 GPUs across four servers. A 4-bit version, 5, built for Nvidia's newer Blackwell GPUs, fits on one 8-GPU server.
Long, mixed inputs
The context window, meaning how much input the model can consider at once, is about 1 million tokens, shared by text, images, audio and video. While generating, the model keeps a 6, stored data for every earlier token. A design called grouped-query attention, in which many attention heads share stored data, keeps that cache to about 250 KB per token, or 266 GB at the full million. Audio becomes 12.5 tokens per second. Video is sampled at 2 frames per second, up to 96 frames.
Running and tuning it
The model runs in the main open serving tools: transformers, 7, 8, 9 and Apple's MLX. On a Mac M3 Ultra with 512 GB of memory, a 2-bit version uses 304 GB and generates 18 tokens per second. A 3-bit version uses 344 GB and generates 21 tokens per second. Reasoning can't be switched off. Effort runs from low to xhigh, and xhigh is the default.
The team fine-tuned it on 64 H100 GPUs in about 2 hours with 10, which trains small add-on matrices and leaves the experts untouched. Loss fell from 1.26 to 0.57. The task was adapting the model to a new chat format, so this shows the training recipe works, not that the model gained capability.
What's missing
The post has no benchmarks, no training-data details, and no measured accuracy cost for the 4-bit and 2-bit versions. The demos, including a browser agent that works only from screenshots, are anecdotal.
Meta has released Muse Spark Open, a large 1 model, announced in a post on Hugging Face's blog. It takes text, images, audio and video as input and produces text. Meta says it trained the model mainly for 2, meaning work done in a loop: reading a codebase, refactoring across files, debugging over long sessions and calling tools. The post calls it "the most capable US open-weights model to date". It publishes no benchmark scores to support that claim, so treat it as Meta's claim for now.
It is the large sibling of Muse Glimmer, a smaller dense model Meta released in August. The two share a tokenizer, which is the component that splits text into tokens.
The core trade: memory versus compute
The model has about 816 billion parameters, but only about 42 billion are used for each token. That gap comes from a 3 design.
In a standard transformer layer, every token passes through one big feed-forward network, a block of matrix multiplications. Muse Spark Open replaces that block in each of its 62 layers with 256 smaller networks called experts. A small learned router looks at each token and sends it to 8 of the 256. Each expert projects the token's 8,192-number vector down to 4,096 numbers and back up. Experts hold about 97% of all parameters.
An analogy: think of a hospital with 256 specialists where each patient sees only 8. Each visit is quick, but the building still has to hold all 256 offices. The model works the same way. Compute per token is that of a 42B model, while memory must hold all 816B, because any token might need any expert.
In concrete terms:
The 4 checkpoint (16-bit numbers, the usual training precision) is about 1.5 TB. In Hugging Face's transformers library it needs 4 servers of 8 Nvidia H200 GPUs.
The 5 checkpoint (a 4-bit format for Nvidia's Blackwell GPUs) fits on a single 8-GPU B200 server. The post says the accuracy loss is negligible but gives no numbers.
Other architecture details
Attention, the step where each token looks at earlier tokens, uses 128 query heads but only 16 key-value heads. This is 6: several query heads share one set of stored keys and values. The other details are a gate on the attention output, normalization of queries and keys ("QK-norm"), and a learned gate on each layer's residual connection in place of a plain sum.
GQA matters because of the 7. When a model generates text, it stores keys and values for every earlier token so it doesn't recompute them. The post does the math: 2 (key and value) × 16 heads × 64 dimensions × 62 layers = 126,976 numbers per token. At 2 bytes each that is about 250 KB per token, or about 266 GB for a full 1-million-token context. With 128 KV heads it would be eight times larger.
The context window, meaning how much input the model can consider at once, is about 1 million tokens. Text, image, audio and video tokens all share it.
How other inputs become tokens
Images and video go through a 1.8B-parameter vision encoder. It is based on Meta's earlier Perception Encoder work and splits images into 14×14-pixel patches. Video is sampled at 2 frames per second by default, up to 96 frames, with text timestamps such as "Time: 3.5s" placed between frames. A higher frame rate catches short events but costs memory and slows the initial processing of the input.
Audio must be mono at 24 kHz. A convolutional encoder emits one token every 80 ms, which is 12.5 tokens per second, so a 10-second clip becomes 125 tokens. Video can now include its soundtrack, which Glimmer could not do.
Reasoning and tool calls
The model always reasons before answering, and reasoning can't be turned off. You choose an effort level, low, medium, high or xhigh (internally 16, 64, 256 or 512), and the default is xhigh. For easy tasks, setting it to low saves tokens.
Output uses 8, a channel-based chat format first used by OpenAI's gpt-oss. The model labels each message with a recipient: to=self for private reasoning, commentary for notes the user sees between tool calls, to=user for the final answer, or a tool name such as to=weather.get followed by the call's parameters. The post suggests checking which channel the model chose when output quality looks off.
Running it
Support covers transformers, 9 and 10 (high-throughput GPU serving engines), 11 (a lightweight engine popular for local use) and MLX (Apple's machine-learning framework). Reported numbers:
Setup
Memory used
Speed
llama.cpp, 2-bit quant, Mac M3 Ultra 512 GB
304 GB
18 tokens/s
oMLX, 3-bit "oQ3e" quant, same Mac
344 GB
21 tokens/s generating, 225 tokens/s reading the prompt
SGLang, NVFP4
4 × GB300 GPUs
not given
vLLM, NVFP4
4 Blackwell GPUs, 128K context
not given
Hugging Face's hosted Inference Endpoints offer NVFP4 on 8 × RTX Pro 6000 for 128K context, or 8 × H200 for the full 1M. The 2-bit run shows this frontier-scale model fitting on one desktop machine. The authors also note the quantized model "requires a bit more steering", which suggests some quality loss.
Fine-tuning
The team fine-tuned the model with TRL, Hugging Face's training library, on 64 H100 GPUs (8 servers). They used 12, which trains small add-on matrices instead of the full weights, and applied it only to the attention projections, leaving all experts frozen. 13 (Fully Sharded Data Parallel) split the weights across all 64 GPUs. 14 split each layer's 256 experts into 8 groups, so each token is sent to the GPU holding its chosen expert. Training on 2,048-token sequences took 500 steps, about 2 hours, at roughly 8,000 tokens per second. Loss fell from 1.26 to 0.57 and token accuracy rose from 72% to 84%.
Keep the scope of that result in mind. The task was adapting the model to an open dataset's chat format, so the curves show the training recipe works. They are not evidence of new capability. One limitation: checkpoints save only the adapter, not the optimizer state, so an interrupted run can't resume.
Demos and what's missing
The demos include a coding agent that writes Three.js 3D scenes, screenshots them and critiques its own renders. Another is a browser agent that acts from screenshots alone, with no access to the page's HTML. A third takes a voice request and shops for a product on Amazon. They are interesting but anecdotal.
The post leaves out benchmark comparisons, training data, training compute and any measured accuracy cost of the 4-bit and 2-bit versions. Before relying on the model, wait for independent evaluations.
Remember
In mixture-of-experts models, cost per token follows active parameters (42B) while memory follows total parameters (816B).
Grouped-query attention keeps a full 1M-token context to about 266 GB of KV cache.
No benchmarks were published; the claim that it's the most capable US open model is unverified so far.
Pipelines that never lose events usually deliver some of them more than once, because a sender retries whenever it isn't sure a message arrived. That makes duplicates unavoidable. Anything that counts money has to recognise and drop repeats, which is called de-duplication.
Old design: the ad server writes metadata to a replicated registry, and the publisher reads it back.1 / 3
Netflix has rebuilt the core of its Ads Event Publisher, the system that turns raw ad telemetry from devices into the events that billing, reporting and 1 rely on. Frequency capping limits how often one viewer sees the same ad. The rebuild swaps a per-ad database write for a real-time stream join in 2, a framework for processing event streams while keeping state. The old database has been deleted.
The problem
A device playing an ad knows almost nothing about it. It holds an opaque token and fires events like "25% watched." The ad server knows the campaign, the creative, the price and the tracking URLs. Before the rebuild, the ad server wrote those details to a globally replicated 3, the Ads Metadata Registry, and waited for confirmation before serving the ad. The publisher then looked them up for each device event.
Live events broke this model. A fight streamed to over 100 million viewers means millions of must-succeed writes per second during an ad break. The registry couldn't safely add capacity mid-event, it had no fallback (if it failed, ads stopped), and slow lookups delayed the events frequency capping needs quickly.
The fix
Now the ad server simply logs its response to 4, a durable event log, and moves on. A Flink job joins those responses with device events by impression key:
If the response is already there, the event is enriched immediately.
If the event arrives first, it waits up to 60 minutes for its response. About 99.999% of events arrive within that window.
Events that never match go to an hourly Spark batch job, which pairs them with data from the warehouse.
Responses stay in the region where the ad was served. When a device switches networks and its event lands in the wrong region, the serving region encoded in the token tells the job where to forward it. This avoids copying every response to every region.
Duplicates are dropped using a hash of fields that identify each event, stored locally in Flink. Netflix calls this best-effort. Billing still de-duplicates on its own over longer windows.
Switching over safely
Both pipelines ran on all traffic while automated audits compared their output. A stable key on each event decided which pipeline published it, so nothing was counted twice, and traffic moved over slice by slice. At full cutover the two pipelines agreed on more than 99.99% of events.
Results
In a load test, one AWS region handled an ad break at "hundreds of thousands of events per second" with negligible errors. The article gives no latency or cost figures. Its main gain is reliability: a database outage can no longer stop ad serving.
The news
Netflix has published the second part of its series on the Ads Event Publisher. This is the system that collects ad telemetry from devices, adds the details of the ad that was actually served, and sends one unified stream to 1, metrics, billing, measurement partners and reporting. Part II, by Yogesh Nagarur, covers a rebuild of the enrichment step. The old version wrote every impression to a database and read it back. The new one is a real-time streaming join in 2, a framework for stateful processing of event streams. The legacy service and its database have both been deleted.
The old design
When the ad server picks an ad, it knows the campaign, the creative, the price, the targeting context and the tracking URLs partners expect. The device knows almost none of this. It gets an opaque token and instructions for when to fire events.
Before the rebuild, the ad server wrote each impression's metadata into the Ads Metadata Registry, a globally replicated 3. It put only reference IDs into the token. When a device event arrived, the publisher decoded the token, looked up the metadata and merged the two. Global replication meant an event could land in any region and still find its data.
Why live events broke it
The pressure came from live streaming: NFL games, fight nights, and the FIFA Women's World Cup in 2027. A live event can climb toward tens of millions of concurrent viewers within minutes and drain just as fast. Netflix gives the Jake Paul vs. Mike Tyson fight, with over 100 million viewers, as the reference point. One ad break at that scale would have needed millions of must-succeed database writes per second. Each write had to be acknowledged before the ad could serve. The team names three problems:
Scaling. Adding nodes to the registry during an event reshuffles data across the cluster, which can slow or fail the very writes you are adding capacity for. The only safe choice was to provision for the forecast peak in advance and hope the forecast was right.
Critical-path dependency. The registry had no fallback, so if it was unhealthy, ad serving stopped.
Freshness. Slow writes or lookup timeouts pushed events into retries and 4 (holding areas for failed messages). That made them late. Frequency capping, which decides whether the next ad would break a policy such as "no more than N views", needs events within a strict deadline.
The team's question: the ad server already logs everything about each response. Why not drop the write and match those logs against the device-event stream in 5 afterward?
The new pipeline
The publisher is now a Flink job with five stages:
Normalize events from on-demand, live, playback and embedded ad breaks into one common shape.
Re-route events to the region that holds their matching serving response.
Join each device event to its ad-server response.
Deduplicate revenue-bearing events.
Publish partner measurement beacons and enriched events to downstream consumers.
How the join works
The join is a custom operator built on Flink's KeyedCoProcessFunction. This is a low-level API that receives two streams partitioned by the same key and lets the code manage per-key state directly. Here the key is the impression. There are three outcomes:
The response is already stored when the event arrives: enrich it immediately.
The event arrives first: hold it for up to 60 minutes (a configurable setting) until the response appears.
Nothing arrives in time: mark the event unmatched and recover it later.
Netflix chose not to use Flink's built-in windowed joins. Downstream consumers handle ordering, so the job only needs key matching, not time-window semantics. Owning the operator means retention can be tuned per stream, and unmatched events can later be persisted elsewhere without rewriting the join.
A worked example from the article: during a live game, the ad server logs its response. Seconds later the device fires a "first quartile" event (25% of the ad watched) carrying the token. The response is already waiting under the same key, so the event leaves with campaign, creative, price and tracking URLs attached.
Why 60 minutes? About 99.999% of events arrive well before then. A longer window would grow the stored state and slow 6, the periodic snapshots Flink takes for crash recovery, to catch a tiny fraction more.
Cross-region routing
The serving response stays in the region where the ad was served. But a device that switches from home wifi to mobile data partway through an ad can send its events to a different region. Copying every response to every region would let any region match any event. Netflix rejected that because most copies would never be used. Instead, the serving region is encoded in the token, and a misrouted event is forwarded to the region that owns its response. For example (illustrative), an ad is served in eu-west-1 and its event lands in us-east-1, which reads the token and forwards it. Only genuinely cross-region events pay the extra hop.
The long tail
Events from devices that were offline, ads that were paused, or engagement signals that arrive hours late are set aside. An hourly Spark batch job, scheduled by 7, Netflix's workflow orchestrator, pairs them with responses stored in the data warehouse and publishes them through the same sinks. The same job can replay dead-letter queues and backfill historical data.
De-duplication
Delivery is at-least-once, so the job computes a stable ID for each event by hashing the ad ID, the event type and, for repeatable events, an offset or timestamp. Previously the IDs were checked against an external key-value store over the network. Now the stream is keyed by event ID, so every copy of an event reaches the same worker, and a local state store with a short time-to-live remembers recent IDs. This removes the network hop and the race condition the external store had to guard against. Netflix is explicit that this is best-effort, not exactly-once. Cross-region reroutes, late recoveries and restarts can let duplicates through, so the ID travels with each event and billing runs its own de-duplication over longer windows.
The rollout
Both pipelines processed all traffic in parallel. Automated audits flagged any drift between them and caught discrepancies that dashboards would have missed. The enrichment logic lived in one shared module used by both pipelines, so any mismatch pointed to a difference in pipeline mechanics, not in business logic. Cutover used a deterministic split: a stable key on each event decided which pipeline published it, so nothing was counted twice. The threshold rose slice by slice, region by region, and could be pulled back instantly. At full cutover the two pipelines agreed on well over 99.99% of events. Then the registry writes were switched off and the old components were removed.
Netflix's Flink platform team, which runs more than 25,000 Flink jobs, helped shrink state and shorten checkpoints, especially the slow first one. Deploys keep the old job running until the new one shows healthy checkpoints.
Results and open questions
Ad serving no longer depends on a database write. In a load test, a single AWS region handled one ad break at "hundreds of thousands of events per second" with "negligible" timeouts, joining "the large majority" in real time. Those are the article's only performance figures. It gives no latency percentiles, cost comparison or exact match rate. Next on the list: larger live audiences, moving delayed engagement events fully into streaming, and smaller Flink state.
Remember
Replacing a synchronous write-and-wait with log-then-join removed a whole class of outages from ad serving.
Sending a misrouted event to the region that holds its data beat copying all data to every region.
A deterministic per-event split during cutover kept anything from being published twice while both pipelines ran.
The cleanest way to measure an effect is an A/B test: randomly split users and treat each group differently. A counterfactual is a 'what if' outcome that never happened, such as what members would have watched under a different recommender. Models are used to estimate counterfactuals that can't be tested directly.
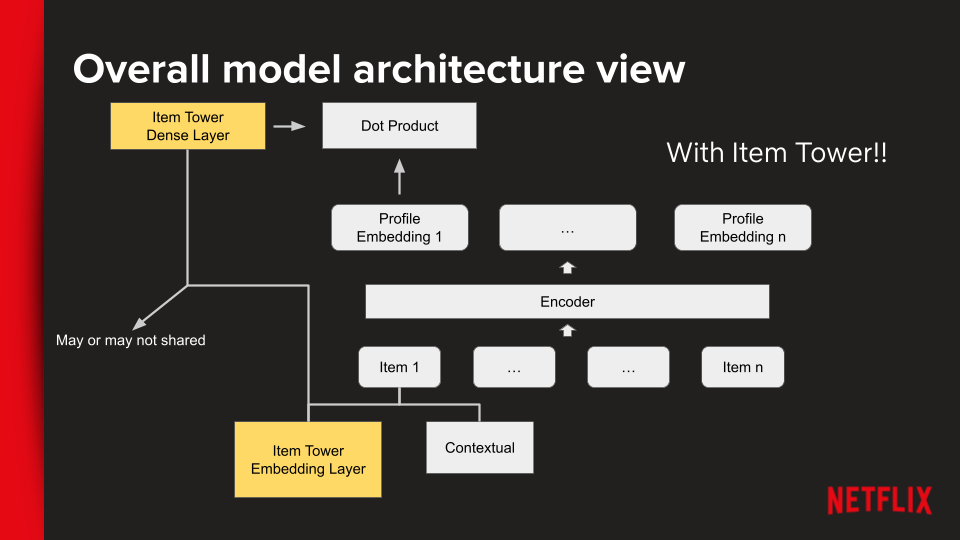
The model's structure: each choice reflects member-title affinity plus a separate boost from being recommended.1 / 4
Netflix researchers have published a paper in the International Journal of Industrial Organization, which they are also presenting at the ACM Conference on Economics & Computation (EC '26). It estimates how much the company's personalized recommendations actually change what members watch.
Why this is hard to measure
The obvious metric is the share of viewing that comes from recommended titles. That number overstates the effect. A 1, software that picks which titles each member sees, shows a title because it predicts the member will like it. When she watches it, you can't tell whether the recommendation caused the watch or whether she would have found the title anyway. The clean fix would be to switch personalization off for many users, but that would give them a much worse service.
The approach
The team built a model of daily choice. Each day a member either watches one title from the catalog or watches nothing. The model learns a compact numeric profile for every title and a "current taste" profile for every member, updated from what that member has watched recently. Titles with similar profiles act as substitutes, so losing one rom-com sends viewers mostly to other rom-coms. When a title is recommended, the model adds a "bonus" to its chance of being picked. That bonus is the recommendation's effect, kept separate from the member's own taste.
To check the model, they ran small 2, randomized experiments that slightly pushed some categories of titles up or down for different groups of members. These tests measured 3: when a title is shown less, where does its lost viewing go? The researchers fitted the model on the control group only and then predicted the test results. The predictions correlated with the measured ratios at 0.86.
What they found
Holding everything else fixed, the researchers swapped out today's recommender in simulation:
Random recommendations: 16% less viewing
Popularity-based recommendations: 12% less
Matrix factorization, an older personalized technique: 4% less
Popularity lists and 4 also concentrated viewing on fewer titles. Today's system kept viewing spread across a wide range of titles.
The team also split each title's recommendation lift into three parts. Exposure is the effect of simply being shown. Selection means the title was shown to people already likely to watch it. Targeting means it was shown to people whose decision the recommendation actually changes. Being shown roughly triples an average member's chance of watching a title. Even so, exposure explains only about 7% of the gap, and the targeting effect is nearly seven times larger. Targeting helps mid-popularity titles most.
Caveats
Everything depends on one assumption: once you account for what the recommender knew, which titles it showed is effectively random. The bonus is also a simple stand-in for how recommendations really work, and the validation covered only a few nudged titles. Finally, this is Netflix measuring its own system.
Six Netflix researchers (Kevin Zielnicki, Guy Aridor, Aurélien Bibaut, Allen Tran, Winston Chou and Nathan Kallus) have published a paper in the International Journal of Industrial Organization, an economics journal. They are also presenting it at the ACM Conference on Economics & Computation (EC '26). The paper puts a number on what Netflix's personalized recommendations are worth. Under the current system, members watch 16% more than they would with random recommendations, 12% more than with popularity lists, and 4% more than with 1, an older personalized method. The methods behind those numbers are as interesting as the numbers themselves.
The measurement problem
A 2 chooses which titles appear on each member's homepage. A tempting way to value it is to count what share of viewing comes from recommended titles. The authors argue this answers the wrong question. Recommendations are deliberately aimed at demand: a title shows up because the system predicts you'll want it. If you then watch it, the data mixes two things. One is the recommendation's causal push. The other is the preference you already had.
The textbook fix is a large experiment that replaces personalization with something generic for many members. That would produce clean data, but it would also degrade the product for those members, so Netflix rejected it. Instead the team used a hybrid. They fit a behavioral model to ordinary production data, then checked it against small, cheap 3, meaning randomized experiments in which members are randomly assigned to slightly different treatments.
How the model works
The model treats viewing as a daily choice. Each day a member picks one title from the catalog, or picks the "outside option" of watching nothing. Its output is the probability of each choice, given the member's preferences, recent history and the recommendations shown.
A naive choice model assumes that when a title disappears, its viewers spread across all other titles in proportion to their popularity. Real behavior doesn't work that way: someone weighing a romantic comedy turns to other romantic comedies. To capture this, the authors use a 4. Each title gets a short learned vector, a list of numbers often called an 5. Each member gets a matching vector, and how well the two vectors match sets the member's affinity for the title. These vectors are learned from viewing behavior rather than from labels like genre or release date, so they can pick up similarities that labels miss.
Member vectors are not fixed. The model computes a member's current preference state from their recent viewing. Someone who just finished a crime thriller is in a different state than the same person after a kids' movie. Computing the state from history, instead of storing a separate free parameter for each person, is also what lets the model scale to millions of members.
The piece that matters for measurement is an explicit recommendation "bonus." When a title is recommended, its probability of being chosen gets an extra boost. The authors call this a reduced-form stand-in for two mechanisms: awareness (you learn the title exists) and information (being recommended signals that it's a good fit). Because taste, title appeal and the recommendation effect are separate parts of the model, it can answer 6 questions, "what if" scenarios that never happened. What if this title weren't recommended? What if a different recommender were running?
The key assumption, and the check
The model works only if one assumption holds. Once you account for everything the recommender knew about the member, the title and the moment, the remaining variation in what got recommended must be as good as random. Sources of that variation include algorithmic exploration, where the system sometimes shows less-certain picks in order to learn. Netflix argues the assumption is plausible because it can see every input the recommender used. Still, it is an assumption.
To test it, the team ran randomized experiments that slightly nudged recommendations toward or away from certain categories of titles. These nudges were 7, meaning they came from outside the system's own logic. From the experiments they measured 8: when some titles become less visible, what fraction of their lost viewing moves to each other title, and what fraction leaves Netflix altogether? They fit the model on the control group only, simulated the same nudges, and compared the results. Predicted and measured diversion ratios had a correlation of 0.86 and an of 0.73, so the model accounts for about three-quarters of the variation in the experimental results.
Counterfactual results
With the model validated, they replaced the recommended titles while keeping the catalog, the members and the choice model fixed. Compared with today's system, engagement fell 16% under random recommendations, 12% under popularity-based ones, and 4% under matrix factorization, a classic technique that factors the member-by-title viewing matrix into taste vectors. The 4% gap suggests personalization is still improving in ways that matter.
They also measured diversity, meaning how widely viewing spreads across titles. Popularity lists and matrix factorization both concentrated viewing on fewer titles. Random recommendations spread viewing slightly more widely than today's system, but at a large cost in engagement. The article doesn't say exactly how engagement or concentration were measured.
Why a recommended title gets watched
For each title, the authors compare two probabilities: that a targeted member watches it when recommended, and that an average member watches it when not recommended. They split that gap into three channels:
Exposure: the effect of being shown at all.
Selection: recommended members were already more likely to watch.
Targeting: the system finds members for whom the recommendation actually changes the decision.
An illustrative example, with numbers made up to match the reported ratios: an average member watches a title with 0.5% probability when it isn't recommended and 1.5% when it is, so exposure triples it. A targeted member who is recommended the title watches with 14.5% probability. Of the 14-point gap, exposure accounts for 1 point (about 7%), targeting about 7 points, and selection the remaining 6.
The real findings have that shape. Exposure roughly triples an average member's watch probability, yet it explains only about 7% of the gap. Selection and targeting explain most of it, and the targeting effect is nearly seven times the exposure effect. Under random recommendations, exposure dominates. Under matrix factorization, the three channels contribute roughly equally. Targeting is strongest for mid-popularity titles. Hits need little help, and niche titles have too few potential viewers to target effectively.
What remains open
The results depend on the as-if-random assumption and on the simple bonus term. The validation covered only a handful of nudged titles and small changes, while the counterfactuals involve swapping out the entire recommender, which is a much bigger change than anything tested. The simulations hold member behavior fixed, so long-run effects such as changing habits, subscriber churn, or new content decisions are outside their scope. And these are a company's estimates of the value of its own system.
Remember
Counting the share of viewing that comes from recommended titles overstates impact, because recommendations go to people already likely to watch.
Netflix fit a model to ordinary production data and checked it with small A/B nudges instead of switching personalization off.
Simply showing a title explains only about 7% of its lift. Matching titles to the right people does most of the work, mainly for mid-popularity titles.
2, Meta's system for deciding which datacenter serves which users, which balanced load across sites.
3, Meta's open-source 4 load balancer. Layer 4 is the transport level, so Katran spreads raw network connections across servers without reading their content.
5, Meta's HTTP server and proxy framework, used at 6, the application level, where routing can depend on the request itself.
A global load-balancing system that sent each user to the best-placed edge location, a point of presence near the user.
AutoScaling, which added capacity as demand rose.
Country-level 8. For high-risk matches, Meta switched off non-critical background work in the highest-traffic countries (Brazil, Argentina, India, Indonesia and Spain) to protect core features. The post does not say which work counted as non-critical.
Cascade prevention. Controls stopped spikes at the serving layer from spreading into downstream data systems. The post does not describe how.
Early-warning signals. Alerts fired as systems approached capacity limits, not after they crossed them.
5
Simple, modular code. Agents copy the patterns they read, so fixing a bad pattern once improves every later session.
A sandbox build. Prototype code lives in a separate version of the app and is physically left out of the production build, so it cannot crash the real app.
Standing rules. If the agent repeats a mistake more than twice, the correction becomes a permanent rule. Hooks, or automatic triggers, run checks such as a 6 (a code style and error checker) after every agent turn.
Skills are team conventions packaged as steps the agent can load and follow.
Agents automate checks that used to need a manual pass.
Commands chain skills and agents into workflows: assess complexity, reproduce a bug, plan and implement a fix, open the pull request, run a multi-stage review.
Hooks are automatic triggers. Examples include running a 4 (a style and error checker) after every agent turn, confirming the 5 is connected before installing, and validating tests before a pull request is created.