Hard benchmarks, harder permits, mapped forests · Morning Gist
Monday, November 23 stories · 10 min
Hard benchmarks, harder permits, mapped forests
A tougher test humbles frontier models, state politics threatens 2028 compute, and DeepMind shows satellite embeddings can tell a plantation from a natural forest.
Picked from 120 new articles across 24 sources · arrow keys for other days
Today in 30 seconds
30s left
SemiAnalysis's GDPx benchmark gives agents up to eight hours of realistic work; the best frontier model scores 12%, with finance and legal near zero. story 1 ↓
Model choice now depends on domain, safety filters and cost, GDPx suggests, rather than on one overall ranking. story 1 ↓
US midterms could put up to 30 GW of 2028 datacenter capacity at risk, SemiAnalysis says, though 2027 capacity looks largely safe. story 2 ↓
Nine of 20 governor nominees in key states want a construction pause, split about evenly by party, making state permits a possible compute bottleneck. story 2 ↓
DeepMind's free ForTy map sorts land into six forest classes at 10-meter resolution, scoring 90% against expert checks, with an early 2017–2025 yearly record. story 3 ↓
1/3SemiAnalysis· Max Kan· Nov 2
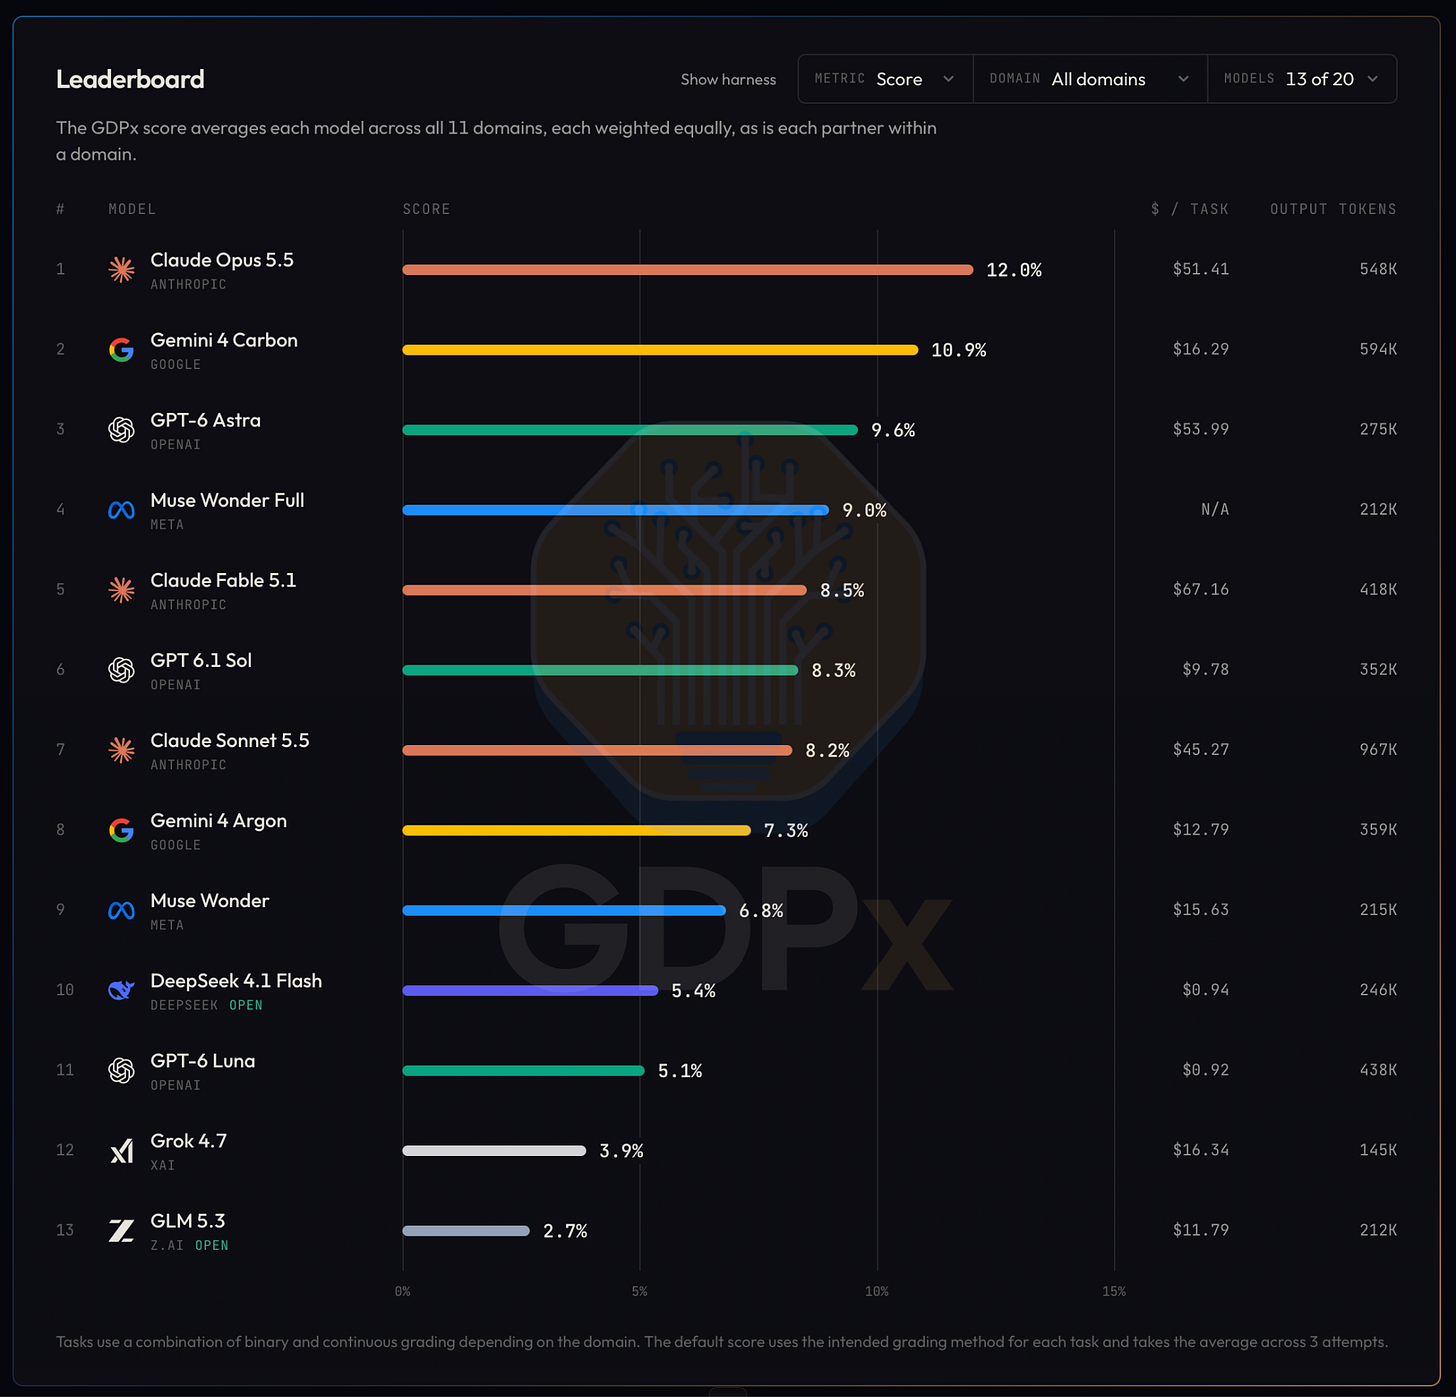
SemiAnalysis's GDPx benchmark tops out at 12% for the best frontier model
SemiAnalysis built GDPx, a benchmark of long agent tasks in 11 high-value fields, using realistic work environments from specialist startups. The top score is 12%, and different models lead in different fields.
Why it matters · It offers a harder alternative to GDPval and shows that choosing a model now depends on the domain, its safety filters and cost, not one overall ranking.
Know this first
Context from the editor, not the article · 29 sec
1 · GDPval
OpenAI's September 2025 benchmark tests models on knowledge-work tasks from many occupations, graded against expert-written rubrics. New model release cards still widely report it or its derivatives, which makes it the benchmark GDPx sets out to replace.
2 · RL environments
These are simulated workspaces with files, tools and sometimes running services, where an agent acts over many steps and a grader scores the outcome. Startups sell them to AI labs for reinforcement-learning training and for evaluation.
3 · Benchmark saturation
A benchmark stops being useful once top models cluster near its maximum score, because it can no longer separate them. Keeping one difficult is tricky: some apparent difficulty comes from flawed grading rather than from genuinely hard work.
2/3SemiAnalysis· Maya Barkin· Nov 1
US midterms put up to 30 GW of 2028 datacenter capacity at risk
SemiAnalysis models Nov. 3's state elections against US datacenter plans. 2027 is mostly under construction, but up to 30 GW planned for 2028 sits in states where a pause candidate could win. Texas matters most.
Why it matters · Compute supply in 2028 may depend less on chips or capital than on whether a state agency keeps issuing permits at the moment a campus needs one.
Know this first
Context from the editor, not the article · 30 sec
1 · Datacenters measured in gigawatts
The industry sizes AI datacenters by power capacity, because electricity limits how many chips a campus can run. A gigawatt is roughly a large power plant's output, so tens of gigawatts in a year is a huge buildout.
2 · Why permits gate construction
A campus needs a chain of approvals over time: land use, air and water permits, and a grid connection or its own generators. A permit already issued protects its work, but later phases can still need new ones.
3 · The backlash so far
Local governments have increasingly restricted datacenters over power bills, water, noise and secretive land deals. A moratorium is a temporary halt on approvals. Some states have now begun freezing permits themselves, extending the fight beyond county and town boards.
3/3Google DeepMind· Oct 22
DeepMind maps the world's forest types at 10-meter resolution
Google DeepMind, Google Research and two partners released a free 10-meter global map separating primary forest, plantations and tree-crop farms, reporting 90% accuracy, plus an early 2017–2025 series showing what replaced lost forest.
Why it matters · It shows a classifier built on reusable satellite embeddings inferring land use, which appearance alone can't reveal, with outputs that may feed real compliance decisions under EU law.
Know this first
Context from the editor, not the article · 29 sec
1 · Tree cover versus forest type
Satellite tree-cover maps measure whether a pixel has trees. They do not capture a forest's history, so a decades-old natural forest and a young plantation can get the same label despite very different ecological value.
2 · The EU's 2020 cut-off
The EU's deforestation regulation requires products such as coffee, cocoa and palm oil to come from land not converted from forest after 2020. That makes an accurate 2020 global baseline useful to companies and regulators.
3 · What geospatial embeddings are
An embedding compresses raw data into a short list of numbers that preserves useful patterns. In satellite work, one vector per pixel can summarize a long image history, so later models can train on it without processing the raw imagery.
Simulated workspaces with files, tools and services where an agent takes actions and is scored; used for training and evaluation.
Overall GDPx leaderboard, where even the top-ranked model scores just 12%.1 / 4
SemiAnalysis, a semiconductor and AI research firm, has released GDPx, a benchmark of long-running agent work in 11 fields, including chip design, cybersecurity, finance and recursive self-improvement (an agent building its own successor). The best model scores 12%.
Why another benchmark
General model comparisons still lean on 1, OpenAI's September 2025 knowledge-work test. SemiAnalysis argues it predates real agents: tasks hand the model nearly everything it needs and ask for one document. One finance task turns about 500 words of description and a one-page PDF into a report of up to 15 pages. Human experts agreed on grades only 71% of the time on its gold subset.
Harder tasks must also be fair. If a bug has two valid fixes and the grader accepts only one, the task measures guessing, not skill. SemiAnalysis says that once such flaws are fixed, benchmarks often saturate, with top models near the maximum score.
How it works
SemiAnalysis contacted more than 30 startups selling reinforcement-learning (RL) environments, simulated workspaces where agents act and get scored, and kept 14. Each had to pass an automated quality check on the first try, because repeated attempts can teach a vendor to game the checker. The authors say the same check flags nearly 50% of tasks in 2, a popular agent benchmark.
The finance tasks show the difference from GDPval. They sit inside an anonymized real deal, an $880M purchase of a snack company, with about 4,000 files the agent must search through. Tasks usually allow 8 hours. Models run in their own 3, the agent software around the model, such as Claude Code. The headline metric is 4 across three attempts, conventionally the estimated chance that one attempt succeeds.
Results
No model wins everywhere:
Opus 5.5: best all-around, leading quant trading, hardware and chip design.
GPT-6 Astra: recursive self-improvement and materials science.
Finance and legal: nearly everyone scores exactly 0.
5, filters that block risky requests, matter here. They pull down Opus and Astra in cyber, biology and alignment, and SemiAnalysis credits Carbon's biology win partly to weaker ones.
The failures are specific. On one finance task, no model solved any of 25 selected attempts, and the best average was 5.6 of 11 checks. On another task, models analyzing a broken training run mostly missed a bug that told them to stop investigating at 32K tokens.
Caveats
The domain list reflects SemiAnalysis's own view of where AI revenue will land. Partners sell data to labs and largely wrote their own task descriptions, and many task-level results rest on small samples.
SemiAnalysis, a semiconductor and AI research firm, has published GDPx, a benchmark of long-running agent work across 11 domains: chip design, hardware design, cybersecurity, biology, finance, legal, quant trading, materials science, software engineering, alignment, and recursive self-improvement (RSI), which it defines as an agent's ability to autonomously build the next version of itself. The top overall score is 12%.
The low ceiling is deliberate. SemiAnalysis wants a test current models cannot saturate, focused on the fields where it expects frontier models to matter most. It argues the first trillion dollars of AI revenue will concentrate in a few high-return sectors, so it skips government, real estate and insurance rather than sampling the economy by share of GDP.
The case against 1
The main general benchmark on release cards is still GDPval, OpenAI's September 2025 knowledge-work test. SemiAnalysis calls it impressive for its time but argues it predates real agents. Nearly every task has one shape: a prompt, a reference file, a few tools (web search, a code interpreter, file-editing libraries) and one attempt at a document.
In one representative finance task, the model receives about 500 words of high-level description and a plain one-page PDF, then writes a recommendation of up to 15 pages between two investments. A real analyst would first dig through PDFs, spreadsheets and emails. SemiAnalysis considers this missing context-gathering GDPval's biggest flaw.
It also faults the grading. Human experts agreed only 71% of the time on GDPval's gold subset, and the automated grader did worse. The authors also report broken rubrics, wrong reference solutions, and tasks decayed by dead links and stale prices.
Why hard tasks are hard to make
Difficulty has to be legitimate. Suppose a bug has two valid fixes, one using module A and one using module B. A grader that accepts only A gives zero to a correct B solution. The task looks hard, but it is really testing a guess. SemiAnalysis says that once such flaws are corrected, a benchmark often saturates.
Building a fair task that the best models solve less than 20% of the time takes real domain expertise, which is why, the authors say, labs pay $5,000 or more for a single good task. No single company has that expertise across 11 fields.
How GDPx was built
SemiAnalysis contacted more than 30 startups that sell reinforcement-learning (RL) environments and ended up with 14 partners. Every candidate went through the same automated quality check for consistency, completeness, cheating and unfair verifiers, based on two authors' experience co-founding such a startup. The authors say this check flags nearly 50% of the tasks in 2, a popular agent benchmark, as broken. They also reviewed hundreds of agent trajectories by hand.
The strict rule is that partners had to pass on the first try, with minor mistakes at most. A task that passes only after three or four rounds of feedback may simply have learned to fool the checker. Some prominent vendors were dropped as a result.
The environments are the main difference from GDPval. All 24 finance tasks sit inside a reconstruction of a real deal, anonymized: a private equity fund buys about 62% of a snack company for $880M plus an earnout. The world holds about 4,000 files, and each task reveals only what that party would have known on that date. Elsewhere, cyber tasks use unpublished security flaws, or 3, inside live multi-service systems, and hardware tasks run in real engineering software such as SOLIDWORKS and Siemens NX.
Tasks default to an 8-hour limit. Models run in their native 4, the agent software wrapping the model, such as Claude Code or Codex, with OpenCode as the fallback. The headline metric is 5 across three attempts, which conventionally means the estimated chance that one attempt succeeds. Domains are weighted equally, as are partners within a domain.
Results
6, filters that block requests in risky areas, distort the ranking. They pull down models such as Opus 5.5 and GPT-6 Astra in cyber, biology and alignment. With those domains removed, OpenAI and Anthropic lead, Gemini 4 Carbon (not yet generally available) is the only other model close, and SpaceXAI, Meta and open-weight models trail. SemiAnalysis says this matches its subjective impressions.
Leadership varies by domain:
Opus 5.5: best all-around, winning quant trading, hardware design and chip design.
GPT-6 Astra: RSI and materials science.
Gemini 4 Carbon: biology, likely helped by weaker classifiers, and narrowly software engineering.
Muse Wonder Full: cyber, by a meaningful margin.
Finance and legal: nearly every model scores exactly 0.
On cost versus performance, GPT-5.6 Luna and DeepSeek contest the cheap end, OpenAI holds the middle and Opus holds the top.
Where the models fail
RSI debugging. Agents get about 1,000 7 (recorded agent runs) totaling 21.2 million tokens from 8, a reinforcement-learning training method. A harness bug told models at 32K tokens to stop exploring and finish, which cut mean reward threefold compared with clean rollouts. Across 20 attempts by four models, all struggled. One Astra run read a trace saying "the harness told me to stop exploring" and still missed the root cause.
Finance. In a 9 task, a review of how sound a company's reported profit is, no model solved any of 25 selected attempts. GPT 6.1 Sol averaged 5.6 of 11 checks; Opus 5.5 and Astra averaged 5.4; GLM 5.3 and Grok 4.7 averaged under 2. Fifteen runs wrongly counted a banker's success fee as net debt, and models often trusted the most explicit figure over the authoritative document.
Hardware. On a compressor-housing design task, none of 12 runs fully passed. Still, five of six Opus and Astra submissions survived clearance checks and edit perturbations, while one GLM run displaced its housing by more than 11 mm.
Chip timing. In a timing repair on an Ibex RISC-V processor core, limited to changing 104 of 20,702 cells, Astra averaged 0.34 and Opus 0.135. So the overall chip-design winner can still lose individual tasks.
What to discount
SemiAnalysis's domain choice reflects its own revenue thesis, tied to a demand model it sells to subscribers. Partners sell data to labs, largely wrote their own task descriptions, and were admitted partly on reputation, since SemiAnalysis lacks in-house expertise in every field. The authors also call chip design slightly overrepresented while stating that domains are weighted equally, and they don't reconcile the two. Per-task results often rest on small samples. The text we received also breaks off in the biology section, so we have no task-level detail on legal, quant trading, materials science, alignment or software engineering.
Remember
Fair grading can erase apparent difficulty: SemiAnalysis's check flags nearly half of Terminal Bench 4.0 tasks as broken.
Safety classifiers can decide which model works best: blocked requests lower scores regardless of underlying capability.
Models often have the evidence but miss the cause, or check their arithmetic instead of their assumptions.
SemiAnalysis model data on the states with the largest 2028 additions, which total 43.5 GW.1 / 4
1, a chip and datacenter research firm, argues that the Nov. 3 US state elections will not stop the 2027 datacenter boom but could disrupt 2028. Roughly three-quarters of the 33.8 GW (gigawatts of power capacity) due in 2027 across its top 20 states is already under construction.
The firm's model has 62.2 GW of US 2 in 2028, meaning new capacity after retirements, and most of it hasn't started. The 13 largest markets holding state elections account for 43.5 GW of that, and 10 of them elect a governor.
Why the risk grew
In September, SemiAnalysis estimated that only 1.5 GW of about 20 GW under local restrictions actually faced delay. Most projects already had protections or didn't need the affected approval until the pause ended. Since then, the restrictions have spread:
Texas froze permits from its environmental regulator, 3, on Sept. 21. That brought 4 into a hold that began with an Aug. 3 audit of projects waiting for grid connections.
Oregon extended an earlier state-land freeze to air and water-discharge permits through July 1, 2027.
Candidates have hardened: nine of the 20 nominees want a pause and 11 want conditions, split about evenly by party.
Pause versus conditions
The distinction matters more than party. A developer can pay for a grid upgrade or redesign cooling and keep building, but it cannot proceed without an approval the state has stopped issuing.
If pause candidates won every race where one is running, about 30 GW of 2028 capacity would sit in those states. If the less restrictive candidates won, that falls to 5.7 GW, mainly because Ohio and Oregon have pause advocates on both sides. These figures measure exposure, not forecast delay, and ratings as of Oct. 30 favor conditions-only candidates in Texas, Oklahoma, Pennsylvania and Iowa. Georgia is a toss-up.
Texas is the swing factor
Texas alone adds close to 30% of 2028 US capacity, and SemiAnalysis calls a prolonged TCEQ freeze the biggest risk to its forecast. Incumbent Greg Abbott could reopen permitting after the grid operator's audit, whose report is targeted for Dec. 10, and a separate water review. Challenger Gina Hinojosa wants a 5 until new legislation passes. That could stretch the freeze to about eight months, or nearly a year if rules take effect in late summer: five to nine months beyond a December restart.
What remains unknown
6, the giant cloud companies, can absorb higher costs, but insiders note that money doesn't make permits or power arrive sooner. The free portion of the article ends before its state-by-state analysis, and it gives no estimate of how many gigawatts would actually slip.
1, a research firm that sells a datacenter industry model, has mapped its US construction forecast onto the Nov. 3 state elections. Its conclusion splits by year. The 2027 buildout is largely beyond the election's reach, because roughly three-quarters of the 33.8 GW (gigawatts of power capacity) due across its top 20 states is already under construction. The firm remains comfortable with its forecast of a global year above 50 GW. The contest, it argues, is over 2028.
Why 2028 is exposed
The model has 62.2 GW of US 2 in 2028, meaning new capacity after retirements, and most of it hasn't started construction. Those projects still have approvals, power projects and construction schedules to work through while the rules change.
The piece tracks the 13 states with the largest 2028 additions, leaving out Virginia and Mississippi because they hold no state elections this November. The 13 total 43.5 GW, or 70% of the national figure, and 10 of them elect a governor.
This is an update to a more relaxed view. In September, SemiAnalysis estimated that of roughly 20 GW inside local 3, temporary halts on approvals, only 1.5 GW faced delay. Most exposed capacity either had protections already or didn't need the affected approval until the pause expired. The firm says that conclusion has held, but the restrictions now reach further, for three reasons:
Texas, the largest US market, froze permits from the Texas Commission on Environmental Quality (4) on Sept. 21. That came on top of an , a review of projects waiting to connect to the grid, begun Aug. 3. The freeze brings , generation built at the campus, into the hold.
Pause versus conditions
The useful dividing line is not party. SemiAnalysis's point is mechanical: a project cannot do work that still requires an approval the state has stopped issuing. A condition, by contrast, changes the price. A developer can fund a grid upgrade, change the cooling design or negotiate a community agreement, then continue.
The firm treats several conditions as already on their way. Water studies are manageable for many projects, depending on cooling design and local supply. Paying for infrastructure is expected regardless, and developers are now offering credits toward household electricity bills. Amazon Web Services and Google have started moving toward more environmental transparency and away from non-disclosure agreements (NDAs). The most common campaign positions are making datacenters pay their own grid costs (15 candidates), ending tax breaks (12) and limiting or reporting water use (11).
The exposure numbers follow from that split. If the pause candidate won in every state where one is running, those states would contain roughly 30 GW of capacity planned for 2028. If the less restrictive candidates won, exposure falls to 5.7 GW, mainly because Ohio and Oregon have pause advocates on both sides. As of Oct. 30, race ratings and polling from Cook Political Report, Multistate and The New York Times favored the conditions-only candidate in Texas, Oklahoma, Pennsylvania and Iowa, with Georgia a toss-up.
These figures measure exposure, not delay. Actual slippage depends on which permits each project still needs and how long a pause lasts. As an illustration of the gap (our arithmetic, not the article's), September's estimate implies about 7.5% of restricted capacity faced delay. That ratio wouldn't necessarily transfer, because a statewide permit freeze reaches differently than a county ordinance.
Texas as the worked example
Texas adds close to 30% of 2028 US capacity, which is about 18 GW by our arithmetic. SemiAnalysis calls a prolonged TCEQ freeze the biggest current risk to its forecast, since a few months lost there can move the national number.
The two candidates imply different timelines:
Gov. Greg Abbott (R) could reopen permitting once the Electric Reliability Council of Texas (7), the state's grid operator, finishes its audit and the Texas Water Development Board completes a water-use review. ERCOT is targeting Dec. 10 for its report. A restart around then would be a short interruption that some projects can absorb. The report doesn't itself reopen permitting, though, and each permit still needs approval.
Gina Hinojosa (D) would impose a moratorium until legislation gives communities a voice, protects household bills and ends datacenter tax incentives. The regular session runs Jan. 12 to May 31, 2027. Holding approvals through it makes the freeze about eight months from September, or close to a year if approvals wait for new rules to take effect in late summer.
That adds five to nine months compared with a December restart. A deal or special session could shorten it, but a campus racing for 2027 delivery may not have the slack. Note the wrinkle in the ratings: the favored candidate in Texas is the incumbent who imposed the current freeze, so a favorable result doesn't remove the risk.
Who controls what
The firm ranks state actors as the most influential, because they control land use, permitting and power access. Michigan shows the limit of federal campaigning: both Senate candidates call for moratoriums, but neither could enact one from the Senate.
Governors act fastest. They can halt unissued permits, change review priorities and direct agencies to impose conditions. In Texas, Ohio and Pennsylvania they also appoint utility commissioners, subject to Senate review.
Legislatures write the moratoria that outlast executive orders and control the equipment 8. That exemption removes sales tax on servers, GPUs, cooling and backup generators, and is potentially worth billions of dollars per gigawatt.
The firm sorts states into three tiers by unstarted 2028 capacity and how directly the election could change policy. Tier 1 (over 2 GW) is Texas, Ohio, Arizona and Georgia. Tier 2 (1.5–2 GW) is Pennsylvania and Oklahoma, where tightening depends on a shift in political control. Tier 3 (under 1.5 GW) is Illinois, Oregon and Iowa. Indiana, Missouri, Wyoming and West Virginia are left out because their politics remain aligned with development.
Money doesn't buy time
SemiAnalysis interviewed six current and former hyperscaler employees, from companies including Amazon, Microsoft and Google. Several said these giant cloud operators can absorb higher costs and more easily bring or pay for their own power. The firm's caution is that this doesn't guarantee on-time delivery. Projects still need permits and equipment, funded transmission isn't immediately available, and moving to another state means finding power, permits and a schedule that meet the same date.
Politically, the backlash is broader than bills. Local candidates all raised NDAs that hide developers during negotiations. Oregon state Rep. Pam Marsh (D) tied voter anxiety partly to AI job loss, while opposing a three-year moratorium she sees as effectively a ban.
What's left open
The available text ends before the state-by-state detail. It gives no estimate of gigawatts likely to slip, and candidates' positions are taken at face value, though promises may not become policy. Local approvals are a separate risk it doesn't model here. The core forecasts come from a proprietary model that readers can't check.
Remember
Moratorium exposure is not delay: in September, only 1.5 GW of about 20 GW under local restrictions faced delay.
Both parties now converge on conditions: 15 candidates want datacenters paying grid costs, and 12 want tax breaks ended.
Governors can freeze permits fastest, but lasting moratoria and tax changes generally need legislatures, which take longer to act.
Google DeepMind and Google Research, with the World Resources Institute (WRI, an environmental research group) and the International Institute for Applied Systems Analysis (IIASA, a scientific research institute), have released 1. This free global map assigns every 10-by-10-meter patch of land to one of six classes. An early yearly time series covering 2017 to 2025 comes with it.
Why tree cover falls short
Most global maps only show whether trees are present. From space, an old-growth rainforest, a eucalyptus plantation and an oil palm estate can look like the same green patch, yet they hold very different amounts of carbon and biodiversity. A natural forest that is logged and replanted soon looks green again, so a tree-cover map may miss the change entirely.
Regulation makes this a practical problem. The EU's deforestation regulation (2) bars products such as coffee, cocoa and palm oil from land that was forest in 2020 and later became agriculture. Wood products also can't come from primary forest later converted to planted or plantation forest, or from naturally regrown forest later converted to plantation. Checking this requires knowing the forest type and what replaced it.
Teaching a model about land use
ForTy's classes follow definitions from the UN Food and Agriculture Organization: primary forest, naturally regenerating forest, planted forest, plantation forest, tree crops and 3 (farms growing oil palm, rubber, cocoa or fruit), and other land.
The hard part is that these classes depend partly on how land is used, which a single image can't show. The team assembled about 1.7 million labeled locations from expert surveys, national and regional datasets, and targeted reviews of places where the model struggled.
The model's key input is 45: compact numeric summaries of years of satellite observations for each 10-meter pixel. These let it pick up planting patterns, growth cycles and harvest rhythms. The post calls the architecture "custom" but gives no details.
Results
Two trained experts examined each of more than 9,000 randomly chosen sites using high-resolution imagery and years of satellite records. ForTy chose the right forest type 90% of the time and separated forest from non-forest 95% of the time. The authors say this beats other global forest maps, without naming them or giving their scores.
ForTy also outputs a probability for each class. A company managing regulatory risk can accept only high-certainty pixels, while a researcher estimating total forest extent can use the full range of probabilities.
Caveats
The post gives no per-class accuracy, which is what matters most for rarer or easily confused classes. It reports no separate accuracy for the time series, which remains an early release that the team plans to keep improving. At 90%, roughly one site in ten still gets the wrong type, so high-stakes uses will need extra checks.
Google DeepMind and Google Research, working with the World Resources Institute (WRI, an environmental research group) and the International Institute for Applied Systems Analysis (IIASA, a scientific research institute), have released 1. It is a global map that assigns every 10-by-10-meter patch of land to one of six forest and land-use classes. With it comes an early time series covering each year from 2017 to 2025. Both are freely available under an open license on 2, Google's cloud platform for geospatial analysis.
The authors claim one specific first: users can see worldwide, at 10-meter detail and year by year, what replaced lost forest, whether a timber plantation, a tree-crop farm or other land.
The problem with "is there a tree here?"
Most global maps only indicate whether trees are present. That misses much of what matters ecologically. A primary forest that has never been cleared holds far more carbon and biodiversity than a single-species timber plantation harvested every decade or two, yet the two can look like the same green patch from orbit.
It also creates a blind spot for change. When a natural forest is logged and replanted as a plantation, the land soon looks green again, and a standard tree-cover map might not register anything.
The EU's regulation on deforestation-free products (3) turns this into a compliance question with two relevant rules:
Products such as coffee, cocoa and palm oil must not come from land that was forest in 2020 and has since been converted to agriculture.
Wood products such as furniture must also be free of forest degradation. They can't come from primary forest later converted to planted or plantation forest, or from naturally regenerating forest later converted to plantation.
To apply those rules, a company or regulator needs the forest type at a plot, plus what came after it. The same group's earlier map, Natural Forests of the World 2020, released last year, answered only a binary question for each patch: was it natural forest in 2020? ForTy extends that to a multi-class label, with the time series adding yearly change.
Six classes, based on UN definitions
The categories follow definitions from the UN Food and Agriculture Organization (FAO):
Primary forest: native forest with no visible signs of human disturbance.
Naturally regenerating forest: forest that grew back on its own, for example after logging or fire.
As an illustration of how this maps to the rules, consider a hypothetical pixel labeled naturally regenerating forest in 2020 and plantation forest in 2023. That sequence is the kind of conversion barred for wood products. A pixel going from primary forest in 2020 to tree crops in 2024 would be the pattern relevant to a commodity like cocoa. A tree-cover map could show trees present at the start and end of both sequences.
Why classification is hard, and how they approached it
The labels describe use and history as well as appearance, so one cloud-free image doesn't contain enough information. The difference between planted and plantation forest, for instance, rests partly on how intensively the land is managed.
The team tackled this from two directions.
Labels. They built a collection of about 1.7 million labeled locations from expert surveys, national and regional datasets, and targeted reviews of places where the model struggled. That last source resembles 5, the practice of directing labeling effort at a model's weak spots.
Input representation. The model uses a custom architecture designed for remote sensing data, which the post doesn't describe. A key input is 67, which the authors describe as data-compact summaries of years of satellite observations for each 10-meter pixel. Because they encode time, the model can look for planting patterns, growth cycles and harvest rhythms. That is the signal a single image lacks: a rough analogy is judging what a building is used for by watching its traffic over months, rather than from one photo of its roof.
The results
With IIASA and WRI, the team validated ForTy against more than 9,000 randomly chosen sites worldwide. At each one, two trained experts studied high-resolution imagery and years of satellite records to determine the true land type.
Forest type: correct 90% of the time.
Forest versus non-forest: correct 95% of the time.
The authors say this outperforms other global forest maps. The post names no competitors and gives no comparison figures; it points to a paper in Scientific Data for the 2020 map.
Probabilities instead of hard labels
ForTy gives each pixel a probability for every class, so users can set their own trade-off between precision and coverage. The authors offer two cases: a company assessing EUDR risk might accept only pixels the model is highly certain about, while a researcher estimating total forest extent might use the full spectrum of probabilities.
Here is an illustrative example, with invented numbers. Suppose a pixel scores plantation 0.55, planted 0.25, naturally regenerating 0.15 and other classes 0.05 combined. Taking the top class gives "plantation." A compliance user with a 0.9 threshold would treat the pixel as unresolved. A researcher summing probabilities across a region would count 0.95 of this pixel as forest or tree crop. That summing only works well if the probabilities are 8, meaning a 0.8 score is right about 80% of the time. The post doesn't say whether they are.
What remains open
Per-class performance. The post gives only overall accuracy figures. They could hide weaker results on rarer or easily confused classes, such as planted versus plantation forest. It also doesn't explain how disagreements between the two experts were handled.
Time-series quality. The post reports no separate accuracy for the 2017–2025 series, and calls it an early release to be improved over the coming months. Change detection is a harder test than a single-year map, because a classification error in any one year can look like a land-use change. The post doesn't describe how year-to-year consistency is handled.
Use in compliance. The authors call the 2020 map a key baseline for the EUDR, but the post doesn't say whether regulators accept it as evidence. A 90% site-level accuracy also means about one site in ten is mislabeled, which suggests confirming high-stakes calls by other means.
Remember
Classes defined by land use need temporal signals: planting patterns and harvest rhythms carry information a single image lacks.
Per-pixel class probabilities let each user set a threshold, moving the precision-coverage decision from mapmaker to application.
Treat the 90% headline cautiously: the post gives no per-class breakdown, named comparisons or separate accuracy for the time series.
Oregon widened an earlier state-land freeze on Oct. 9 to cover air and water-discharge permits through July 1, 2027.
Candidates have moved. Nine of the 20 nominees want a pause on new construction and 11 want conditions, with the split about even by party.
Utility commissions set deposits, minimum bills, upgrade costs and exit fees. Commissioners are elected in Georgia, Arizona and Oklahoma. Staggered terms mean a governor's win doesn't immediately flip a majority. Governors also have little power over 9, the largest US transmission organization.
Planted forest: forest planted or seeded by people and managed over long cycles.
Plantation forest: fast-growing, intensively managed tree farms, often of one species.
Tree crops and 4: farms growing things other than wood, such as oil palm, rubber, cocoa or fruit.
Other land: everything else, including grassland, cropland, cities and water.