Housing is buckling under mortgage rates near 7.5%, economists say supply shocks may be the new normal, and Europe's research gap with the US gets mapped.
Picked from 53 new articles across 16 sources · arrow keys for other days
Today in 30 seconds
30s left
Orszag and co-authors count six supply shocks in six years and blame long, fragile supply chains. That limits central banks' room to cut rates. story 1 ↓
Builder sentiment fell to 29, its lowest since June 2012, and September contract signings dropped 11.3% from a year earlier as mortgages neared 7.5%. story 2 ↓
Inflation expectations barely moved, so 10-year yields rose on higher expected rates, possibly from AI borrowing. That points to slower mortgage relief. story 3 ↓
A Harvard–European Commission study finds the US leads most complex research fields. Europe leads only in green tech and semiconductors. story 4 ↓
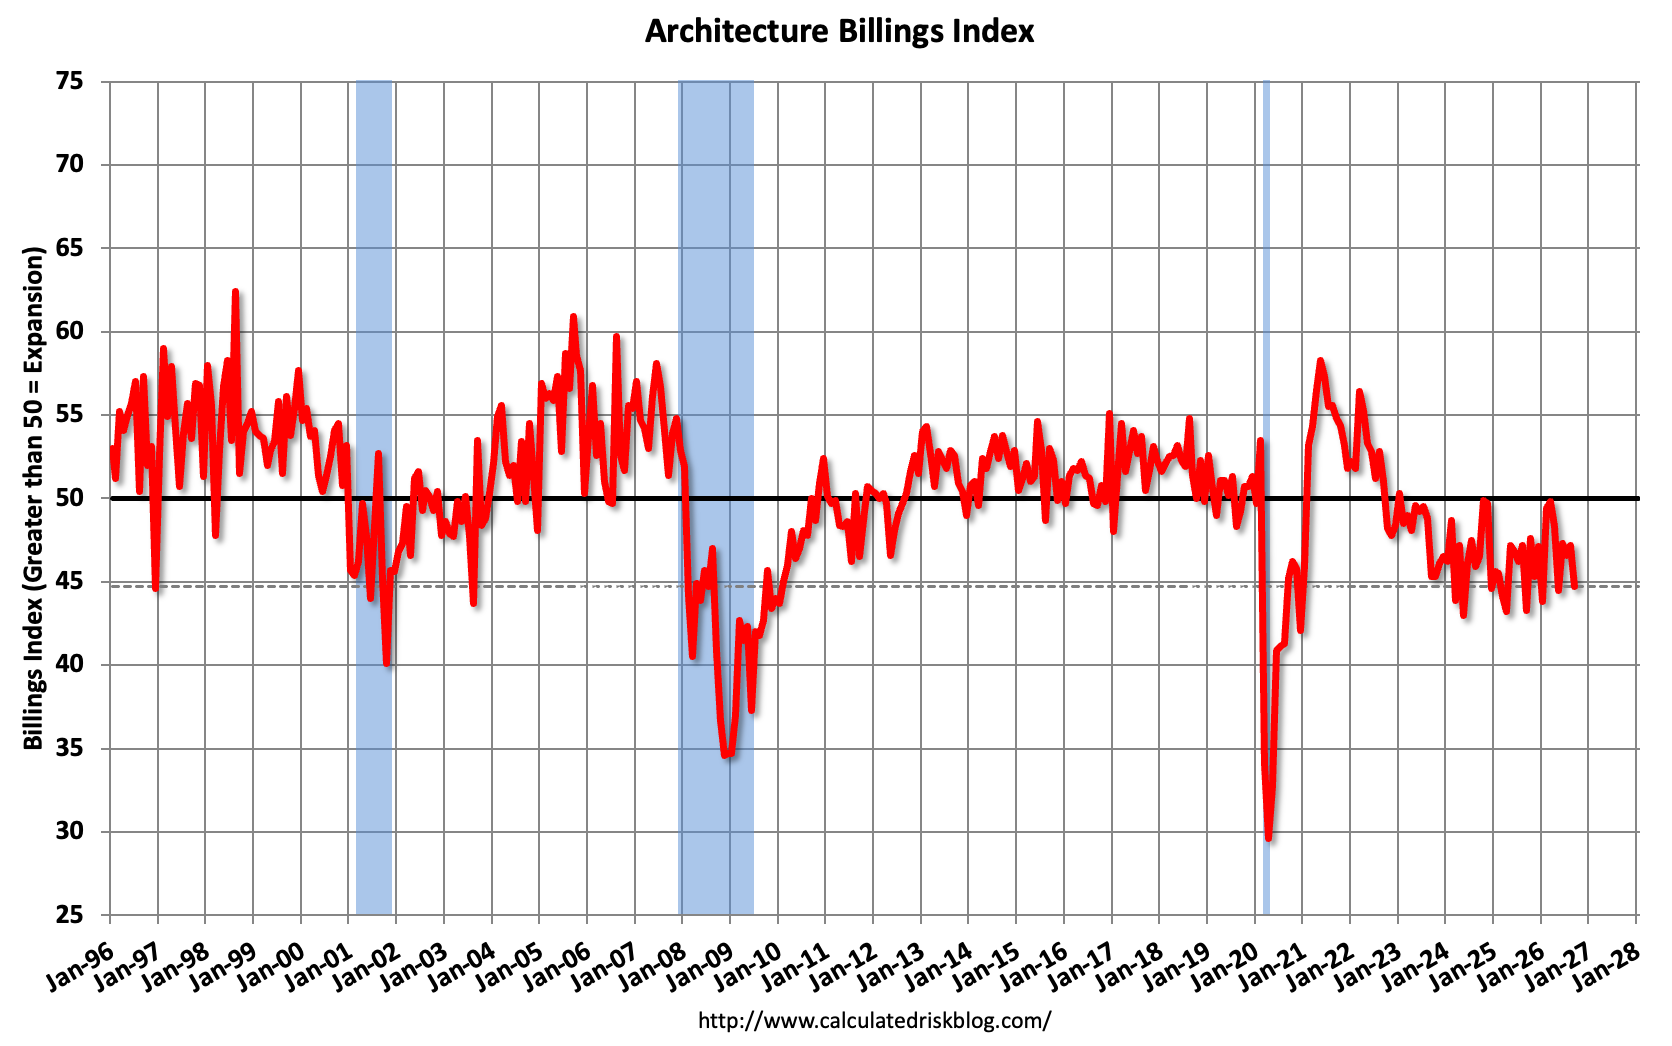
Architecture billings fell again in September. Multi-family billings have been negative in 48 of the last 50 months, a sign of weak future construction.
1/4Conversable Economist· conversableeconomist· Oct 21
Six supply shocks in six years may be the new normal
A new paper by Peter Orszag and colleagues counts six supply shocks hitting the world economy since 2020. It argues they now come often and stack up, so economists must plan around them.
Why it matters · If supply shocks are the norm, expect more inflation flare-ups during downturns and less freedom for central banks to cut rates when jobs weaken.
Know this first
Context from the editor, not the article · 26 sec
1 · Demand versus supply shocks
A demand shock means people and firms suddenly spend less. Output and prices both fall. A supply shock means the economy can produce less. Output falls but prices rise, so unemployment and inflation climb together.
2 · The standard recession playbook
In a downturn, governments usually spend more or cut taxes, and central banks lower interest rates. Both boost spending. That works well when the problem is weak demand, as in 2007-09.
3 · Why it matters for inflation
After the 2008 crisis, heavy stimulus brought little inflation. After the pandemic, stimulus met snarled supply, and US inflation hit roughly 9% in 2022. That contrast is the background to this argument.
2/4Calculated Risk· CalculatedRisk by Bill McBride· Oct 21
Mortgage rates near 7.5% push US housing demand and builder confidence lower
Weekly and monthly US housing data show mortgage applications, home-builder confidence and signed contracts all falling, while listings rise. Bill McBride argues rates near 7.5% will slow sales and put pressure on prices.
Why it matters · If you plan to buy, sell or refinance, these indicators show how quickly higher rates reach prices, and why buyers may get price cuts and builder incentives.
Know this first
Context from the editor, not the article · 28 sec
1 · Rates drive housing affordability
Most US homes are bought with 30-year fixed mortgages. When the rate goes up, so does the monthly payment on the same house. That cuts what buyers can afford faster than wage gains can make up for it.
2 · Leading versus lagging data
Mortgage applications and contract signings ('pending sales') show what buyers are doing now. Closed sales and price indexes catch up weeks or months later. Analysts watch the early series to see turns before they show up in prices.
3 · Why compare with 2019
Housing inventory dropped very low during the pandemic, so comparing only with last year can mislead. 2019 is the usual 'normal' year analysts use to judge how tight supply still is.
3/4Calculated Risk· CalculatedRisk by Bill McBride· Oct 21
Rising expected interest rates, not a riskier bond market, pushed 10-year yields up in 2026
Housing economist Tom Lawler checked three Federal Reserve models and found that 10-year Treasury yields rose this year mostly because markets now expect higher short-term rates, not because investors demand more for risk.
Why it matters · Mortgage rates follow 10-year yields. If higher expected real rates are holding yields up, rather than temporary nerves, cheaper mortgages may take longer to arrive.
Know this first
Context from the editor, not the article · 30 sec
1 · What mortgage bonds track
Most US mortgages are pooled into mortgage-backed securities (MBS). Mortgage rates follow MBS yields, which are the 10-year Treasury yield plus a spread. So a mortgage rate can rise because Treasury yields rise or because that spread widens.
2 · Two parts of a long yield
In standard finance theory, a 10-year yield equals the average short-term rate investors expect over ten years plus a term premium. The term premium is extra pay for the risk of tying money up for a long time. It can't be observed directly.
3 · Splitting out inflation
4/4Klement on Investing· Joachim Klement· Oct 22
Study maps where Europe's fragmented research system falls behind the US
Researchers from Harvard and the European Commission tracked who works with whom on patents and scientific papers. They found that Europe trails the US in the most complex fields, such as biotech and computing, and blame Europe's patchwork of national rules.
Why it matters · Leadership in complex fields like AI, biotech and computing increasingly decides where high-value companies, jobs and profits end up, so this gap feeds into long-run growth for Europe compared with the US.
Know this first
Context from the editor, not the article · 25 sec
1 · Europe's competitiveness worry
For years EU policymakers have worried that Europe lags the US in productivity and frontier technology. Mario Draghi's 2024 report on EU competitiveness named fragmented markets and regulation as a main cause.
2 · What 'complexity' means here
In economic-complexity research, which Harvard's Growth Lab helped develop, a field counts as complex if it is rare and needs many specialised capabilities combined. Few places manage it, so it tends to be valuable.
Economist Peter Orszag and three co-authors argue in a September 2026 paper that the world has entered a "new supply-side era." Timothy Taylor's Conversable Economist blog explains why that would matter.
Two kinds of downturn
Most recessions start with a 1: people and businesses suddenly spend less, as after the 2008 financial crisis. Unemployment rises and inflation falls. Governments know the response. 2 (more spending or tax cuts) and 3 (lower interest rates) make the slump shorter, with little risk of inflation.
A 4 is different. The economy can't produce as much, so unemployment and prices rise together. Stimulus still eases hardship, but it adds spending to an economy that can't produce more, which feeds inflation. Taylor notes that's why the Great Recession brought little inflation and the pandemic brought a lot.
Six in six years
The authors count six supply shocks since about 2020: the pandemic, artificial intelligence, Russia's invasion of Ukraine, tariffs, China's export controls on 5 (metals used in magnets and electronics), and war in the Middle East. Any single shock, especially in energy, may be smaller than in the past. What's new, they argue, is that the shocks come often and pile on top of each other.
The weakest link
They also lean on economist Michael Kremer's 6. It's named for the rubber seal that turned brittle in the cold and caused the 1986 Challenger shuttle disaster. The idea: a complex product is only as good as its weakest part. To illustrate with made-up numbers, a car with 999 of its 1,000 parts still can't be built without the last chip. Value multiplies across parts rather than adding up.
Long global supply chains spread that weakness around. One missing chip, mineral or chemical can halt production far downstream, as container ships idling offshore did in 2021. The authors say these shocks travel in waves: delivery delays, then input shortages, then squeezed margins, then higher consumer prices. They also fade slowly and unevenly.
Many weak points are physical places: ports, undersea cables, shipping chokepoints, China's grip on rare-earth refining, Taiwan's lead in advanced chips.
So what
Taylor concludes that six linked shocks in six years "starts to look less like 'bad luck' and more like 'the way things are going to be.'" The authors want economists to think like "geopolitical supply-siders."
The post's text breaks off before any policy advice. What's left is a diagnosis: the next recession may not respond to the familiar playbook without stoking inflation.
Timothy Taylor, who writes the Conversable Economist blog, takes up a September 2026 paper by Peter R. Orszag, Eric Van Nostrand, Noah Barbieri and Layla McDermott called "The New Supply-Side Era: The O-Ring Meets Geopolitics." Orszag also presented it at the London School of Economics. The authors make two claims. Supply shocks are no longer rare. And the way modern production is built makes each one hit harder than it otherwise would. If both are true, the usual way governments fight recessions gets riskier.
Why the type of shock matters
Taylor starts with the difference between two kinds of shock. A negative 1 shock (aggregate demand is total spending across the economy) means people and businesses suddenly spend less. The financial crisis behind the Great Recession of 2007-09 is the standard example. Output falls, unemployment rises, and inflation is held down on its own. Policymakers broadly know what to do. Expansionary fiscal policy (more government spending or lower taxes) and 2 (lower interest rates) can make the slump shallower and shorter, and there is little risk of setting off inflation.
Taylor is careful about what this playbook covers. It cushions short-term pain. Long-term growth is a different job, which depends on education and training, incentives to invest, research, and weighing the costs and benefits of regulation.
A negative 3 shock (aggregate supply is how much the economy can produce) is harder to handle. Unemployment rises while prices also rise. Stimulus can ease hardship, but it adds spending to an economy that can't produce more, which pushes inflation higher. Taylor points to the record: little inflation after the Great Recession, real inflation after the pandemic recession, which he treats as a 4.
Six shocks in six years
The authors list six supply-side shocks since about 2020: "the pandemic, artificial intelligence, Russia's invasion of Ukraine, tariff shocks, China's rare-earth export controls, and the war in the Middle East." Rare earths are a group of metals used in magnets, electronics and defense equipment. Calling AI a supply shock is the least obvious item. The excerpt doesn't explain the reasoning, though the label probably reflects how fast AI is reshaping production and demand for chips and power.
The authors say what is new is not how big any one shock is. Energy disruptions in particular may be smaller than past ones like the 1970s oil shocks. What is new is how often the shocks come and how they overlap. They "arrive more often and, increasingly, on top of one another." Taylor sums it up this way: the old view treated major supply shocks as rare, and today's world brings "a parade of supply shocks coming thick and fast."
The O-ring idea
The second claim draws on the 5 of development from economist Michael Kremer, who won the 2019 Nobel Prize. The name comes from the 1986 Challenger space shuttle disaster. The investigation blamed O-rings, rubber seals between joints that turned brittle in unusual cold, which was not well understood at the time. The point: a complex machine performs only as well as its weakest part, even if everything else works perfectly.
A worked illustration (the numbers are made up): suppose a car needs 1,000 parts. If 999 parts are on hand and one chip is missing, output isn't 99.9% of normal. It's zero. That is what the authors mean by a "multiplicative structure." Value works like a product of factors, not a sum, so one factor near zero drags the whole thing to near zero. In the authors' words, "One weak link can reduce or destroy the value of everything else."
Globalization made this worse. As products got more complex, firms built long supply chains across many countries. One bad input, "a chip, a mineral, a precursor chemical," can stop production far down the chain. In the pandemic, the weak links included container ships waiting offshore to unload.
How these shocks spread
The authors say supply shocks don't follow the textbook demand cycle. They build slowly and travel in waves: first delivery delays, then shortages of inputs, then squeezed profit margins, then higher prices for consumers. They also fade "with long and uneven lags." For anyone watching inflation data, that means a supply shock may only reach consumer prices months after it starts, and it can still be echoing when the next one hits.
Geography
Many of the weak points are physical places. Ports with limited capacity. Undersea data cables that can be cut. Shipping chokepoints. One country, China, handling most of the world's rare-earth refining. Another, Taiwan, making the most advanced computer chips. And sometimes just tanks and planes crossing a border. That's why the paper's title pairs the O-ring with geopolitics.
What follows, and what's missing
Taylor concludes that six interrelated, mutually reinforcing disruptions in six years "starts to look less like 'bad luck' and more like 'the way things are going to be.'" The authors want economists to become "geopolitical supply-siders," watching for supply shocks and tracing how they spread.
The available text stops there. The post cuts off mid-sentence, so any policy recommendations Taylor goes on to discuss aren't included. The argument also leaves open questions:
How do you measure that shocks are getting more frequent, rather than just more visible?
Does the O-ring argue for stockpiles, more suppliers, or moving production home? Each costs money.
How should central banks react when unemployment and inflation rise together?
Read as it stands, the piece is a diagnosis, not a prescription. It suggests that the low-inflation, demand-driven recessions of the 2000s may be a poor guide to the next downturn.
Remember
Stimulus is fairly safe against a demand slump but risks inflation when the problem is limited supply.
The authors say what's new is how often shocks come and overlap, not how big each one is.
Supply shocks reach consumer prices in stages, after delivery delays, input shortages and squeezed margins, and fade slowly.
MBA purchase applications index (weekly and four-week average) remains depressed, 18% below last year.1 / 4
Four fresh US housing reports, collected by Bill McBride of Calculated Risk, all point the same way. With 30-year mortgage rates near 7.5%, fewer people are buying, more homes are for sale, and builders are the gloomiest they've been since 2012. McBride expects existing-home sales to slow in the coming months and house prices to come "under pressure."
Demand is falling
The 1, the lenders' trade group, reports loan applications every week. For the week ending October 16:
Applications to buy a home fell 7% on the week and were 18% below a year earlier.
Applications to refinance an existing loan were 59% below a year earlier, near historic lows.
The 30-year fixed rate actually slipped to 7.41% that week, its first drop in more than two months, but applications kept falling. MBA's Joel Kan says higher rates are "pricing buyers out." About 10.5% of applicants chose 2, whose rates are running nearly a percentage point below fixed rates.
Supply is rising
3, which tracks homes listed for sale, says active single-family inventory is up 5.3% from a year ago. It is now only 3.2% below 2019, the last pre-pandemic year. Supply is getting back to normal just as buyers pull back.
Builders are cutting prices
The 4 surveys home builders monthly. A reading of 50 means as many call conditions good as poor. In October it fell to 29, the lowest since June 2012 and below the pandemic trough. Builders blame rates, material and energy costs, and labour and land shortages. In the survey:
43% of builders cut prices, the most since at least 2020. The average cut was 6%.
65% offered sales incentives such as paying to lower a buyer's rate.
Buyer traffic is at its lowest since 2012, excluding April 2020.
Contracts are down
The National Association of Realtors counts homes that go under contract. These are 5, which usually close one to two months later. In September they fell 7.3% from August and 11.3% from a year earlier, with declines in every region. The West fell most. NAR's Lawrence Yun notes that job and income gains matter less to affordability than mortgage rates do.
What it means
The reports cover different parts of the market: loans, listings, builders and contracts. Because they all agree, the signal is stronger than any single one. Pending sales point to weaker closed sales in the next reports.
The article doesn't say how far prices might fall, what drove rates up, or how big a rate drop it would take to bring buyers back. For buyers, builders are negotiating. Sellers face a cooling market.
Bill McBride of Calculated Risk has pulled together four new US housing reports. Two are weekly and two are monthly, and they all show the same thing. With the 30-year fixed mortgage rate around 7.4–7.5%, fewer people are buying, more homes are listed for sale, and home builders are gloomier than at any point in 14 years. McBride's conclusion is that existing-home sales will likely slow over the coming months and "house prices will be under pressure."
Why rates matter so much
A mortgage payment depends mostly on two things: the price of the house and the interest rate. When the rate rises, the same house costs more each month, so some buyers can no longer qualify and others decide to wait. Lawrence Yun, chief economist at the National Association of Realtors (NAR), the main trade group for US real-estate agents, puts it this way: job growth and income gains help, but "housing affordability is more affected by changes in mortgage rates."
Here is a rough illustration that is not from the article. On a $400,000 loan, moving from 6.5% to 7.5% adds about $270 to the monthly principal-and-interest payment. That is roughly a 10% jump with no change in the price.
Demand: mortgage applications
The 1, the lenders' trade group, surveys loan applications every week. In the week ending October 16, 2026:
The Market Composite Index, which tracks total application volume, fell 5.3% from the week before after 2 (a statistical correction for normal calendar patterns). Without the adjustment it fell 5%.
The Purchase Index, which counts applications to buy homes, fell 7% on the week and was 18% below the same week a year earlier.
The Refinance Index, which counts applications to replace an existing loan, fell 2% on the week and was 59% below a year earlier. McBride's chart going back to 1990 shows refinancing near historic lows.
That week the 30-year fixed rate actually dipped to 7.41%, the first decline in more than two months. Applications fell anyway. Joel Kan, MBA's deputy chief economist, said higher rates are "pricing buyers out of the market." He also noted that adjustable-rate mortgages (ARMs, whose rate resets after an initial fixed period) held at 10.5% of applications. ARM rates are running almost a full percentage point below the 30-year fixed rate, which gives qualified borrowers a cheaper option at the start.
Supply: listings are rising
3, a firm that tracks homes listed for sale, reports that active single-family inventory as of October 16 was:
up 5.3% from the same week in 2025 (the week before it was up 4.8%)
down 3.2% from the same week in 2019 (the week before it was down 5.1%)
The 2019 comparison matters because inventory fell to very low levels during the pandemic, and 2019 serves as a rough "normal." Supply is still slightly below that level but closing the gap quickly. In McBride's view, rising inventory combined with weak demand is what builds price pressure.
Builders: confidence below the pandemic low
The 4 (HMI) is a monthly survey of the National Association of Home Builders. It asks builders about current sales, expected sales and buyer traffic. A reading of 50 means as many builders call conditions good as call them poor. In October it fell three points to 29, the lowest since June 2012. That is below the trough at the start of the pandemic, which is where the original headline gets its claim. NAHB blames higher mortgage rates, energy and material costs, and worse conditions for labour and building lots.
The survey details show builders already giving ground:
Buyer traffic is at its lowest since April 2012, apart from the pandemic shock of April 2020.
43% of builders cut prices in October, the highest share in the 2020–2026 period.
The average cut was 6% for the seventh month in a row.
65% used sales incentives, such as 5 (where the builder pays to lower the buyer's mortgage rate) or paying closing costs. This is the 19th straight month above 60%.
NAHB chief economist Robert Dietz says demand "persists." Buyers want homes, but rates, construction costs and weaker consumer confidence are keeping them on the sidelines.
Contracts: pending home sales
NAR's Pending Home Sales report counts existing homes that went under contract but have not yet closed. Because closings usually follow one to two months later, it is an early signal for sales. In September, 6 fell 7.3% from August and 11.3% from a year earlier. All four US regions fell on both measures. The West had the largest monthly drop, followed by the South, Midwest and Northeast. Yun blamed "fast-rising mortgage rates."
What it adds up to and what's open
Each indicator measures a different part of the market: loan demand, listings, builder sales and contracts. All of them point the same way, which makes the overall signal stronger than any one report. Pending sales point to weaker closed sales in October and November reports, and more listings plus widespread builder price cuts point to softer prices.
The post leaves several questions open:
How much prices fall, and where. McBride says prices will be "under pressure," not that they will drop nationally. Inventory is still below 2019 levels, which may limit how far they fall.
What happens if rates ease. This week's small rate decline did nothing for applications. The data can't yet show how large a drop would be needed to bring buyers back.
Why rates rose. The post doesn't explain what pushed mortgage rates up recently. It treats the increase as given and looks only at the effects.
New versus existing homes. Builders can cut prices and buy down rates. Individual sellers usually don't, so the two markets may adjust at different speeds.
For buyers, the practical points are that builders are negotiating and inventory is improving. For anyone who needs to sell soon, conditions are turning against them.
Remember
A small rate dip to 7.41% didn't revive applications; buyers appear to need a much larger drop.
Listings are up 5.3% year-over-year and only 3.2% below 2019, so supply is close to normal.
43% of builders cut prices in October, the most since 2020, so buyers of new homes have leverage.
TIPS are Treasury bonds that adjust for inflation. The gap between a regular Treasury yield and a TIPS yield of the same maturity is the breakeven: roughly the average inflation the market expects.
Mortgage-bond yield and spread charts from the article; post context implies MBS data, not labeled.1 / 4
Long-term interest rates have climbed in 2026, and mortgages have followed. Housing economist Tom Lawler, writing on Bill McBride's Calculated Risk blog, looks at why. He concludes that markets now expect higher real (inflation-adjusted) short-term rates for years ahead. A jump in the risk premium on long bonds and fear of inflation play smaller parts.
Mortgage bonds
The 1 yield is the yield on newly priced mortgage-backed securities, the bonds made from pools of home loans. It hit a yearly high on October 5 and now sits at 6.27%, well above anything in the first eight months of the year. Its spread over Treasuries is near the year's high. Lawler says it isn't especially wide historically, excluding periods when the Fed was buying MBS. He ties the widening to higher 2, the size of rate swings that options prices suggest. Jumpy rates hurt MBS investors because homeowners refinance when rates fall.
Not mainly the 3
A 10-year yield can be split into two parts. One is the average short-term rate investors expect over ten years. The other is the term premium, extra pay for the risk of locking money up. Many analysts blame this year's rise on a bigger term premium. It can't be observed, so Lawler compares three Fed-published models: 4 (New York Fed), 5 (Fed Board) and CR (San Francisco Fed). CR runs consistently higher than the others, possibly because it models rate movements differently.
Lawler compares end-2025 with October 16, 2026:
In ACM and CR, almost all of the rise in 10-year yields comes from higher expected short-term rates.
In KW, slightly less than half comes from the term premium.
Not mainly inflation either
6 are inflation-protected Treasuries. The gap between their yields and regular Treasury yields, called the 7, shows expected inflation. Breakevens are only slightly above end-2025 levels. So expected rates rose and expected inflation barely did, which means expected real rates went up. Lawler reads this as markets raising their estimate of the 8, the rate that neither stimulates nor restrains the economy. He says they raised it by more than Fed officials did in their latest median projection.
Why?
Lawler calls it "perhaps not coincidental" that the shift began just as borrowing for the AI buildout started to surge. More demand for credit pushes up its real price. That is a timing observation, not a proven cause.
Caveats
The models disagree, and KW gives the term premium a real role. Breakevens also contain risk premiums. The article's tables aren't reproduced in the text, so the exact yield changes are missing. Still, the reading for borrowers is that mortgage rates are being held up by expected real rates, and a calmer bond market won't fix that.
Housing economist Tom Lawler has updated his look at mortgage-bond yields and the forces behind them. The update was published on Bill McBride's Calculated Risk blog. The short version: long-term interest rates have risen this year. Lawler's evidence says the cause is mostly markets expecting higher real short-term rates for years to come. A bigger risk premium, or fear of inflation, plays a smaller part.
Where mortgage bonds stand
Lawler starts with the 1 (CCMBS) yield. MBS are mortgage-backed securities, bonds built from pools of home loans. The "current coupon" is the yield on an MBS priced at roughly face value, and it is the usual stand-in for what new mortgages pay investors. The yield hit a new high for the year on October 5. It has since slipped to 6.27%, still well above anything seen in the first eight months of 2026.
The spread between this yield and Treasury yields is close to its high for the year. Lawler says it is still not especially wide by historical standards, once you leave out periods when the Federal Reserve was buying MBS and pushing spreads down. He links the wider spread to a rise in implied interest-rate volatility, which is the size of rate swings that options prices suggest. The reason is a well-known feature of mortgages, though the article doesn't spell it out. Homeowners can refinance when rates fall, so MBS investors lose high-yielding loans at the worst moment. That makes the bonds less attractive when rates are jumpy, and investors demand more yield.
Is it the 2?
Many analysts have blamed the rise in long-term rates on a higher term premium. The Federal Reserve Bank of New York defines it as the extra compensation investors need for the risk that rates change over the life of a note or bond. Here is a way to picture it (an analogy, not Lawler's): the 10-year yield is a fixed-price contract. Part of the price is your forecast of the floating short-term rate you could otherwise roll over for ten years. The rest is a fee for locking in.
The catch is that nobody can observe the fee directly, so it has to be estimated with a model. Lawler compares three published ones for a 10-year zero-coupon Treasury, a bond that pays everything at maturity:
3 (Adrian-Crump-Moench), published by the New York Fed.
4 (Kim-Wright), published by the Fed's Board of Governors and in the St. Louis Fed's FRED database.
CR, published by the San Francisco Fed.
The CR model's estimates run well above the other two throughout the year. Lawler thinks, but says he doesn't know, that this comes from a different underlying model of how interest rates move. ACM and KW land closer together on average but moved quite differently over the course of 2026.
What the models say
Each model splits the 10-year yield into a term premium and an expected average short-term rate over ten years. Lawler compares that split on December 31, 2025 and October 16, 2026. The text doesn't give the table's exact figures. His summary:
In the ACM and CR models, almost all of the rise in 10-year yields since the end of 2025 comes from higher expected short-term rates.
In the KW model, slightly less than half comes from a higher term premium.
On balance, Lawler concludes, the main driver is not a rising term premium. Markets now expect short-term rates to stay higher over the next decade.
Inflation or real rates?
Higher expected short-term rates could just mean higher expected inflation, because the Fed would set nominal rates higher to fight it. To test this, Lawler looks at 5, Treasury Inflation-Protected Securities. The gap between a regular Treasury yield and a TIPS yield is the "6" inflation rate. His table shows breakevens only slightly higher than at the end of 2025.
Put the two findings together. Expected nominal short-term rates rose a lot, and expected inflation barely moved. So the market's expected real, or inflation-adjusted, short-term rate has risen noticeably. Lawler goes further. He reads this as the market raising its estimate of the intermediate-term 7, the rate that neither speeds up nor slows down the economy. He says it has risen by more than the median forecast in the latest FOMC Summary of Economic Projections, the quarterly forecasts from Fed policymakers.
The AI angle
Lawler ends with a cautious suggestion. The rise in expected real rates began at roughly the same time as actual and expected borrowing for the AI buildout started to surge. He calls this "perhaps not coincidental" and offers no further evidence. The economic logic is ordinary supply and demand for credit: more demand to borrow for data centers and chips, with the same pool of savings, pushes up the real price of money.
Caveats
The split between term premium and expected rates depends on the model, and the models disagree. KW credits nearly half the rise to the term premium, so "it's not the term premium" holds firmly for only two of the three.
Breakevens are not pure inflation forecasts. They also carry inflation-risk and liquidity premiums, which the article doesn't discuss.
The AI link is a timing observation, not a tested cause.
The text doesn't give the actual yield changes, and the data run only to October 16.
For borrowers, the practical point is this. If Lawler is right, mortgage rates are being held up by a lasting change in expected real rates, which a calmer bond market won't reverse. Only the MBS spread part, tied to rate volatility, looks likely to ease if markets settle.
Remember
Two of three Fed models put almost all of 2026's rise in 10-year yields on expected short rates.
Inflation breakevens barely moved, so markets expect higher real rates, not more inflation.
Mortgage-bond spreads widened with rate volatility, but they aren't historically wide.
Co-authored papers and co-filed patents leave a public record of who works with whom. Researchers use that record to measure how connected, or how split up, a research system is.
Map of research fields showing where Europe or the US leads. Darker spots mark more complex fields.
A team from Harvard and the 1, the EU's executive arm, has tried to put numbers on an old complaint: that Europe's patchwork of national systems holds back its research in cutting-edge fields. Joachim Klement, an investment strategist who writes about economic research, summarises the study (Balland et al., 2026). Its main finding is that the more complex a field is, the more likely the US leads.
Why 2 matters now
Within the EU, and more so across wider Europe, each country has its own rules, regulators and grant-making bodies. A German researcher working with partners in Spain or the UK has to deal with all of them. US researchers and companies face, in Klement's words, "essentially one system" of funding and regulation.
That mattered less when one lab could do most of the work alone. Klement argues that fields like AI, quantum computing and biotech now need many collaborators, each with a narrow speciality. Every extra partner adds coordination cost, and more so when partners sit in different jurisdictions.
How it was measured
The researchers measured fragmentation by tracking collaboration in 3 and scientific papers across universities and companies. A fragmented system shows up as groups that rarely co-author or co-file. They also scored each research field for 4, then mapped where Europe or the US holds the advantage, with darker spots for more complex fields. The article doesn't explain the exact formulas. In the related economic-complexity research, a field usually counts as complex when it is rare and needs many specialised skills combined.
What the map shows
Europe leads in engines and pumps, telecoms, green tech and semiconductors.
The US leads in medical technology, biotech, the wider life sciences and computer technology.
The complex fields cluster on the US side. Of those, Europe leads only in green tech and semiconductors. The authors conclude that fragmentation is becoming a growing obstacle to competing in frontier research.
Why it matters for markets
New industries and much recent corporate profit growth come from complex fields. Europe's strengths sitting mostly in mature engineering helps explain why its stock indices hold relatively few fast-growing tech and biotech firms.
Caveats
The link between fragmentation and the gap is the authors' interpretation. Other factors could also matter, such as venture-capital depth, company scale and research pay, and the article doesn't show how the study separates them. Only the publications map is shown, not the patent map. Europe's leads in semiconductors and green tech also suggest fragmentation can be overcome, and the article doesn't explore why those two fields are exceptions.
A team from Harvard and the 1, the EU's executive arm, has tried to measure something Europeans often complain about but seldom quantify: how badly a fragmented research landscape hurts the continent in cutting-edge fields. Their study, cited as Balland et al. (2026), maps where Europe and the US each hold an advantage and how complex each of those fields is. Joachim Klement, an investment strategist who writes about research relevant to investors, summarises the result: the more complex the field, the more likely the US is ahead.
The problem: one system versus many
Klement starts from a familiar contrast. Inside the EU, and more so across wider Europe, each country has its own rules, regulators and grant-making bodies. A researcher in Germany who wants to work with partners in Spain or the UK has to deal with several funding systems and legal regimes at once. In the US, academics and companies face what Klement calls "essentially one system" of grant institutions and one set of regulations, so working with another university or firm across the country involves far less friction.
This mattered less when a single lab or company could do most research on its own. Klement argues that this is no longer true in fields like AI, quantum computing and biotech. Work there is getting more complex and needs more collaborators, each bringing a narrow speciality. Every extra partner adds coordination cost, and if partners sit in different jurisdictions, that cost grows. The less fragmented system therefore pays off most in the fields that need the most collaboration.
How the study measured it
According to Klement's summary, the researchers did two things:
Measured 2 by looking at collaboration in 3 and scientific publications, for both the academic and private sectors. Co-authored papers and co-filed patents show how connected a research community is. A fragmented system shows up as clusters that rarely work together.
Scored the 4 of each research field.
They then plotted fields to show where Europe or the US has the advantage, with darker spots marking more complex fields. Klement shows the map for scientific publications. He doesn't explain exactly how fragmentation or complexity was calculated, or how "advantage" was defined. In the wider economic-complexity literature, which comes partly from Harvard, a field usually counts as complex when it is produced in few places and needs many different capabilities combined. That is general background, not a detail confirmed for this study.
What the map shows
The division is fairly clear:
Europe leads in engine and pump technology, telecommunications, green technology and semiconductors.
The US leads in medical technology, biotech, the life sciences more broadly, and computer technology.
The shading matters most. The darker, more complex fields fall mostly on the US side. Of the complex fields, Europe leads only in green tech and semiconductors. Most of Europe's other strengths are in mature engineering fields such as engines, pumps and telecoms equipment.
The authors conclude that Europe's more fragmented research environment is becoming a growing obstacle to competing with the US in the frontier research of this century.
Why investors and savers should care
Klement doesn't spell out the market link, but it follows. Complex fields are where new industries, and much of the corporate profit growth of recent decades, have come from. Large US technology and biotech companies grew out of research systems that could combine many specialists at scale. If Europe's advantages sit mainly in older, simpler fields, that helps explain why European stock indices hold fewer fast-growing tech and life-science firms. It also suggests that the policy debate over a single EU capital market, shared research funding and harmonised regulation is about more than paperwork.
Caveats and open questions
The article is a short note, so several things are left open:
Correlation versus cause. The map shows Europe trailing in complex fields while being more fragmented. That fragmentation causes the gap is the authors' interpretation. Other factors, such as venture-capital depth, company scale, defence and health spending, and pay for researchers, could also play a part. The summary doesn't say how the study separates these.
Publications versus patents. Only the publications map is shown. The patent map, which is closer to commercial results, could look different.
Measurement choices. Without the method details, readers can't judge how robust the complexity scores or the advantage measures are.
Europe's real strengths. Leading in semiconductors and green tech is not trivial. Both are complex and strategically important, which suggests fragmentation can be overcome in some settings. The article doesn't explore why those two fields are exceptions.
What the note does give is a clear picture to anchor a common argument: Europe's patchwork of national systems may cost the most in the fields where the future value is largest.
Remember
Europe leads mostly in mature engineering fields like engines, pumps and telecoms. The US leads in medtech, biotech and computing.
Among the complex fields, Europe leads only in green tech and semiconductors.
That fragmentation causes the gap is the authors' interpretation. Funding, scale and other factors could also contribute.