Record Home Prices That Aren't Really Records · Morning Gist
Friday, October 305 stories · 16 min
Record Home Prices That Aren't Really Records
Home prices are at records on paper but falling in real terms, plus what Americans get wrong about Social Security and who AI actually helps.
Picked from 35 new articles across 16 sources · arrow keys for other days
Today in 30 seconds
30s left
August Case-Shiller prices hit a record, but after inflation they sit 3.9% below the 2022 peak and only 8.3% above 2006. story 1 ↓
With mortgages above 7%, monthly payments have more than doubled since 2019. A home's return is only one input in rent-vs-buy. story 2 ↓
Nearly half of Americans don't know today's workers fund today's retirees, and over half wrongly think full benefits start at 65. story 3 ↓
Canada and England each spend about 11% of GDP on health, against 18% in the US, but organize care very differently. story 4 ↓
A Michigan study, including a survey of 227 economists, finds AI helps those with less support but helps senior economists even more. story 5 ↓
The Fed was expected to hold rates this week, and markets expect a December hike as it keeps fighting inflation.
1/5Calculated Risk· CalculatedRisk by Bill McBride· Oct 29
US home prices hit record highs but are 3.9% below their 2022 peak after inflation
The August Case-Shiller index shows US home prices at record highs in dollar terms. Adjusted for inflation, they have fallen for 51 months and sit 3.9% below their 2022 peak, Bill McBride notes.
Why it matters · Whether a house is a good buy or a good investment depends on its inflation-adjusted price, and that has been falling slowly for four years even as headlines report record highs.
Know this first
Context from the editor, not the article · 29 sec
1 · What Case-Shiller measures
The S&P CoreLogic Case-Shiller index tracks US home prices by comparing sales of the same homes over time. The National index covers the whole country; the Composite 20 covers 20 large metro areas. Data come out with a two-month lag.
2 · Nominal versus real prices
Nominal prices are the dollar figures as reported. Real prices strip out general inflation, here measured by the Consumer Price Index (CPI). A house can set a record in dollars while losing value in purchasing power.
3 · The 2006 bubble peak
US home prices peaked around 2006, then fell sharply through about 2012 in the housing crash behind the 2008 financial crisis. That peak is still the usual benchmark for asking whether prices are "too high."
2/5A Wealth of Common Sense· Ben Carlson· Oct 29
Is buying a house a bad investment with mortgage rates above 7%?
A young accountant asked whether housing is now the worst asset to buy. Ben Carlson agrees the numbers look poor. He argues that a home you live in is mostly consumption, so comparing it with a stock index misses the point.
Why it matters · For anyone deciding whether to rent or buy, this explains why a home's expected return is only one input, and why it may be the wrong benchmark.
Know this first
Context from the editor, not the article · 23 sec
1 · How mortgage payments scale
A fixed-rate mortgage payment depends on the loan size and the interest rate. When rates go from 3% to 7%, the monthly payment on the same loan rises by more than half.
2 · The rate lock-in effect
Most U.S. owners refinanced into 30-year fixed loans near 3% in 2020–21. Many won't sell and give up that rate, so fewer existing homes come up for sale and prices stay high.
3 · Rent vs. buy framing
The usual comparison sets the full costs of owning against renting and investing the down payment, plus any monthly savings, in a stock index fund.
3/5HumbleDollar· R Quinn· Oct 29
Surveys show most Americans misunderstand how Social Security works
Retired benefits consultant Richard Quinn pulls together surveys showing Americans get Social Security's retirement age, funding, taxes and solvency wrong. He argues those mistakes lead to bad claiming decisions and muddled reform debates.
Why it matters · When you claim, how benefits get taxed, and what "insolvency" really means shape your retirement income and how you should plan around the program's funding gap.
Know this first
Context from the editor, not the article · 30 sec
1 · How Social Security is funded
Workers and employers each pay a 6.2% payroll tax on wages up to an annual cap. That money mostly pays current retirees right away. Any surplus is lent to the Treasury and held in trust funds as special government bonds.
2 · The projected shortfall
More money now goes out than comes in, because there are fewer workers per retiree. The program's trustees project the main trust fund will run out in the 2030s. After that, benefits would be paid only from incoming taxes.
3 · Claiming age matters
You can claim from age 62, but your monthly benefit is permanently cut. If you wait past full retirement age, up to 70, the benefit grows. Spouses, ex-spouses and survivors can claim on a worker's record.
4/5Conversable Economist· conversableeconomist· Oct 29
"National health insurance" covers many systems, and Medicare isn't simple either
Economist Timothy Taylor argues that calls for "Medicare for all" or "national health insurance" are too vague to act on. Medicare already relies on private insurers and out-of-pocket costs, and other countries' systems differ widely.
Why it matters · Health care takes 18% of US GDP and shapes taxes, wages and household budgets, so it helps to know which foreign model a reform proposal actually means.
Know this first
Context from the editor, not the article · 27 sec
1 · How US Medicare works
Medicare is the federal health program for Americans 65 and older. In traditional Medicare, the government pays doctors and hospitals directly, but patients still pay premiums, deductibles (the amount paid before coverage starts) and co-pays.
2 · Health spending as GDP share
Countries compare health systems by total health spending, public and private, as a share of GDP (the value of everything the economy produces). A higher share leaves less for other consumption and investment.
3 · The Commonwealth Fund
A private US foundation that researches health policy. It is well known for comparing health systems across countries and publishes standardized profiles so readers can line up how each nation finances and delivers care.
5/5Marginal Revolution· Tyler Cowen· Oct 28
AI helps economists with less support but helps senior economists more
Economists Tianyu Jiang and Claire Wang find that since ChatGPT arrived, researchers without paid assistants have caught up with those who have them. Over the same period, senior researchers have pulled further ahead of junior ones.
Why it matters · It's an early, data-based look at a question that reaches beyond academia: does AI level the field for people with fewer resources, or reward people who already know the most?
Know this first
Context from the editor, not the article · 28 sec
1 · Who does economic research
Academic economics papers usually start as working papers and reach top journals years later. Well-funded researchers hire research assistants (RAs) to clean data, write code and run analyses, which gives them an advantage in output.
2 · The narrowing-or-widening debate
Earlier studies of call-center agents, consultants and writers often found that generative AI helped the least experienced workers most and so narrowed gaps. Whether the same holds for expert, creative work is still an open question.
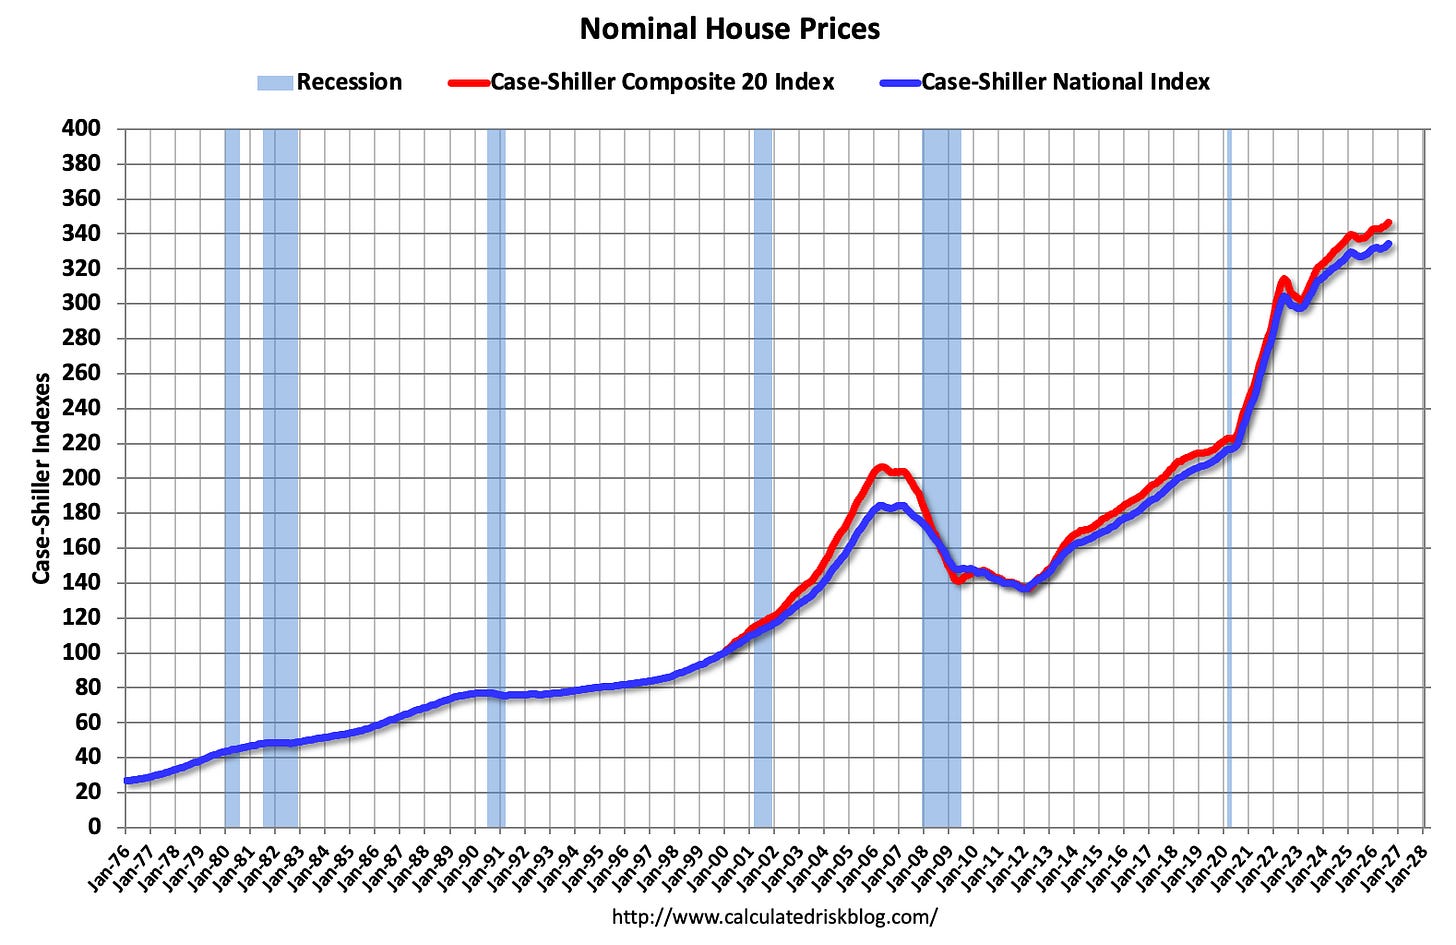
Nominal Case-Shiller National and Composite 20 indexes, both at all-time highs in August.1 / 2
Record highs, but only in dollars
The August 1 house price index came out on Tuesday. The index, from S&P CoreLogic, tracks US home prices through repeat sales of the same homes. It shows prices at all-time highs in dollar terms. The 2 National index is 81.1% above its mid-2000s bubble peak, and the 3, covering 20 big metros, is also at a record.
Bill McBride of Calculated Risk argues the more useful figure is the inflation-adjusted, or "4", one. He gets it by dividing prices by the 5. On that basis, the National index is 3.9% below its 2022 peak and the Composite 20 is 3.6% below its own. Both real indexes slipped slightly again in August. Real prices have now been falling for 51 months.
Why the adjustment matters
McBride's example: a $300,000 house in January 2010 would have to sell for about $461,000 today just to keep pace with inflation, a 54% gain that buys nothing in real terms. Over longer periods the gap gets bigger. National prices are 81.1% above the bubble peak in dollars but only about 8.3% above it in real terms. The Composite 20 is just 0.5% above.
This is how prices can be flat and falling at the same time. An illustration with assumed numbers: a home whose price doesn't change while CPI rises 3% has lost about 3% in real value.
The "purgatory" pattern
McBride notes that after a sharp boom, real prices usually take years to reach a new high. Nominal prices stall instead of crashing, and inflation does the rest. He has called this "7 years in purgatory", while admitting the seven is just a good headline. The post-2020 surge looks to be following the same path.
The 2026 outlook
His forecast at the start of the year was flat to slightly lower national prices in 2026. More homes are now for sale, and higher mortgage rates are cutting demand. So he expects nominal prices to finish roughly flat and real prices to fall further.
Still high by history
Even after four years of real declines, McBride says prices remain historically high: 8.3% above a peak that was itself a bubble. Real home prices do tend to rise slowly over time, which softens that comparison somewhat. His price-to-rent and affordability charts are behind a paywall and aren't covered here.
One general caveat: CPI includes rent-driven shelter costs. Using it to adjust house prices therefore partly measures housing against itself.
The news
The August reading of the 1 house price index came out on Tuesday. The index, run by S&P CoreLogic, tracks US home prices through repeat sales of the same properties. In dollar terms it set another record. Both the 2 National index and the 3, which covers 20 big metro areas, are at all-time highs. The National index is 81.1% above its mid-2000s bubble peak.
Bill McBride of Calculated Risk argues that this headline hides more than it shows. After adjusting for inflation, the National index is 3.9% below its 2022 peak and the Composite 20 is 3.6% below its own. Both 4 indexes slipped slightly again in August. It has now been 51 months, or four years and three months, since real house prices peaked.
Why "real" prices matter
Most coverage charts nominal prices, the dollar figures as reported. McBride divides those by the 5 to get real prices, which measure what a house costs in purchasing power. His example: a house priced at $300,000 in January 2010 would need to sell for about $461,000 today just to keep up with inflation. That is a 54% rise that buys the owner nothing in real terms.
The gap between the two views is large over long periods. Nominally, national prices are 81.1% above the bubble peak. In real terms they are only about 8.3% above it, and the Composite 20 is only 0.5% above. A rough inference from those two figures, not one the article makes: consumer prices overall have risen by about two-thirds since the bubble peak, because 1.811 ÷ 1.083 ≈ 1.67.
The same logic explains how prices can be "flat" and "falling" at once. An illustration with assumed numbers: if a home's price is unchanged over a year while CPI rises 3%, its real price has fallen about 3%. That is roughly what McBride expects for 2026.
The pattern after a boom
McBride points to a pattern he has written about before under the title "House Prices: 7 Years in Purgatory". After a sharp run-up, real prices usually take several years to reach a new high. Nominal prices tend to stall rather than crash, and inflation slowly brings real prices down. He says there is "nothing magic" about seven years; it just made a good headline. The current stretch, at 51 months, fits the pattern so far.
The 2020–2022 run-up was steep, so on this reading a long flat spell is normal and not a sign of trouble.
The 2026 outlook
McBride's forecast at the start of the year was "mostly flat to a small decline in prices nationally in 2026." He now thinks nominal prices will end the year mostly flat, with real prices falling further. He gives two reasons:
More inventory. More homes are for sale, which gives buyers more choice and less reason to bid up prices.
Higher mortgage rates. Higher rates cut how much buyers can borrow on a given income, which reduces demand.
Still expensive by history
Even after four years of real declines, McBride stresses that real prices are historically high: about 8.3% above a bubble peak that was itself seen as extreme. He adds a qualifier. Real house prices have tended to rise slowly over the long run, so some gain over 20-plus years is expected. That makes the bubble peak an imperfect benchmark, but he still judges today's level as elevated.
What's left out and the caveats
The full post also includes a 6, an affordability index and a chart of five-year real returns on the National index. Those sections are behind the paywall and aren't covered here, so this piece can't say what they show about valuation compared with rents or incomes.
A general caveat that applies to this kind of analysis: CPI includes shelter costs, which follow rents. Deflating house prices by headline CPI therefore partly measures housing against itself. Analysts sometimes use CPI excluding shelter for this reason, which would give somewhat different real figures. The article uses headline CPI. Case-Shiller is also a three-month moving average released with a lag, so the August figure reflects deals mostly struck in early summer.
For someone deciding whether to buy, the practical point is that a record in dollars is not a record in value. In real terms, buyers today pay a little less than in 2022, though still a lot by long-run standards. And borrowing costs, not the sticker price, often decide affordability.
Remember
A record home price in dollars can still be a real decline: US prices have fallen after inflation for 51 straight months.
After a boom, house prices usually stall in dollar terms for years while inflation slowly brings real prices down.
Even after four years of decline, real US home prices are about 8.3% above the 2006 bubble peak.
Funds that sell options on stocks to collect premiums, giving high payouts but limiting upside.
Average U.S. monthly mortgage payment over time; it has more than doubled since the late 2010s.1 / 2
A reader, a 1 in his late twenties, asked Ben Carlson of A Wealth of Common Sense a numbers-only question. With mortgage rates above 7%, higher insurance and property taxes, and prices that won't fall, is a house the worst financial asset to buy right now, especially next to a booming stock market and high bond yields?
The numbers are bad
Carlson tracks the average monthly mortgage payment over 30-plus years. He uses the median U.S. existing-home sale price, the going 2 mortgage rate and a 20% down payment. Through the 2010s, low rates kept payments close to their 1990s and 2000s levels. Then prices rose more than 50% and mortgage rates more than doubled. Average monthly payments are now more than double their late-2010s level. Home insurance is up almost 50%, and down payments and property taxes have risen with prices. Carlson says affordability is "about as bad as it's ever been."
He thinks future returns will probably be lower, because the market "pulled forward a good decade's worth of gains." On the 3, the standard measure of U.S. home prices, 2026 looks set to be the second year in a row that prices grow more slowly than inflation.
Arguments on both sides
Bearish: In the 2030s, more homes should come up for sale as baby boomers die, downsize or move.
Bullish: The U.S. isn't building enough homes. Activity could also jump if mortgage rates fall, though not if they fall because of a financial crisis.
4: Because most of the price is borrowed, modest price gains can still mean a good return on the down payment.
Location matters a great deal. In some places, renting and investing the difference comes out ahead. In others, the better choice is to lock in a 30-year fixed rate and refinance later. Either way, a buyer has to accept owning one concentrated, undiversified, leveraged asset.
Carlson's real answer: wrong question
Carlson argues that a primary residence is "more consumption than investment." You have to live somewhere, so the 5 isn't a fair benchmark: "You can't live in an index fund." A house also carries costs a fund doesn't, including agent fees, closing costs, taxes, insurance, maintenance and renovations. It is also 6. That works as forced savings, but you can only reach the money by selling or borrowing against the house.
The reasons to buy, in his view, are mostly not about returns: putting down roots, a stable payment that hedges against inflation, control over your housing, no mortgage in retirement, and something to leave to heirs. His baseline guess is that home prices roughly keep up with inflation. His advice is to run the numbers but not "live and die" by the expected return.
Ben Carlson, who writes A Wealth of Common Sense, answered a question from a late-twenties 1. The reader is married with no kids and calls himself "a number-crunching spreadsheet guy." He wanted feelings left out of it. Mortgage rates are above 7%. Insurance costs more. A down payment takes longer to save. Property taxes have risen with prices, and prices won't come down. Meanwhile stocks keep climbing, bond yields are higher, and option-income strategies (funds that sell options on stocks to collect premiums) advertise double-digit yields. So, he asked, isn't housing the worst financial asset to buy right now?
Carlson's answer has two parts. On the reader's own terms, the numbers really are poor. But Carlson argues those are the wrong terms.
How affordability broke
In the early 2020s, while borrowers still had roughly 3% mortgages, Carlson built a simple series. He took the median U.S. existing-home sale price and the prevailing 2 mortgage rate, assumed a 20% down payment, and calculated the average monthly payment over more than 30 years. Because rates had fallen so far, payments at the end of the 2010s were not much higher than in the 1990s or 2000s. Low rates were making up for higher prices.
That balance ended quickly. Prices rose more than 50%, and mortgage rates more than doubled. His updated chart shows average monthly payments now more than double their late-2010s level.
To see why the two combine so sharply, here is an illustrative calculation (ours, not Carlson's), counting principal and interest only. A $400,000 house with 20% down needs a $320,000 loan. At 3% over 30 years, that costs about $1,350 a month. Raise the rate to 7% and the same loan costs about $2,130. Raise the price by 50% as well, to $600,000 with a $480,000 loan, and the payment is about $3,190. That is roughly 2.4 times the original. Each change pushes the payment up, and together they multiply.
The rest of the bill has grown too. Carlson notes home insurance is up almost 50%. The 20% down payment is a fixed share of a bigger price, so it is a larger dollar amount. Property taxes are generally based on assessed value, so they rise with it. His verdict is that affordability is "about as bad as it's ever been."
Why returns probably cool from here
Carlson thinks the 2020s "pulled forward a good decade's worth of gains," so lower returns ahead would make sense. That seems to be happening already. On the 3, the standard measure of U.S. home prices based on repeat sales of the same houses, gains have levelled off. With 2026 not yet over, it looks like the second straight year that national home prices grow more slowly than inflation. That means prices are falling slightly in real terms, after adjusting for inflation.
He lays out the forces on each side:
Demographics, for now: The large millennial generation is in its prime home-buying years, which supports demand.
Supply in the 2030s: Carlson expects "a decent amount of supply" to reach the market as baby boomers die, downsize or move to Florida.
Underbuilding: The main bull case is that the U.S. simply isn't building enough homes.
Lower rates: If mortgage rates fall to a more reasonable level, housing activity could surge. Carlson's footnote: unless rates are falling because of a financial crisis.
Location shapes all of this. Some cities are far less affordable than others, and some regions are more attractive. In some places, renting and investing the difference in stocks wins financially, and you avoid the burdens of ownership. In others, the better move is to lock in a 30-year fixed rate, refinance if yields fall, and build equity. A buyer also has to be comfortable owning a concentrated, single, undiversified, leveraged asset. No stock investor would build a portfolio that way.
The leverage point
4 is what can make the investment case work even when price growth is modest. Here is an illustrative example (ours): a $400,000 house bought with $80,000 down rises 3% in a year, adding $12,000 of value. Measured against the $80,000 of your own money, that is a 15% gain. The figure ignores interest, taxes, insurance and maintenance, and leverage magnifies losses in exactly the same way. The point is that "prices just keep pace with inflation" can still mean a reasonable return on equity.
Carlson's reframe: housing is consumption
Carlson grants that a home can be a financial asset. You build equity over time. You can borrow against it to renovate. And it gets favorable tax treatment; in the U.S., for example, a large part of the gain on selling a primary home is excluded from capital-gains tax. But he does not treat a primary residence as an investment "per se." You need somewhere to live either way, so housing is mainly consumption.
On that view, the 5 is not a realistic benchmark. "You can't live in an index fund. You can't have your friends over for a dinner party in an 6." The cost structures also differ. An index fund has one clear expense ratio. A home brings agent fees, moving and closing costs, property taxes, insurance, maintenance, renovations and lawn care. A house is also 7. That works as forced savings, but you can only get at the money by selling or borrowing against the property.
Carlson says the psychological side can't be left out, despite the reader's request. People buy to put down roots, to get a stable housing payment that hedges against inflation, to control their living situation, to own something outright in retirement so their biggest monthly expense goes away, and to leave something to their heirs.
What it leaves open
Carlson admits he doesn't know whether housing will deliver solid gains. His baseline guess is that prices keep up with inflation. He doesn't run an actual rent-versus-buy comparison for the reader. He also doesn't respond to the reader's comparison with high bond yields or option-income funds, which have their own risks that the reader doesn't mention. The practical advice is short: run the numbers for your own market, but don't "live and die" by the return you expect a house to earn.
Remember
Higher prices and higher rates together pushed typical monthly payments to more than double their late-2010s level.
National home prices are on track for a second straight year of growing more slowly than inflation.
Carlson says the right comparison is renting versus owning, not a house versus the S&P 500.
Richard Quinn, a retired benefits consultant who writes for HumbleDollar, has collected survey results showing how poorly Americans understand Social Security. His argument: the confusion leads to bad claiming decisions and makes reform harder to debate.
Timing and size
1 is the age when you get your full, unreduced benefit. Allianz Life found more than half of Americans think FRA is 65. It is 66 or 67 depending on birth year. In a 2025 Cato Institute/YouGov survey, only 39% correctly said 67. The mistake costs money, because claiming before FRA permanently shrinks the monthly check.
About one in five people expect Social Security to cover their whole retirement. Quinn notes it replaces roughly 40% of an average worker's pre-retirement pay, and less for high earners. Only 27% in a Social Security Administration study understood that the benefit depends on both your earnings history and the age you claim. Benefits for spouses, ex-spouses (after a marriage of 10 years or more) and survivors are often missed.
Taxes
RAND research found about a quarter of people think benefits are always tax-free. In fact, once "2" (roughly half your benefit plus your other income) passes certain limits, up to 85% of benefits becomes taxable. Some people wrongly read that as an 85% tax rate. That share is simply added to taxable income and taxed at your normal rate.
Funding
Nearly half of Cato's respondents didn't know that today's workers' 3 pay today's retirees. Some pictured a personal savings account. Many younger workers expect the system to "go bankrupt." Quinn notes that after the 4 run out, incoming taxes would still pay about 80% of scheduled benefits, with that share slowly falling. The realistic risk is a cut, not zero.
He also corrects two popular claims:
5: Congress doesn't set the annual cost-of-living adjustment. A formula ties it to an inflation index. A senior-focused index called 6 might give slightly larger raises, but there's no money to pay for them.
Wage cap: Payroll tax applies only up to a yearly earnings limit, and just 6% of workers earn above it. Quinn says taxing all wages would keep the system solvent about 20 years longer. It wouldn't fix it permanently or pay for bigger benefits.
His own record
Quinn has paid $132,891 in Social Security tax since 1959, and his employers paid $133,571. He and his wife have collected "many times" that since 2008. He says most people recover what they paid within six years but gives no source. That figure likely counts only the worker's share, in dollars not adjusted for inflation. You can check your own record on SocialSecurity.gov.
Richard Quinn, a retired benefits consultant who writes regularly for HumbleDollar, has collected survey results showing how little Americans know about Social Security. His argument: this ignorance does more than embarrass. It leads people to claim benefits at the wrong time, plan retirement around bad assumptions, and resist reforms they don't understand. "It's hard to solve a problem if we refuse to accurately understand it," he writes.
What people get wrong about timing and size
1. FRA is the age at which you get your full, unreduced benefit. Allianz Life research found more than half of Americans think it's still 65. It is 66 or 67 depending on birth year, and 67 for anyone born in 1960 or later. In a 2025 Cato Institute survey run with the polling firm YouGov, only 39% correctly said 67. The mistake costs money. Claiming before FRA permanently cuts the monthly check, so someone who claims at 65 believing it's "full" locks in a smaller benefit for life.
How much it replaces. About one in five Americans think Social Security alone will cover their retirement. Quinn notes it replaces about 40% of an average worker's pre-retirement earnings. The share is higher for low earners and lower for high earners, because the benefit formula is progressive: it replaces a bigger fraction of the first dollars of lifetime earnings.
The benefit formula itself. Only 27% of respondents in a Social Security Administration study understood how benefits are calculated. Two things matter most: your earnings history and the age you claim.
Family benefits. People often miss benefits for spouses, for ex-spouses (if the marriage lasted 10 years or more) and for survivors. Quinn says this leads households to claim at the wrong times. One common example from general practice: a higher earner who claims early also shrinks the survivor benefit the widowed spouse will live on later.
Taxes: two opposite mistakes
The RAND Financial Literacy Center found confusion in both directions. About a quarter of people think benefits are always tax-free. Others don't realize that "2" can make up to 85% of benefits taxable. Combined income is roughly half your benefit plus your other income, including investment income and wages from continued work. Some people make the opposite mistake and think the tax rate on benefits is 50% or 85%.
How it actually works: under long-standing federal rules, once combined income passes about $25,000 for a single filer ($32,000 for a married couple), up to 50% of benefits count as taxable income. Above $34,000 ($44,000 for couples), up to 85% does. That income is then taxed at your ordinary rate. So for a retiree in the 12% bracket, the most they pay is about 10% of their benefit (85% × 12%), not 85%. These thresholds aren't indexed to inflation, which is why more retirees cross them every year.
Funding and "bankruptcy"
The Cato survey found nearly 49% didn't know that current workers' 3 pay current retirees' benefits. Some thought their taxes sat in a personal account waiting for them. Quinn points out the program has been funded this way since 1939, when amendments moved it toward pay-as-you-go financing and added survivor and dependent benefits.
AARP reports that only about 23% of adults understand how the trust fund works. Many younger workers expect Social Security to "go bankrupt" and pay nothing. Quinn notes that even after the 4 run out, incoming payroll taxes plus income taxes on benefits would still cover roughly 80% of scheduled benefits if Congress does nothing, though that share falls over time. The real risk is a cut of about a fifth across the board, not zero.
He also pushes back on two common claims:
Cost-of-living adjustments (5). Neither Congress nor the president sets the annual COLA. It comes from a formula tied to an inflation index, the CPI-W (the consumer price index for urban wage earners). Some argue for 6, an experimental Bureau of Labor Statistics index weighted toward older people's spending, especially on healthcare. Quinn concedes CPI-E would usually give slightly higher raises, but says the program has no money to pay for them.
He adds that Social Security is insurance, not just a pension. It also covers disability, spouses and survivors. Debates that treat it purely as a retirement investment leave that out.
Quinn's own numbers, and their limits
To answer people who say they paid far more than they'll ever get back, Quinn shares his own record from SocialSecurity.gov. Since 1959 he paid $132,891 in Social Security tax, and his employers paid $133,571. He doesn't know why the two differ. One likely reason: the 2011–2012 payroll tax holiday temporarily cut the employee rate but not the employer's. He and his wife Connie began collecting in 2008 and have received "many times" what they paid. His $98,097 in Medicare taxes, he says, is a small fraction of the 8 (hospital insurance) benefits they've used.
He also claims most people get back what they paid in SS taxes within six years of starting benefits. The article gives no source for this. It probably counts only the worker's share of the tax, and nominal dollars that aren't adjusted for inflation. His own example is a long-lived married couple, which is a favorable case. Your own result depends on your earnings, how long you live and whether you're married. Your contribution history on SocialSecurity.gov is the place to check.
What's left open
This is a short opinion post, not a study. It cites several surveys but doesn't link them or describe how they were done. It argues that the cap fix isn't enough but doesn't say what mix of tax increases and benefit changes Quinn would support. His core point does hold up: many popular beliefs about Social Security are wrong, and people pay for those mistakes in their own claiming decisions.
Remember
Claiming at 65 because you think it's "full" retirement age permanently cuts your monthly benefit.
Up to 85% of benefits can be taxable income, taxed at your normal rate. It is not an 85% tax.
If the trust funds run out, benefits would drop to about 80% of what's promised, not to zero.
US debates often set the American health system's problems (high costs, gaps in insurance, unequal access, worse outcomes than many rich countries) against a vague alternative: "national health insurance, like every other country" or "Medicare for all." In a short post on Conversable Economist, economist Timothy Taylor argues that neither phrase means much until you say which system you have in mind.
Medicare is already a mix
Taylor points out that Medicare, the federal program for people 65 and older, is not the "everything covered by someone else" plan the slogan suggests:
Over half of enrollees use 1 (Part C). Under it, the government pays a private insurer a 2 amount per person, meaning more for sicker people, and the insurer provides the care.
Traditional Medicare, where the government pays providers directly, still charges premiums, deductibles and co-pays. Many enrollees buy private 3 policies to cover those costs and services Medicare leaves out.
Over the next 75 years, projected Medicare payments under current law exceed projected revenues by about $60 trillion. Taylor suggests fixing that before holding the program up as the model.
"Other countries" aren't one model
Canada and England come up most often. Both cover 100% of residents, and both spend about 11% of GDP on health care, against 18% in the US. Taylor notes that the lower spending frees money for other things. He doubts, though, that a concrete US plan to cut health spending by a third would survive politically.
The two systems also differ a lot:
Private insurance: about 69% of Canadians carry it on top of the public plan, against roughly 12% in the UK.
Who runs it: Canada's system is run province by province, roughly as if each US state ran its own. Britain's 4 is run nationally.
How doctors are paid: most British physicians are on salary, and most specialists are paid directly by the NHS. Many Canadian doctors still bill 5, meaning they are paid per visit or procedure.
A third family of systems, in Germany, the Netherlands and Switzerland, has individuals buy coverage from competing insurers under heavy regulation.
Where to start
Taylor recommends the 6's new profiles of 31 countries, about 20 pages each. They cover the US, Canada, ten European countries, Japan, Australia, Taiwan and Israel, plus China, India, Brazil, Nigeria, Ethiopia, Indonesia and the Philippines. His point is that the US can learn from abroad, but only by looking at the details.
The post is a framing argument. It does not compare health outcomes or say which model works best.
Economist Timothy Taylor, who writes the Conversable Economist blog, has a short post with a simple complaint about how Americans debate health care. The US system's problems are well documented: high costs, people without insurance, unequal access to care, and health outcomes worse than in many other high-income countries. But the alternative people offer is usually vague: "national health insurance, like all the other countries in the world," or "Medicare for all." Taylor calls these alternatives "nebulous" because the slogans seem to promise all the care anyone wants, with all or nearly all of the bill paid by someone else. He argues that neither Medicare nor foreign systems actually work that way.
What Medicare actually looks like
Medicare is the US federal health program for people 65 and older. Taylor points to three features that the "Medicare for all" slogan usually leaves out.
Private insurers already deliver much of it. More than half of Medicare recipients now get their benefits through 1, also called Part C. Under Advantage, the government doesn't pay doctors directly. It makes a 2 payment to a private insurance company, which then provides the person's care. Risk adjustment means the payment is higher for people expected to need more care and lower for healthier people, so insurers have less reason to sign up only healthy enrollees. In practice, a large share of "government" health insurance for older Americans is run by private companies.
Traditional Medicare isn't free at the point of use. In traditional Medicare, the government pays providers directly, but enrollees still pay premiums, deductibles (what you pay before coverage starts) and co-pays (a fixed charge per visit or service). These costs, plus services Medicare doesn't cover, are large enough that many people on traditional Medicare buy a private 3 policy to protect themselves against big bills. Taylor argues that most people who say "Medicare for all" don't picture a plan that is partly government-paid, carries meaningful out-of-pocket costs, and keeps private insurers at its center. That, though, is what Medicare is.
It has a long-term funding gap. Under current law, projected Medicare payments over the next 75 years exceed projected revenues by about $60 trillion. Taylor's dry suggestion is that it "might be prudent" to fix Medicare's long-term solvency before promoting it as the solution for everyone.
"National health insurance" names many different systems
The second half of the argument is that "what other countries do" is not one thing. National health insurance systems vary a great deal even among rich countries.
As a resource, Taylor points to the 4, a US health-policy foundation, which recently published "International Health Care System Profiles" for 31 countries. The high-income countries covered include the US, Canada, ten European countries, Japan, Australia, Taiwan and Israel. The rest are large economies elsewhere: China, India, Brazil, Nigeria, Ethiopia, Indonesia, the Philippines and others. Each profile runs about 20 pages. Taylor reads that length as an attempt to be thorough without overwhelming the reader.
Canada vs. England: the same headline, different systems
Americans most often compare themselves with other English-speaking countries, especially Canada and England. The headline numbers look alike:
Canada
UK/England
US
Population with coverage
100%
100%
not universal
Health spending, share of GDP
~11%
~11%
~18%
Share with private insurance
69%
~12%
—
Taylor sees two sides to the spending gap. Spending 11% of GDP instead of 18% leaves more for consumption of other goods and services. But he suspects any concrete US proposal to cut total health spending by about a third, down to British or Canadian levels, "would go down in flaming defeat." A slogan can promise savings. A specific plan has to say whose income or care shrinks.
Below the headline numbers, the two systems are built differently:
Private insurance. Most Canadians (69%) buy private insurance on top of the public program, typically for things the public plan leaves out. Only about 12% of Britons do.
Who runs it. Canada's system is organized by province. Taylor's analogy is giving each of the 50 US states lead authority over health insurance. Britain's 5 is organized nationally.
So "do what Canada does" and "do what Britain does" point to different policies on insurance, governance and doctors' pay.
A third model: 7
Taylor also notes that Germany, the Netherlands and Switzerland build universal coverage around individual health insurance policies, with regulated competition among insurers. People hold their own policies from insurers that compete with one another, under rules set by the government. That is a long way from both the British single national service and Canada's provincial public plans.
What the post does and doesn't do
Taylor's conclusion is that complaining about the US system isn't enough. Reformers can learn from other countries, but the systems differ, so a serious debate has to get into the details, and the Commonwealth Fund profiles are a reasonable place to start.
The post is short, and its limits are worth stating. It doesn't compare health outcomes, waiting times, prices or administrative costs across systems. It doesn't say which model fits the US best or why US spending is so much higher. It also doesn't break down the $60 trillion Medicare projection. What it does is make the vague debate more specific: before arguing for "national health insurance," say which country's version you mean, and how it handles private insurance, governance and paying doctors.
Remember
More than half of Medicare enrollees already get their care through private insurers under Medicare Advantage.
Canada and England spend the same share of GDP, but differ on private insurance, who runs the system and how doctors are paid.
Germany, the Netherlands and Switzerland reach universal coverage through competing insurers under heavy regulation, not a single government payer.
Tyler Cowen flagged it on his blog Marginal Revolution. It is a job market paper, the signature research a new PhD presents when applying for faculty jobs, so it is new and has not been peer-reviewed.
Image: Marginal Revolution
Tyler Cowen has highlighted a new paper by Tianyu Jiang, a PhD 1 at the University of Michigan, and co-author Yuqing (Claire) Wang. It asks whether generative AI narrows or widens productivity gaps among economists. Their answer is both, depending on which gap you look at.
Three kinds of evidence
The authors draw on three sources:
Working-paper and publication records from the 2 (National Bureau of Economic Research, a large US network that circulates economists' working papers).
A text-based measure that estimates how much of each paper's writing was assisted by 3, the systems behind tools like ChatGPT.
Their own survey of 227 academic economists about how they use AI for different research tasks.
Gaps that narrowed
After ChatGPT launched in late 2022, NBER authors who had no 4 published a larger share of their papers in top journals. Authors on smaller teams wrote more working papers and got them published faster. AI seems to stand in for the hired help that well-funded researchers already had.
A gap that widened
The survey lets the authors link each person's AI use to their output. Averaged across everyone, the evidence that AI increases working-paper output is weak. The averages hide a split, though. More AI exposure shrinks the output gap between researchers with and without RAs, and it widens the gap between senior and junior researchers.
The obvious objection is that senior people might simply use AI more. The data show the opposite. Junior researchers use AI more intensively and are more likely to use 5, AI systems that carry out multi-step tasks on their own. So the authors conclude that seniors get more out of each unit of AI use. The gap comes from different returns, not from who chooses to use it.
The proposed explanation
The authors model research as two inputs:
Execution: coding, data work, drafting. This has diminishing returns, so extra help matters most to people who have little of it.
Conceptual capacity: knowing which questions matter and how to frame them. This has increasing returns.
The two inputs complement each other. AI is cheap execution, so it fills the gap for people without assistants. It also frees experts to apply judgment they built up over years.
The caveat
The authors expect today's convergence may not last. Once execution stops being a bottleneck for anyone, and as AI gets better at conceptual work, the gaps could widen overall. This is an unreviewed paper. The abstract Cowen posted gives no effect sizes, so how large these effects are is still unknown.
Tyler Cowen has pointed readers of Marginal Revolution to a paper by Tianyu Jiang, a PhD 1 at the University of Michigan, written with Yuqing (Claire) Wang. It asks a question that matters well beyond economics departments: does generative AI shrink the productivity gaps between the haves and have-nots of research, or make them bigger? Their answer is that AI does both, along different dimensions. Cowen posted only the abstract, so what follows covers the paper's design and conclusions but not the size of its effects.
Why the question is hard
Earlier studies of AI at work, such as customer-support agents and writing tasks, often found the largest gains among the least skilled. That pointed to a levelling effect. Research is a different kind of work. Part of it is execution: cleaning data, writing code, running regressions, drafting text. Part of it is conceptual: choosing a question worth answering, seeing what a result means, and knowing which approach a referee will accept. AI could help with either part, and the two parts are spread very unevenly across researchers. Well-funded economists can hire 2 for execution. Senior economists have spent decades building conceptual judgment.
A second difficulty is selection. If people who use AI produce more, that could be because AI helps, or because productive people are the ones who adopt it.
Three sources of evidence
The authors combine three datasets:
3 records. The National Bureau of Economic Research is a large US network whose members circulate working papers before journal publication. Its records let the authors track who writes what, with how many co-authors and RAs, and where and how quickly the work is published.
Text-based measures of LLM-assisted writing. A large language model (LLM) is the kind of system behind ChatGPT. Researchers can estimate how much LLM help a text received from statistical traces in its wording. The abstract doesn't describe the exact method.
An original survey of 227 academic economists asking how much they use AI for different research tasks.
Finding 1: after ChatGPT, resource gaps narrowed
ChatGPT's public release in late 2022 gives a natural before-and-after comparison. Afterwards, NBER authors without RAs published a larger share of their papers in top-tier journals. Authors from smaller teams increased their working-paper output and moved papers to publication faster. The natural reading is that AI gave researchers who lacked assistants a cheap version of the help better-resourced colleagues already had.
Finding 2: on average, little effect; underneath, a split
The survey ties each researcher's AI use to their own output. Averaged across everyone, the authors find only weak evidence that AI raises working-paper output. The split appears in 4 estimates. These compare changes over time, between more and less AI-exposed researchers, and across a third dimension such as having RAs or being senior. The design isolates how AI's effect differs between groups, not just whether AI has an effect. Two results stand out:
More AI exposure narrows the output gap between researchers with and without RAs.
More AI exposure widens the gap between senior and junior researchers.
Ruling out the obvious objection
If senior economists simply used AI more, the widening gap would say nothing about AI's returns. The survey shows the reverse. Junior researchers use AI more intensively and are more likely to use 5, AI systems that plan and carry out multi-step tasks such as writing and running code on their own. Juniors use more AI and still gain less from it than seniors. The authors therefore attribute the widening gap to differences in returns to AI, not to who selects into using it.
The model: execution versus conception
To explain the pattern, the authors build a model with three assumptions:
Diminishing returns to execution. The first bit of coding and data help matters a lot. Each additional bit matters less.
Increasing returns to conceptual capacity. More judgment and expertise pays off disproportionately.
Complementarity. The two inputs make each other more valuable.
Here is an illustrative analogy (not from the paper). Two cooks get a free kitchen assistant. A home cook who used to do all the chopping gains a lot, because the worst bottleneck is gone. A head chef already had prep staff, so the assistant adds less labour. But the chef can now try more dishes, and those dishes benefit from a lifetime of knowing what works. The assistant closes the gap between kitchens with and without staff. It widens the gap between novice and master, because the master turns freed-up time into more valuable output.
In the paper's terms, AI is a cheap supply of execution. Because execution has diminishing returns, AI helps most where execution was scarce, among researchers without RAs. Because execution complements conceptual capacity, which has increasing returns, AI also raises the value of seniors' accumulated expertise.
What may come next
The authors suggest the early convergence may not last. Once AI has removed execution constraints for nearly everyone, the levelling effect runs out. If AI also gets better at conceptual work, the inputs that seniors already have in abundance become more productive still. On that reading, the overall effect could move from narrowing gaps to widening them.
What to keep in mind
This is a job-market paper, which means it is new and has not been peer-reviewed. The abstract gives no effect sizes, sample sizes for the NBER analysis, or detail on how LLM-assisted writing is detected. A survey of 227 economists is modest and may over-represent people interested in AI. Publication in top journals depends on referees and editors, who may themselves be changing how they judge AI-assisted work. The broader point still applies outside academia. A tool that substitutes for routine help mainly benefits people who lacked that help. A tool that complements judgment benefits the people who already have the most judgment.
Remember
Juniors use AI more than seniors yet gain less, so the gap reflects returns, not adoption.
AI substitutes for routine help and complements expertise, so it narrows some gaps and widens others.
The authors warn that today's levelling may reverse once execution stops being a bottleneck for anyone.
Removing the 7. Payroll tax applies only up to a yearly earnings limit. Only about 6% of workers earn more than that. Quinn says taxing all wages would keep the program solvent about 20 years longer. It would not make the system permanently sustainable, much less pay for bigger benefits.
How doctors are paid. Because of that structure, pay is set differently. Most British physicians are salaried, and most specialists are paid directly by the NHS. A number of Canadian physicians still work 6, meaning they are paid for each visit or procedure, much as many US doctors are.