Four engineering write-ups on running systems at scale: World Cup traffic, a fleet of sensors you can't easily reach, shared metric definitions, and automated access cleanup.
Picked from 64 new articles across 34 sources · arrow keys for other days
Today in 30 seconds
30s left
WhatsApp hit 30 million messages per second at the World Cup final. Meta kept deploying, and every region peaked at once, so it had no spare capacity to borrow. story 1 ↓
A software team took over 800,000 battery-powered store sensors and moved 3,000 stores to a new network. Its defaults for testing, deployment and observability had to change. story 2 ↓
Netflix's DataJunction started as a three-engineer side project and became its central metric layer. It cut the time to define a new metric from weeks. story 3 ↓
GitHub's Evergreen, a small Go app, removes outside collaborators when nobody answers an access review. It keeps its state as JSON files in git. story 4 ↓
1/4Engineering at Meta· Oct 15
How Meta handled record 2026 World Cup traffic without a deploy freeze
Meta reports that WhatsApp peaked at 30 million messages per second during the 2026 World Cup final. It handled the load with capacity provisioned ahead of time, per-region forecasts and selective load shedding, and kept deploying code throughout.
Why it matters · The report shows two standard big-event habits, borrowing capacity from other regions and freezing deploys, being dropped on purpose, and explains why each choice was made.
Know this first
Context from the editor, not the article · 38 sec
1 · Planned peaks as stress tests
Large services treat events with known dates, such as New Year's Eve or major finals, as stress tests. Teams forecast the peak, load-test their services, reserve extra capacity and often freeze code changes. The hard part is that demand jumps within minutes, faster than reactive autoscaling can add machines.
2 · Meta's traffic stack
User requests pass through layers. Global load balancing sends each user to a nearby edge site. Katran, an L4 load balancer that works on network connections, and Proxygen, an L7 proxy that reads HTTP requests, spread traffic across servers. Taiji decides which datacenter serves which users.
3 · Follow-the-sun capacity
2/4Martin Fowler· Martin Fowler· Oct 15
What changed when a software team took over 800,000 battery-powered store sensors
A software team moved a retail sensor network to a new wireless technology without replacing the installed devices. They found that core practices still worked but needed different defaults: hardware labs, device emulators, offline-tolerant design and recoverable updates.
Why it matters · Most of these lessons apply to any fleet you can't easily reach or roll back, like mobile clients, edge nodes or on-prem installs, not only to embedded systems.
Know this first
Context from the editor, not the article · 33 sec
1 · Battery-powered sensor fleets
Retail IoT sensors are small radio devices meant to run for years on one battery. To save power they sleep most of the time and wake briefly to report. A radio connection attempt is one of the most expensive things they do, so they are often unreachable.
2 · Firmware and gateways
Firmware is the software baked into a device's microcontroller. Devices usually don't reach the cloud directly. A local gateway in each store relays their readings up to a central platform and passes commands and firmware updates back down.
3 · Over-the-air updates
3/4Netflix Tech Blog· Netflix Technology Blog· Oct 14
Netflix explains how DataJunction became its central metric-definition layer
Netflix engineers adopted DataJunction, an open-source tool that stores metric definitions as a graph and generates SQL from them. It made adding experiment metrics a self-serve task instead of a weeks-long engineering job.
Why it matters · When teams define the same metric in different ways, their numbers stop matching. This case shows which parts of a metrics platform a small team chose to build first, and why.
Know this first
Context from the editor, not the article · 35 sec
1 · What a semantic layer is
A semantic layer is a shared catalogue of business definitions: metrics such as "hours streamed" and dimensions such as "country". It maps them onto the underlying tables, so every dashboard and analysis gets the same calculation instead of each analyst rewriting the SQL.
2 · Metrics and dimensions
A metric is an aggregated number, such as a sum, count or ratio. A dimension is an attribute you slice that number by, such as date, device or experiment cell. Joining the two correctly takes knowing which tables relate to which, and through which keys.
3 · OLAP cubes
4/4GitHub Engineering· Greg Mohler· Oct 15
How GitHub automated access reviews and repo archiving in a shared org
GitHub built Evergreen, a small app that runs quarterly access reviews and archives stale repositories. Unanswered reviews end with access removed. It uses only stock GitHub features: issues, webhooks, scheduled workflows and JSON files in git.
Why it matters · The design is a small, reusable control-loop pattern: unsafe states get revoked by default, completion is only recorded when every step succeeds, git serves as the audit log, and the system paces itself under API rate limits.
Know this first
Context from the editor, not the article · 31 sec
1 · Outside collaborators
On GitHub, an outside collaborator is someone outside the organization who has been given access to specific repositories. That access stays in place until someone removes it, so finished engagements tend to leave behind people who no longer need access.
2 · GitHub Apps and webhooks
A GitHub App is a bot identity with scoped permissions. It gets webhooks, which are HTTP callbacks sent when events happen, such as an issue closing. Scheduled GitHub Actions workflows can wake an app by firing a repository_dispatch event.
Global services often absorb a spike in one region by sending some of its traffic to regions where it is night and servers are idle. This only works if regional peaks fall at different times. New Year's Eve, for example, moves across time zones over the course of a day.
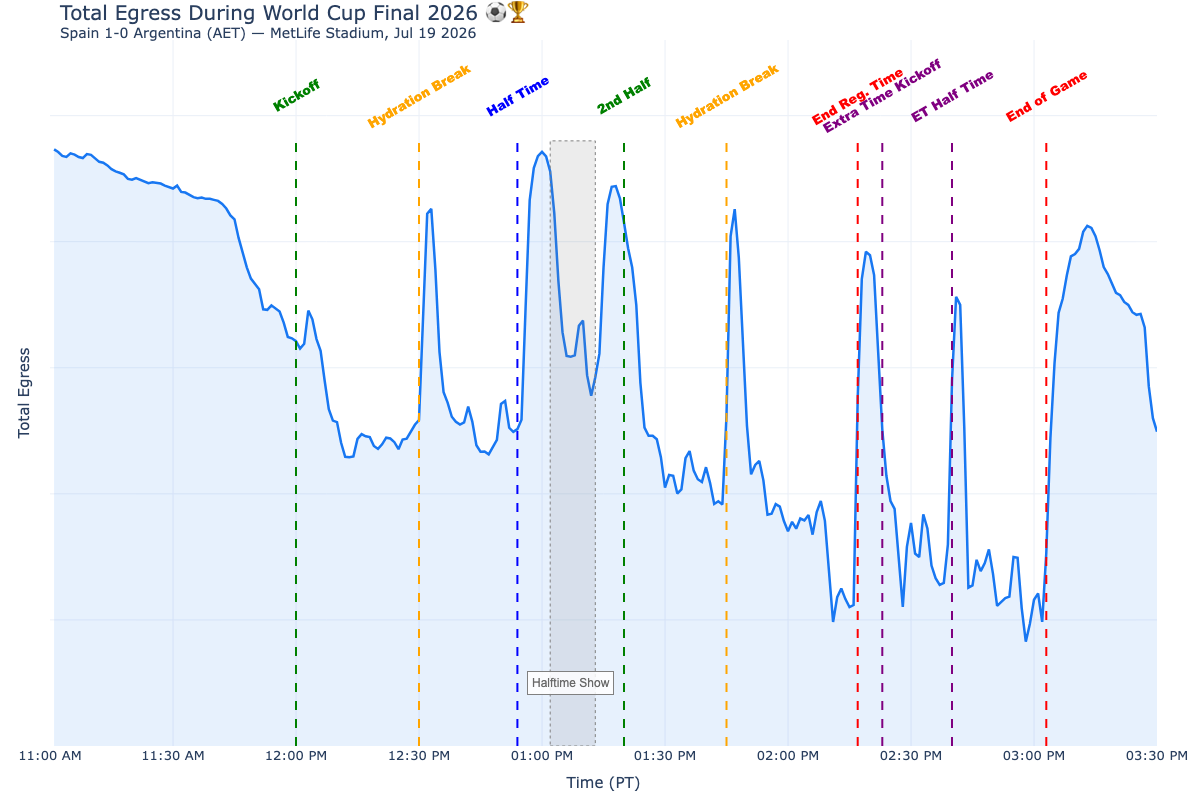
Meta's global egress traffic over the tournament, with peaks matching breaks in play, not goals.1 / 2
Meta's engineering team has reported how its infrastructure handled the 2026 World Cup. At the July 19 final (Argentina vs. Spain), WhatsApp peaked above 30 million messages per second, 1.23× its New Year's Eve 2026 peak and a platform record. The previous record, 29 million per second, had been set only 12 days earlier. In its busiest five-minute window WhatsApp delivered nearly 8.4 billion messages, an average of about 28 million per second. Live-video watch time rose 90% on Instagram and 242% on Facebook.
Spikes came at the breaks
Meta lined up match events against 1 traffic, meaning data sent out to users. The surges came during breaks in play, not during play: halftime, hydration breaks, extra time, the final whistle. The whistle ending regulation time in the final produced the tournament's largest peak, with traffic up 46% in about four minutes. People watch the game, then share when it stops, and they all stop at the same moment.
The stack absorbed this without manual intervention:
2 balances traffic across datacenters.
3, an 4 load balancer, distributes network connections.
5, an 6 proxy, routes HTTP requests.
Global load balancing picks each user's edge site.
Autoscaling adds capacity on demand.
Before the tournament, Meta also worked with internet providers to add network capacity in the regions where it was needed most.
Instagram's four levers
Instagram faced 39 straight days of spikes. It used four measures:
Capacity buffers, added ahead of time so spikes never waited on autoscaling. The team calls this its single most effective lever.
Graceful degradation by country: turning off non-critical background work in the highest-traffic countries during risky matches.
Cascade prevention, to keep serving-layer spikes from reaching downstream data systems.
Early-warning alerts that fired before capacity limits were reached.
These are now a runbook for future events.
WhatsApp broke two habits
More than 100 services were load-tested and resized several times as the tournament went on. WhatsApp also dropped two standard practices:
No cross-region load shifting. Normally, spare capacity in quiet regions absorbs a spike elsewhere. With every region peaking at once there was none to borrow, so each region's peak was forecast and provisioned separately.
No 7. Teams shipped on their normal schedule throughout, including at the peak. Meta credits years of reliability work.
Caveats
The post doesn't give buffer sizes or costs, say which background load was shed, explain how cascades were blocked, or mention any incidents. It is a summary of results, not a detailed postmortem.
Meta's production engineering team has written up how its infrastructure handled the 2026 FIFA World Cup: 48 teams, 104 matches and 39 days of repeated traffic spikes. Several products set records at the same time. The most useful parts are a finding about when the traffic actually arrived, and two standard event-preparation practices that Meta deliberately skipped.
The numbers
WhatsApp handled more than 30 million messages per second during the July 19 final (Argentina vs. Spain). Meta calls this an all-time platform record, 1.23× the New Year's Eve 2026 peak. That implies a NYE peak of roughly 24 million per second, a figure derived here rather than stated in the post. The previous record of 29 million per second had been set only 12 days earlier, during the Round of 16 match Argentina vs. Egypt.
WhatsApp's busiest five-minute window carried nearly 8.4 billion messages. That averages about 28 million per second, so the load stayed close to the peak for the whole window rather than flashing up briefly.
Messenger, Threads and Instagram Direct together peaked at 49 million messages per minute.
Instagram's recommendation-system traffic was up to 80% higher week over week.
Live video watch time rose 90% on Instagram and 242% on Facebook compared with the July baseline.
The post also lists engagement figures: 1.5 billion impressions on Threads, 80 million Facebook posts and 213.6 million new followers for players in the final squads. These describe usage more than infrastructure.
Traffic followed the breaks, not the ball
Meta lined up match events against global 1 traffic, meaning data leaving its network for users. The surges came mostly during breaks in play: hydration breaks, halftime, extra time, the final whistle and the awards ceremony. The whistle ending regulation time in the final produced the biggest peak of the tournament. Traffic rose 46% in about four minutes at that point, and 57% over about 15 minutes after the final whistle.
The team's reading is that people watch during play and share when play stops. Meta says every capacity decision followed from this pattern. It matters because breaks happen on a schedule, and the same break hits every viewer in the world at the same instant.
The serving stack
According to the post, the spikes were absorbed without manual intervention by several layers:
, Meta's system for balancing user traffic across datacenters
Months before kickoff, the edge teams also worked with internet service providers (ISPs) to add network capacity in the specific regions where it would most improve user experience. That capacity stays in place after the tournament.
Instagram: 39 days of surges
For Instagram the challenge was the repetition: 39 straight days of spikes landing on Feed, Stories, Explore, model inference and data infrastructure. During the final, Feed traffic rose 76% above the previous day in the minute the match ended, then stayed about 21% higher for two hours. The post's wording ties this figure to both "halftime" and "the minute the match ended", so exactly when it was measured is unclear.
The approach had four parts, rolled out step by step as the tournament moved from group stage to final:
Capacity buffers. Meta added extra capacity ahead of time across all serving tiers, so spikes never had to wait for autoscaling to catch up. The team calls this its single most effective lever. Autoscaling responds to load after it appears, and a 46% jump in four minutes arrives faster than new capacity can come online.
Country-level 7. For high-risk matches, Instagram turned off non-critical background work in the countries with the most traffic (Brazil, Argentina, India, Indonesia, Spain) to protect core features. The post doesn't say which work was shed.
The phased rollout and the rules for when to switch on degradation are now a runbook, to be reused for events such as the 2028 Olympics.
WhatsApp: two playbook moves it skipped
WhatsApp's spikes lasted four to five minutes, triggered by goals and the final whistle. More than 100 internal services were load-tested and resized before the tournament, then tested and resized again as fewer teams remained and demand grew.
No cross-region load shifting. For past events, WhatsApp's default was to send excess demand to regions with spare capacity. This works when peaks are hours apart, as on New Year's Eve, which moves across time zones. A World Cup final peaks everywhere in the same minute, so no region has idle capacity to lend. WhatsApp therefore stopped estimating regional demand by applying one global multiplier and forecast each region's peak separately. The implication is that each region had to be sized for its own worst case.
No change freeze. Major events usually come with a pause on continuous deployment and on risky operations such as disaster-recovery exercises. This time WhatsApp skipped the freeze. Teams shipped on their normal schedule throughout, including during the peak itself. Meta attributes this to "years of reliability enhancement" but doesn't say which safeguards made it safe.
What to make of it
The judgments worth keeping are these:
Reserved capacity beat reactive autoscaling for spikes measured in minutes.
When peaks happen everywhere at once, capacity can't be borrowed from other regions. It has to exist in each region.
A team confident in its deploy safety may be better off keeping its normal release rhythm than freezing.
The post is light on detail. It doesn't give the size of the buffers or their cost, which background load was shed, how cascades were blocked, or any incidents that did happen. It reads as a record-keeping summary, not a postmortem.
Remember
Load built up in the breaks between moments of play, which every viewer worldwide reached at the same instant.
For spikes that come within minutes, capacity reserved in advance beat reactive autoscaling.
Borrowing capacity from other regions fails when every region peaks at once, so each region needs its own forecast.
OTA (over-the-air) updates push new firmware over the network. A common safe design keeps two firmware slots: the new image is written to the inactive slot and checked, and the device switches only if the check passes. Otherwise it keeps the old slot.
The final architecture: device diagnostics flow through store gateways to fleet-level analytics and operations.
An article on Martin Fowler's site describes a software team modernizing a retail 1 (Internet of Things) system with about 800,000 battery-powered sensors in 3,000 stores. The sensors' wireless technology was reaching end of life. The team had to move to a newer network without replacing installed devices, and also bring new stores online with next-generation hardware.
The team knew cloud and distributed systems but not embedded firmware. The author's conclusion: the principles carried over, but the default practices didn't.
Learning and testing with real hardware
Knowledge of the old system had gaps, and some documentation described behaviour nobody could reproduce. The team built an IoT lab to measure radio behaviour and power draw, and that lab became how they reverse-engineered the system. They then set up a 2, a monitored group of real devices on the new network, so engineers could watch devices sleep, wake and lose connectivity. The author says 3 (test-driven development) and automation still applied, but with hardware in the loop.
Devices that report on themselves
A failing sensor in a distant store has no debugger attached and may be asleep. So the firmware reports its version, health, last contact, network state, events before a failure, and upgrade status. This is readable locally over 4 and 5 (short-range radios) and remotely through the store 6.
Simulating scale
Larger stores revealed that the new network hardware supported far fewer devices than some stores needed. The team built an emulator: firmware that lets one real device pose as hundreds of configurable virtual ones. They also built a virtual store that feeds simulated readings to the platform. Physical testing was still required for radio and hardware behaviour.
Offline, energy and updates
Disconnection is normal. Devices sleep and drop off, and reconnecting is their most expensive operation, so everything was designed around intermittent connectivity.
Energy is a design budget. Power profiling became part of development. In some cases the team chose to reboot devices every 24 hours rather than carefully free memory after every operation.
Recovery is part of deployment. Over-the-air updates use validated downloads, 7 (install to a spare slot, switch only if it checks out), resumable progress after interruptions, and by device, group or store.
The shift
The team's questions moved from "how fast can we ship?" to "can we trust and recover from this?" A fast rollout that leaves thousands of devices unhealthy just creates a large problem quickly. Observability moved to the fleet level, with alerts showing whether a problem was isolated or widespread. The lab, emulator, diagnostics and dashboards ended up as core parts of the system.
The article gives no outcome figures, such as battery life, update success rates or migration time. It also doesn't name either network technology.
An article on Martin Fowler's site describes a team modernizing a large retail 1 (Internet of Things) system: about 800,000 battery-powered sensors across 3,000 stores. The connectivity technology those sensors used was reaching end of life. The team had to move the fleet to a newer network without replacing the devices already installed, while also bringing new stores online with next-generation hardware.
The team knew web, cloud, mobile and distributed systems well. They had little depth in embedded firmware or large device networks. The author's conclusion is that the principles carried over: fast feedback, automation, testing, observability and safe deployment. The default practices did not. The article walks through each default that had to change and the problem that forced it.
Learning a system nobody fully remembered
The first obstacle was knowledge, not writing code. Organizational churn had left gaps in what anyone knew about the existing firmware, hardware and network. Some documentation described behaviour the team couldn't reproduce. So they built an IoT lab with physical sensors, wire harnesses and learning kits, and reused sensors with dead batteries for testing. In the lab they ran radio experiments and measured power draw and network behaviour. What started as preparation turned into the main way they reverse-engineered the system. The author puts it this way: sometimes the fastest answer is to connect the device and watch what happens, not to read another document.
Hardware in the development loop
A normal developer environment is a cloned repository and some dependencies. Here the environment needed physical devices. The team built a 2: a controlled, monitored set of real devices on the new network. Engineers could watch devices communicate, sleep, wake and lose connectivity. Physical placement, radio conditions and power became test variables. The author says 3 (test-driven development), automation and Extreme Programming practices all still applied, but with hardware in the loop.
Devices that explain themselves
A sensor misbehaving in a distant store has no debugger attached and may be asleep or offline. Nobody may be there to open it. The team therefore built diagnostics into the firmware. Each device could report:
its firmware version and health
when it last communicated, and its network state
what happened before a failure
whether it was asleep or stuck reconnecting
the status of any firmware upgrade
This data was readable locally over 4 (near-field communication, tap-range radio) and 5 (Bluetooth Low Energy). It was also readable remotely through APIs via the store 6, and it fed dashboards. The author frames this as an architectural decision rather than an operational add-on, and argues that interfaces for engineers and operators deserve the same design care as interfaces for users.
Scale bugs need simulation
Small stores worked fine. Larger stores showed that the new network hardware supported only a limited number of devices, "far below" what some stores needed. The article gives no exact figure. Message rates, physical layout and disconnection patterns also caused problems that only appeared at scales too costly to build physically.
The team responded with two tools:
A virtual device emulator. This was special firmware for the real device that made one unit pose as hundreds of distinct devices, each configurable to behave differently under various network and environmental conditions. Several emulators running together could reproduce a large store.
A virtual store. A gateway published simulated sensor readings to the platform, so downstream systems could be tested at store scale without hundreds of physical sensors.
Neither replaced real devices. Firmware, hardware and radio behaviour still had to be validated physically.
Disconnection is normal
Enterprise software tends to treat the network as present and outages as exceptions to recover from fast. A battery sensor sleeps when idle, drops connectivity, reconnects repeatedly, and is often unreachable just when the platform wants it. Reconnecting is also its most expensive operation, so retrying aggressively drains the battery. The team designed firmware, gateway messaging, commands, telemetry and device management around intermittent connectivity. The author says many design decisions "became clearer" once unavailability was treated as the normal state.
Energy is a software budget
On a server, waste costs CPU or cloud money. On a sensor expected to last years, it shortens the device's working life. The team added power measurement and profiling to development: how long the device stayed awake, how often it transmitted, and what each operation cost. Even a log statement or code that looked unused could have a physical cost.
One example runs against server instincts. Rather than carefully freeing memory after every operation, in some cases the team let the device run for 24 hours and then reboot as part of its normal cycle. That trades rigorous memory management for a simpler, bounded failure mode.
Deployment and recovery designed together
You can't roll back the battery spent downloading and flashing firmware. A device may go offline mid-update, a download can fail halfway, or an image can fail validation. Some problems only show up after release. The OTA (over-the-air) update system therefore combined:
secure downloads and validation
7: write the new image to a spare slot and switch only when it is valid
targeting by device, group or store, with progress visible through the gateway or locally via NFC
upgrade state stored on the device, so an interrupted update resumes where it stopped instead of starting over
8, so the team could see how updated devices behaved before updating the rest
From speed to confidence
The author describes a shift in the questions the team asked. "How fast can we ship?" gave way to "Can we trust this update? Can we recover? What does it do to battery life? How long will a store take to upgrade?" Speed still mattered. But in the author's words, a fast deployment that leaves thousands of devices unhealthy is "a very efficient way to create a large problem."
Observability also had to move up a level. Nobody can inspect hundreds of thousands of devices one at a time. The team built fleet-level dashboards, analytics and alerts covering communication failures, outages, firmware distribution and anomalies, and these could show whether a problem was isolated or widespread.
The tooling became the system
By the end, the sensor farm, emulator, diagnostic interfaces, gateway and analytics were core parts of the product. Figure 1 in the article shows the resulting chain: device → firmware, diagnostics and configuration → IoT gateway → telemetry, commands and OTA → fleet platform → analytics, alerts and operations. The author also stresses recording discoveries (how the team learned why the system works as it does), not only final decisions. A short note says AI tools were mainly useful for cutting the cost of experiments.
What's missing
The piece is a set of lessons, not a postmortem. It gives no figures on battery life gained, update success rates, migration duration, or the actual device limit of the network hardware. It doesn't name the old or new connectivity technology. It doesn't explain how staged rollouts were gated, for example what health signals stopped a rollout. The author presents the practices as "sensible defaults" learned from problems the team hit, not as a new methodology.
Remember
Scale-only failures, like a network device cap, appeared only in large stores and needed emulation to reproduce.
When rollback is costly, build resumable state, validation and fallback partitions into the update mechanism itself.
Simple can beat rigorous on constrained devices: a daily reboot replaced careful memory cleanup in some cases.
A cube is a long-standing analytics idea: a chosen set of metrics already aggregated across a chosen set of dimensions. Queries can then slice and dice it quickly. Tools differ on the details, but all use cubes to package a subset of definitions for fast access.
Architecture: DJ services sit between the source data and Netflix's access layer, returning SQL or data.1 / 4
Netflix engineers have described how 1 became the metrics layer behind the company's experimentation platform, its A/B testing system. DJ is an open-source 2: a central store of metric and dimension definitions that generates the SQL to compute them.
The problem
Metric definitions at Netflix were scattered and duplicated, as they often are at companies with large analytics teams. In experimentation, adding a metric required business knowledge, familiarity with the conventions of experiment data, and complex engineering workflows. Onboarding a single metric could take weeks. Both the definitions and the computed values were also hard to inspect.
Why DJ
The team compared DJ with Mando, an internal Netflix framework, and 3, Airbnb's open-source semantic layer. DJ stood out for its engine that parses and generates SQL, and for keeping every definition in one connected graph, much as a relational database keeps metadata about its views.
DJ descends from a Facebook project begun around 2015. Users there had to rebuild their metrics every time 4, Facebook's experimentation platform, moved to a new version. Separating metric definitions from the statistics engine solved that, and the project grew into 5. A Facebook engineer started open-source DJ in 2021, and Netflix contributors built it out.
Decisions under scarcity
DJ was an unofficial side project for over two years. The team kept quality high by keeping scope narrow:
API first: the services return either generated SQL with metadata, or the data itself.
Graph engine first: SQL goes in, SQL comes out. Interfaces, caching and visualisation can come later without rebuilding the core.
Here is how that works, as an illustration rather than an example from the article. Define a play-hours metric on a playback table, and link that table's account key to an account dimension that has a country. When someone asks for play hours by country, DJ walks the graph and writes the join itself.
Cubes are the main way clients consume DJ. A 6 is a named bundle of metrics and dimensions. With cubes, connecting DJ to Netflix's Data Explorer was simple. Data Explorer is built on 7, a fast analytics database, and DJ can store cubes directly in Druid. Dashboards that use DJ metrics, including in 8, link back to each metric's definition, so people can debug a number or modify the metric.
What's missing
The post reports no measured results after adoption. "Weeks" is the only before figure, and there are no after figures. It also doesn't cover versioning of definitions or join-correctness safeguards. Next, the team plans to extend DJ from experimentation to general analytics across Netflix.
Three Netflix engineers, Olek Gorajek, Samuel Redai and Yian Shang, have described how 1 became the metrics backbone of Netflix's experimentation platform. DJ is an open-source 2, meaning a central store of metric and dimension definitions. The post is mostly about architecture choices and history, not measurements. Still, it shows clearly how a small, unofficial team decided what to build first.
The problem: metrics nobody could trace
The authors start from a pattern they say is common at data-heavy companies. A fast-moving company with many analysts ends up with metric definitions scattered everywhere, overlapping datasets, and duplicate pipelines. Different departments run under somewhat different rules, which makes the mess hard to consolidate.
At Netflix the pain showed up most in experimentation, the A/B testing system. There, metrics decide whether a change is safe and worth rolling out. The old metrics layer required three things:
extensive business knowledge
familiarity with experimentation conventions and data artifacts, which the team calls "tribal knowledge"
complex engineering workflows
As a result, onboarding one new metric could take weeks. That was too much for the data scientists and analytics engineers who wanted to add metrics. Both the definitions and the values were also hard to inspect, which matters when someone is trying to understand why an experiment came out the way it did.
Why DataJunction
The team compared three candidates:
Mando, an internal Netflix framework
3, Airbnb's open-source semantic layer
DataJunction
The deciding factor was DJ's SQL engine, which can both parse SQL and generate it. During the proof of concept, DJ was also the only open-source option that stored every definition in a connected graph. The authors compare this to how a relational database keeps metadata about its views and queries. They name easy "SQL wrangling" with rich metadata as the feature that won them over.
DJ has a longer history. It descends from a Facebook project started around 2015 by the data science and infrastructure team. The trigger was 4, Facebook's experimentation platform at the time. Each new version of Deltoid forced users to rebuild and repopulate their metrics. Abstracting the metric definitions away from the statistics engine made migrations seamless. That project was renamed 5 and spread across Facebook as a general semantic layer. In 2021 a Facebook engineer, Beto Dealmeida, started the open-source DJ project on GitHub. Netflix contributors expanded it from there, and the three authors plus outside contributors, notably Nick Ouellet, built out the rest.
Architecture decisions under scarcity
The defining constraint was lack of resources. DJ ran as a side project for more than two years, without official support, in the hope that proving its value would win management backing. The team says it chose to cut features rather than quality. Three priorities followed from that.
API first, interfaces later. The core is the semantic layer and the API that serves it. DJ services sit between the underlying data and Netflix's access layer. Depending on what a client asks for, they return either generated SQL with metadata, or the data itself.
A consistent graph first, everything else later. The authors list everything a complete semantic layer could take on:
authoring, managing and monitoring definitions
generating queries
producing data, which needs a query engine
visualisation
caching and materialisation (precomputing and storing results)
integrations with other tools
serving all of this through a UI, APIs, client libraries and other interfaces
They focused on the hardest part: a graph engine that takes SQL in and produces SQL out. Their argument is that everything else can be added later without rebuilding the core.
A worked illustration (not from the article): suppose an analyst defines a metric total_play_hours as a SQL aggregation over a playback table. Separately, they record that the playback table's account_id links to an account dimension carrying country. If someone then asks for total_play_hours by country, DJ can walk the graph from metric to source table to dimension link. It then generates the join and the GROUP BY itself. Nobody writes that query by hand, and every consumer gets the same one.
The article's diagram shows two kinds of edges in the graph. Dotted lines trace how data flows from sources to metrics. Solid lines record which dimensions can be joined to what.
Cubes as the consumption protocol. DJ makes 6 first-class objects. A cube here is a named bundle of shared metrics and dimensions. The team gives two reasons: users already understand cubes, and cubes deliver both the definitions and fast data access. Creating a basic cube is meant to be simple. Integrations followed from there. Netflix's internal Data Explorer tool runs on 7, a real-time analytics database, and connecting it to DJ became "trivial". DJ can also materialise cubes directly into Netflix's Druid clusters.
Links back to the definition
The authors highlight one integration in particular. Any metric that comes from DJ can link back to its definition. A dashboard showing DJ metrics, whether in Netflix's own tools or in the open-source 8, lets a viewer jump to the source definition. From there they can debug the number or fork the metric for ad-hoc analysis. This closes the loop that the old experimentation tooling lacked: you can see both what a number means and how it was computed.
Results and what's missing
For experimentation, DJ now serves as the central place to define, share and explore metrics. It offers a UI, an API and client libraries. The post gives no figures after adoption: no onboarding times, metric counts, query latencies or user numbers. The only "before" figure is that onboarding took "weeks". Readers should treat the improvement as claimed, not measured.
The post also leaves several questions open:
how the generated SQL handles correctness traps such as fan-out joins, where a join multiplies rows and inflates sums
how definitions are versioned when a metric changes underneath existing dashboards
how conflicting definitions across departments get settled, which the authors themselves call the hard organisational part
What's next
The authors want to extend DJ from experimentation to general analytics across Netflix. The goals are to let people find metric definitions across business areas, and to access, modify and experiment with them anywhere in the data stack. They describe the integration work as mostly connecting systems that already exist through structured exchange. They also mention that a definitive metric graph lets internal tools answer questions about how business metrics are defined.
Remember
DJ won because it could both parse and generate SQL over a connected graph of definitions, not because of its UI.
With few resources, the team built the core engine and API first and left interfaces and caching for later.
The post gives no measured results after adoption; the only figure is that onboarding a metric used to take weeks.
IssueOps means using GitHub issues as the interface for an operational process. A bot opens an issue, a human acts on it by ticking checkboxes, commenting or closing it, and the bot responds to that action through webhooks.
An access review issue: tick the collaborators who keep access, then close the issue.1 / 2
GitHub runs a shared organization where its employees ("Hubbers") work with customers and partners on trials and consulting engagements. The org has more than 1,400 Hubbers plus many outside collaborators. Over time, old access and abandoned repos pile up. Greg Mohler describes Evergreen, the 1 (a bot with scoped permissions) the team built to clean this up automatically.
What it does
Evergreen runs two quarterly workflows. Access reviews ask each repo's owners which outside collaborators should keep access, and everyone else is removed. Stale-repo detection warns about repos with no human activity and archives them if they stay idle.
It follows two rules. Fail secure: if nobody answers a review, access is revoked. Never destroy: repos are archived, never deleted, and every change is logged where it can be undone.
How it fits together
Evergreen is a small Go 2 server. Everything else is a standard GitHub feature. A controller repo runs four scheduled workflows that wake the app through repository_dispatch events:
day 1: flag stale repos
day 8: open access reviews
day 16: archive repos still stale
day 23: revoke access on unanswered reviews
Each review gets two weeks before cleanup, and a hard-coded grace period stops a stray manual run from skipping ahead.
Each repo's state is a JSON file committed to the controller repo. It records who had access, the deadline, who decided, and the outcome. Because the state is in git, git log doubles as the audit trail.
The review itself is an issue in the repo with one checkbox per collaborator. The owner ticks who stays and closes the issue. Evergreen receives the issues.closed webhook, applies the choices, and posts a comment listing who was kept and who was removed. If someone who isn't a Hubber closes the issue, Evergreen reopens it. Owners are found through a custom property, or failing that, from recent commit and issue authors.
Partial failures
When some removals succeed and others hit temporary API errors, Evergreen 3. The review stays pending and the next run retries the remaining removals. It records "revoked" only when every removal has succeeded.
Rollout and rate limits
The team ran a DRY_RUN mode against the real org first, announced the change repeatedly, and sent structured logs to Splunk. That surfaced edge cases such as repos with issues disabled. GitHub's 4 on creating content (80 requests per minute, 500 per hour) shaped the design. Evergreen works in batches with deliberate gaps between calls instead of backing off after hitting errors.
The trade-off is that ignored reviews remove access people still needed, which the design accepts because the issue lists exactly who to re-add. The article gives no numbers on repos archived or access revoked.
GitHub runs a shared organization where its employees ("Hubbers") work with customers and partners on product trials and professional-services engagements. The org has more than 1,400 Hubbers and many more outside people. Each engagement leaves cleanup work behind: checking who still needs access, changing permissions, and archiving repositories once the work is done. In a post on the GitHub Engineering blog, Greg Mohler describes Evergreen, the 1 the team built so this housekeeping happens automatically.
Two workflows, two rules
Evergreen does two jobs:
Outside collaborator access reviews. Every quarter, each repository's outside collaborators are reviewed. The people someone chooses to keep stay, and everyone else is removed.
Stale repository detection. Repos with no human activity past a threshold get flagged and warned. If they are still untouched after that, they are archived.
Two principles shaped the design. The first is fail secure: if nobody answers a review, access is revoked rather than left in place. The second is never destroy anything: Evergreen never deletes a repository, archived repos can be restored, and every access change is written into a tracking issue so it can be reversed.
The architecture: one controller, many repos
Evergreen is a small Go 2 server running in a container. Everything around it is a standard GitHub feature: a GitHub App (a bot identity with scoped permissions), scheduled GitHub Actions workflows, webhooks, issues, 3 (key-value metadata attached to repos), and plain files in a repo.
A dedicated controller repo handles both timing and state. Four scheduled workflows send repository_dispatch events, which are custom triggers that wake the app, on a quarterly calendar:
Day
Workflow
Action
1st
Stale repo review
Flag inactive repos, open a warning issue
8th
Access review
Snapshot outside collaborators, open a checklist issue per repo
16th
Stale repo cleanup
Archive repos still stale after the grace period
23rd
Access cleanup
Revoke access for any unanswered review
Each review opens two weeks before its cleanup runs. A hard-coded grace period means a stray manual run cannot skip a review straight to removal. Every step can also be triggered by hand through workflow_dispatch.
State as files in git
Each repository's status is stored as one JSON file in the controller repo, at state/repos/<repo_id>.json. The file records which collaborators had access when the review opened, the deadline, the status (for example renewed), which logins were kept, who decided (decided_by) and when, and a pointer to the tracking issue. A separate staleness block tracks last activity, warning time and archive deadline.
Because the state lives in git, the commit history is the audit trail. To find out why someone lost access last spring, you run git log on that repo's file. There is no separate database and no separate audit pipeline. The article doesn't say how Evergreen handles two writes to the same state file at once. With one file per repo and a single server, that conflict may rarely happen.
The interaction: check boxes, close the issue
When a review starts, each repo gets an issue titled something like "[ACTION REQUIRED] Access Review – 2026-04-13". It lists each outside collaborator and their permission level next to an unchecked box. The owner ticks the people who should stay and closes the issue. Evergreen receives the issues.closed webhook, reads the checkboxes, keeps the checked people, removes the rest, and posts a comment listing exactly who was kept and who was removed.
Worked example (from the article's sample state): Alice has admin access and Bob has write access on acme-trial. Carol, a Hubber, ticks Alice and closes the issue two days after it opened. The state file records renewed_logins: ["alice"] and decided_by: carol-hubber. Bob loses access. Had nobody responded by the deadline, both would have been removed on cleanup day.
Closing the issue is a privileged action. If someone who isn't a Hubber closes it, Evergreen reopens it and posts a note explaining why. Only decisions from authorized people count.
To decide whom to notify, Evergreen uses a fallback chain. If the repo has an evergreen_repo_owner custom property naming a user or team, it uses that. Otherwise it looks at recent issue and commit authors and cc's those who belong to the access-review team. Nobody has to maintain a spreadsheet of who owns which repo.
Failing closed on partial errors
The most careful piece of the design deals with partial failure. When cleanup revokes a snapshot of collaborators, some removals may succeed while others hit a temporary API error. Marking the review "done" in that case would let the recorded state drift from what is actually true. So Evergreen 4: if any removal fails, the review stays pending and the issue stays open, and the next run retries the remaining removals. The status becomes "revoked" only after every removal has succeeded. Since removals are idempotent (repeating one has no further effect), retrying is safe. Everything removed is listed in the issue, so restoring access means re-adding those handles.
Rollout
The team wanted the first live run to be uneventful. They used four practices:
Owners also get a reminder comment before each deadline. They can opt a repo out with evergreen_exempt_from_access_review or evergreen_exempt_from_archive.
Trade-offs and open questions
Failing secure means any review that gets ignored removes access people actually needed. The design accepts that cost because recovery is cheap: the removed handles are listed in the issue and can be re-added. Making the default safe only works if responding is easy enough that the default rarely fires. Building on standard primitives avoids custom UI, a job queue and an audit database. In exchange, the system inherits GitHub's limits: issue-based workflows cannot reach repos with issues disabled, and the rate limits set the throughput. The article gives no figures on how many repos were reviewed or archived, how many reviews went unanswered, how much access was revoked, or how long a full cycle takes.
Remember
Record an operation as complete only when every sub-step has succeeded; leave partial failures pending and retry them.
Per-entity JSON state files in git give you an audit trail through git log, with no separate database.
At org scale, rate limits set throughput, so pace calls in advance rather than backing off after errors.
3, its 4 load balancer, which distributes network connections
5, its 6 proxy, which routes HTTP requests
a global load-balancing system that sends each user to the best-placed edge site
AutoScaling, which adds capacity on demand
Cascade prevention. Spikes in the serving layer were kept from spreading into downstream data systems. The post gives no mechanism. Common techniques include queues, rate limits and backpressure, but which ones Meta used is unstated.
Early-warning signals. Alerts fired as services approached capacity thresholds, before they crossed them.
8
Dry run. A DRY_RUN mode logs every write Evergreen would make without changing anything. They ran it against the real org until they trusted its decisions.
Repeated announcements. The team told people what was coming several times. Mohler notes that by the seventh repetition, many people are still hearing it for the first time.
Structured logs. Evergreen writes 5 logs (one line of key=value pairs per event) to a dedicated Splunk index. This exposed edge cases such as empty collaborator lists, unusual permissions, and repos with issues turned off.
Pacing under rate limits. Opening issues across a large org runs into GitHub's 6 on content creation: 80 requests per minute and 500 per hour. Evergreen works in batches, spaces each content-creating call by a couple of seconds, and sleeps between batches so the rolling window can clear. Only repos that actually produce content count against the budget, so a quarter with nothing to do still runs quickly. The team chose to stay under the limits rather than react to errors with back-off.