Data Centers Join the Grid's Risk List · Morning Gist
Friday, October 165 stories · 16 min
Data Centers Join the Grid's Risk List
Grid regulators move to treat data centers as a reliability risk, September's price dip turns out to be one credit, and nature targets lag badly.
Picked from 31 new articles across 13 sources · arrow keys for other days
Today in 30 seconds
30s left
US electricity prices fell 2% in September only because of a California bill credit; average monthly bills still rose from $173 to $180. story 1 ↓
ON.Energy's battery buffer between data centers and the grid passed national-lab tests and landed a 5 GW order from Crusoe. story 2 ↓
A UN review finds countries off track on 22 of 23 nature targets; finance goals score worst ahead of COP17 in Armenia. story 3 ↓
RMI estimates 109 million US homes could adopt heat pumps on today's grid, using spare winter capacity built for summer peaks. story 4 ↓
Industry approved NERC reliability rules for data centers and crypto miners of 50 MW or more; NERC's board and FERC decide next. story 5 ↓
The US trade commission ruled that solar cell imports from India, Indonesia and Laos hurt US makers, clearing the way for final duties.
1/5Heatmap· Matthew Zeitlin· Oct 15
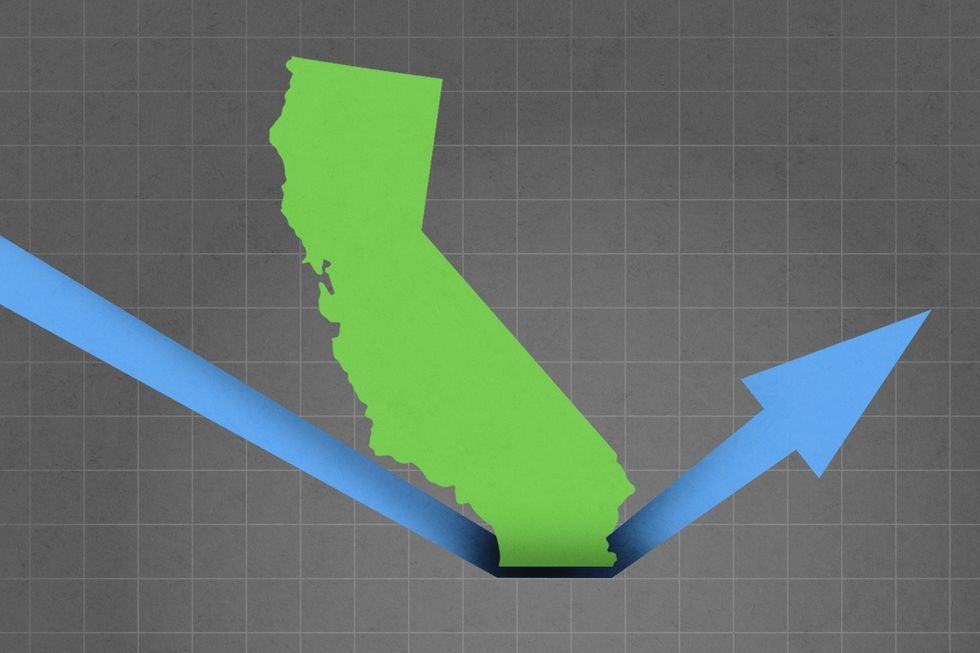
US electricity prices dipped 2% in September, mostly because of one California credit
Average US retail electricity prices fell from 20 to 19.6 cents per kilowatt-hour year over year. MIT researchers say California moving its bill credit into September explains most of the drop. Bills kept rising.
Why it matters · One headline price can hide a one-off policy change. This shows why a monthly average needs checking against bills, state-level data and how the number is calculated.
Know this first
Context from the editor, not the article · 31 sec
1 · California Climate Credit
California sells pollution permits under its cap-and-trade program. Part of the money goes back to households as a credit on their utility bills a couple of times a year. That lowers the effective price paid in the months the credit lands.
2 · Price versus bill
Retail price is the cost per kilowatt-hour. The bill is that price multiplied by how much electricity a household uses. In summer, air conditioning drives use up, so bills can rise even when the price per kilowatt-hour stays flat or falls.
3 · The Electricity Price Hub
Heatmap and the Massachusetts Institute of Technology (MIT) run a tracker of US retail electricity prices and bills, updated monthly, both nationally and by state. The article does not describe how the tracker calculates its averages.
2/5Canary Media· Jeff St. John· Oct 15
Startup's battery shields data centers and the grid from each other
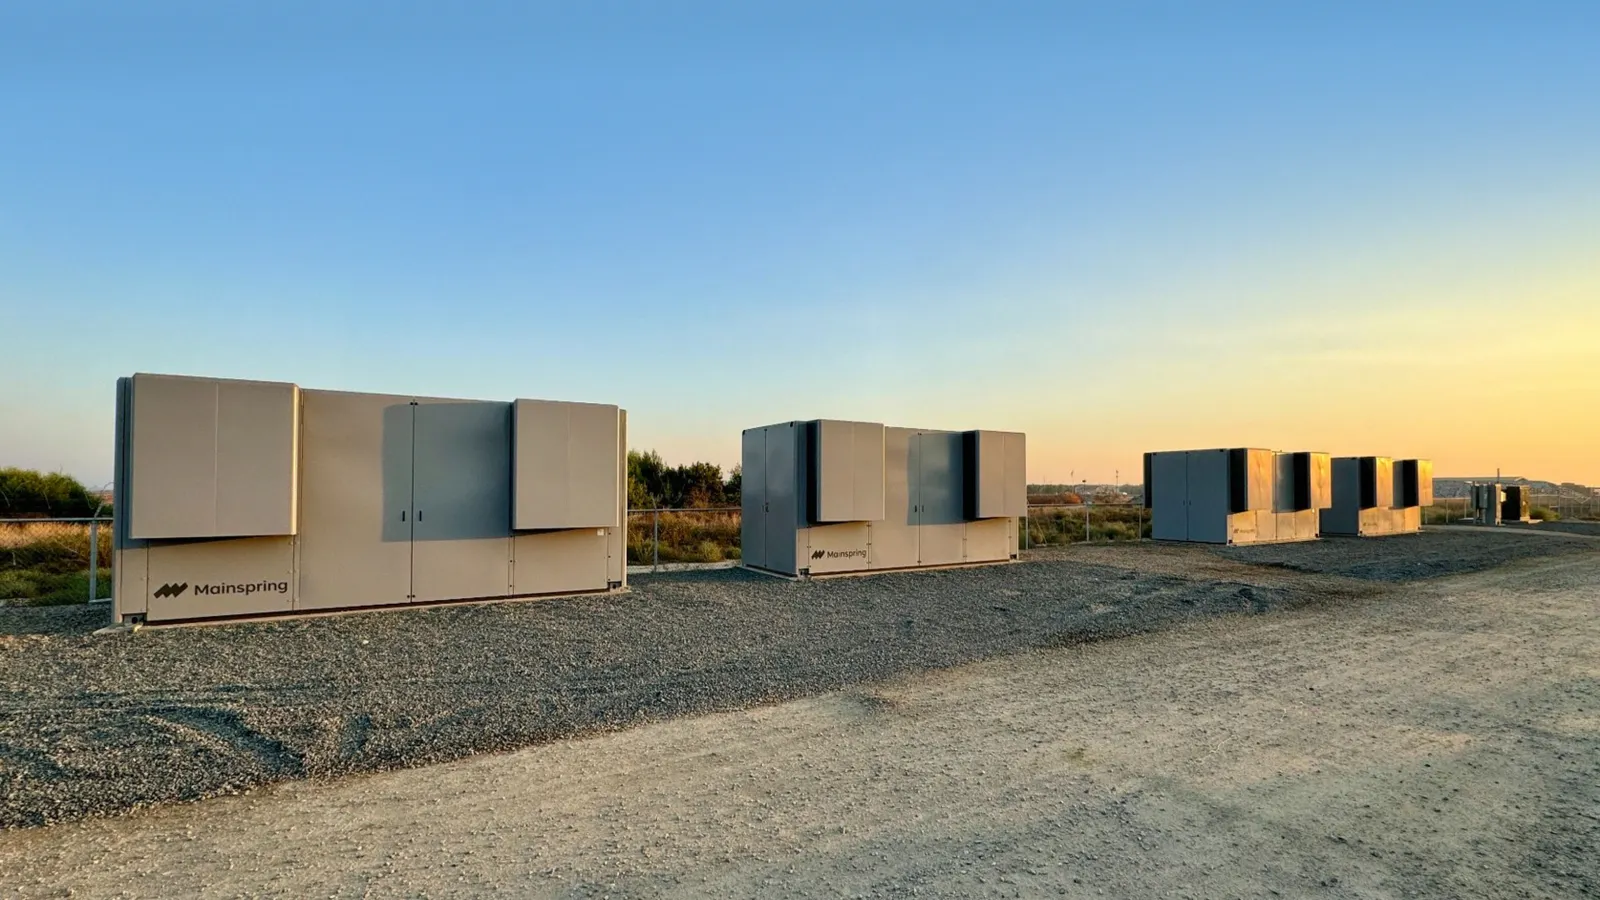
ON.Energy built a large lithium-ion battery that sits between the grid and a data center. The grid sees a steady load, and the servers get clean power. National-lab tests passed, and Crusoe ordered 5 gigawatts.
Why it matters · Data centers suddenly dropping several gigawatts of load have become a real threat to grid stability, and grid operators are starting to write rules that address it.
Know this first
Context from the editor, not the article · 28 sec
1 · What a UPS does
An uninterruptible power supply (UPS) is a battery bank that keeps servers running through brief flickers or outages until generators start. Data centers have used them for decades, mostly lead-acid, and they sit idle otherwise.
2 · Why grids need balance
Grid operators must match supply and demand second by second. A sudden large loss of load or generation shifts frequency and voltage, and if nothing corrects it, protective equipment can trip and failures can cascade across a region.
3 · Ride-through rules
Grid operators already require big wind and solar farms to ride through brief voltage disturbances instead of disconnecting. Data centers are now large enough that operators are starting to ask the same of them.
3/5Carbon Brief· Carbon Brief Staff· Oct 15
UN review finds countries behind on 22 of 23 global nature targets
Before the COP17 biodiversity summit, a UN progress report finds countries behind on 22 of the 23 nature targets they agreed for 2030. Finance and subsidy reform score worst, and patchy national data limits every judgement.
Why it matters · Nature targets overlap with climate policy on land use, restoration and finance, and this is the first official check on whether the 2022 deal is being carried out.
Know this first
Context from the editor, not the article · 29 sec
1 · The biodiversity treaty
The UN Convention on Biological Diversity is the nature counterpart of the climate convention. Its member countries meet at regular summits, called COPs, to set and review shared goals on species, ecosystems and the money to protect them.
2 · The 2022 nature deal
In 2022, 196 countries adopted the Kunming-Montreal Global Biodiversity Framework. It sets 23 targets for 2030, including protecting 30% of land and sea, and four goals for 2050. The aim is to halt and reverse nature loss.
3 · How progress is tracked
Each country turns the global targets into its own national targets and reports on them, often using standard indicators. Most of the evidence is self-reported, so if a country reports little data, its progress is hard to judge.
4/5Grist· Matt Simon· Oct 15
Report: 109 million US homes could switch to heat pumps on today's grid
A new report from the energy think tank RMI says that because most US grids are sized for summer air-conditioning peaks, about 109 million homes could switch to heat pumps without new power plants.
Why it matters · Fear of grid strain is one of the main arguments against electrifying heating. If spare winter capacity really absorbs that load, switching to heat pumps could push power rates down instead of up.
Know this first
Context from the editor, not the article · 28 sec
1 · How heat pumps heat
A heat pump uses a refrigerant cycle to move heat from outdoor air into a home, rather than making heat by burning fuel or heating a wire. Running the cycle in reverse cools the home, the same way an air conditioner does.
2 · Grids are built for peaks
Utilities size power plants and wires for the highest demand of the year. In most of the US that peak comes on hot summer afternoons when air conditioners run, so much of that capacity sits idle in winter.
3 · Who RMI is
RMI, formerly the Rocky Mountain Institute, is a US nonprofit think tank that researches clean energy and buildings. It publishes analyses aimed at policymakers and utilities.
5/5Utility Dive· Robert Walton· Oct 15
Grid reliability rules for big data centers and crypto miners pass industry vote
Industry stakeholders of the North American grid watchdog approved the first reliability rules written for large AI and crypto computing loads. The rules require site data, modeling and direct communication with grid operators.
Why it matters · Data centers lead the forecast 224 GW rise in peak demand. These would be the first enforceable rules to treat a large electricity customer as a grid-stability risk.
Know this first
Context from the editor, not the article · 31 sec
1 · What NERC does
The North American Electric Reliability Corp. writes mandatory reliability standards for the high-voltage grid in the US, Canada and part of Mexico. The Federal Energy Regulatory Commission (FERC) must approve them, and violations can bring fines.
2 · Why loads can be a risk
Grid rules were mostly written for power plants. Loads were assumed to be many small customers whose demand averages out. A single data center can draw as much as a small city, and it can switch that demand on or off within seconds.
3 · The incidents behind this
In one known case in July 2024, about 1,500 MW of Northern Virginia data centers switched to backup power together during a brief fault on the grid. Operators had to rebalance the system quickly to keep frequency stable.
US retail electricity prices fell year over year in September for the first time since September 2023. The national average went from 20 cents per 1 (kWh) in September 2025 to 19.6 cents, about 2% lower. The figures come from the 2, a tracker run by Heatmap and the Massachusetts Institute of Technology (MIT).
Matthew Zeitlin's assessment at Heatmap: don't read much into it.
The California effect
Most of the drop comes from the 3, a rebate on utility bills paid for by the state's sales of carbon-pollution permits. California used to pay it in April and October. This year it moved the payments to August and September, usually among the grid's highest-demand months. A large state cutting bills in September drags down the national September average. The MIT researchers estimate that without the credit, prices would have been roughly flat.
Bills kept rising
The average monthly bill was about $180 in September, up from $173 a year earlier, though below July's all-time high of $217. Average bills have risen over the past year in 45 states and Washington, D.C. A bill is price multiplied by usage, so a slightly cheaper kWh doesn't help if households use more power.
Federal data also points upward. The Bureau of Labor Statistics' 4, the main US inflation measure, shows electricity up 4.4% year over year. Overall inflation was 3.7%, driven mostly by gasoline. The article doesn't explain why this differs from the Hub's 2% decline.
Hot spots
The biggest increases are in the Northeast and mid-Atlantic:
New York: 31.5¢/kWh, up from 27¢ a year ago (about 17%).
Maine: just under 40¢, up from 31¢ (about 29%). Maine sits at the end of New England's thin natural gas pipeline network. Its 5, who represents ratepayers, blames mainly gas prices and the cost of repairing storm-damaged power lines, and to a lesser extent subsidies for renewables.
Ohio: just over 20¢, up from 18¢. Average bills rose from about $129 to $162 a month.
Energy costs have become a midterm campaign issue in states including Maine and Ohio, especially since the war in Iran drove oil prices up.
What to watch
California no longer pays a credit in October, which could make next month's national comparison look worse. The 2% "decline" came from a change in payment timing. Underlying prices were flat, and bills rose almost everywhere.
The headline number
The latest update to the 1, a tracker run by Heatmap and the Massachusetts Institute of Technology (MIT), shows the national average retail price of electricity falling year over year. It went from 20 cents per 2 (kWh) in September 2025 to 19.6 cents in September 2026, a drop of about 2%. This is the first year-over-year decline since September 2023.
Matthew Zeitlin's verdict at Heatmap is that the decline says little about where national prices are heading. Most of it comes from a change in when one state pays out a rebate.
What California changed
California runs a 3 program: polluters must buy permits to emit, and the state auctions those permits. Part of the auction revenue goes back to households as the 4, a line item that reduces their utility bills. The state used to pay the credit in April and October. This year it moved the payments to August and September, which have historically been among the months of highest demand on the grid, when air-conditioning load pushes bills up.
California is a large market, so a credit landing in September pulls the national September average down. The MIT researchers estimate that without the credit, average prices would have been roughly flat year over year. The credit helps California ratepayers when they need it most. It doesn't mean electricity got cheaper across the country.
Bills still went up
Bills rose even as the per-kWh price fell. The average monthly bill was about $180 in September, up from $173 a year earlier. That is below this year's all-time high of $217 in July, but higher than last year. Forty-five states and Washington, D.C., have seen average bills rise over the past year.
A bill is price multiplied by usage, so a cheaper kWh and a bigger bill can both be true if households used more electricity. Dividing bill by price gives a rough, illustrative check: about 865 kWh last September and about 920 kWh this September. That is roughly 6% more use. This is only a sketch, since the Hub's national averages may not be built in a way that allows a clean division, and the article doesn't break the change down.
A second data source disagrees
The Bureau of Labor Statistics (BLS), which compiles the 5 (CPI), tells a different story. Its September figures show electricity prices up 0.2% from August and 4.4% from a year earlier. Overall consumer prices rose 0.6% for the month and 3.7% for the year, driven mostly by gasoline. By the federal measure, electricity is rising faster than inflation in general.
The article doesn't explain why the Hub shows a 2% decline while the CPI electricity index shows a 4.4% rise. The two series measure different things in different ways, and they may treat a bill credit differently. Treat the 2% figure with caution until that is clear.
Where prices are climbing fastest
The steepest increases remain in the Northeast and mid-Atlantic.
State
Sept 2025 (¢/kWh)
Aug 2026
Sept 2026
Year-over-year change
New York
27
30
31.5
about +17%
Maine
31
37
just under 40
about +29%
Ohio
18
—
just over 20
about +11%
(Percentages are computed from the article's rounded figures.)
Maine sits at the far end of New England's limited natural gas pipeline network. Gas sets much of the region's power price, so supply constraints show up quickly in bills. Maine's 6, the state official who represents ratepayers, has blamed years of increases mainly on natural gas prices and distribution costs, especially repairs to storm-damaged poles and wires. Subsidies for renewables play a smaller role, according to the advocate. The article gives no breakdown of how much each factor contributes.
In Ohio, the average monthly bill rose from about $129 to $162 over the year, roughly 26%. That is more than double the rise in the per-kWh price, which again points to higher usage or a shift in the fixed parts of the bill. The article doesn't say which.
The political backdrop
Energy costs have become a campaign issue in several midterm battlegrounds, especially since the war in Iran pushed up oil prices. Zeitlin points to Maine and to Ohio's Senate race, where Democrat Sherrod Brown is challenging Republican incumbent Jon Husted. Brown leads by about 4 points in Nate Silver's polling average, and early voting began this month. The article doesn't claim that electricity prices are moving the race.
What stays unclear
The piece is a short monthly update, and it leaves several questions open:
Why the two measures differ. The Hub shows prices down 2%; the BLS shows them up 4.4%.
What October will look like. California used to pay a credit in October and now doesn't. That could push next month's national comparison the other way.
What is driving the increases. For the steepest regional rises, the article doesn't separate fuel costs, grid repair and expansion, and policy charges.
The main point is that a one-time, one-state timing change produced the first national price decline in three years. Underlying prices were flat at best, and bills kept rising nearly everywhere.
Remember
Moving one state's rebate to different months can create a national price 'decline'. Excluding the credit, prices were flat.
Per-kWh prices fell, but average bills rose from $173 to $180 because bills also depend on how much power households use.
Maine's prices rose about 29% in a year, driven by gas prices and storm-repair costs at the end of a thin pipeline network.
ON.Energy's AI UPS battery array being set up for testing at the National Laboratory of the Rockies in Colorado.
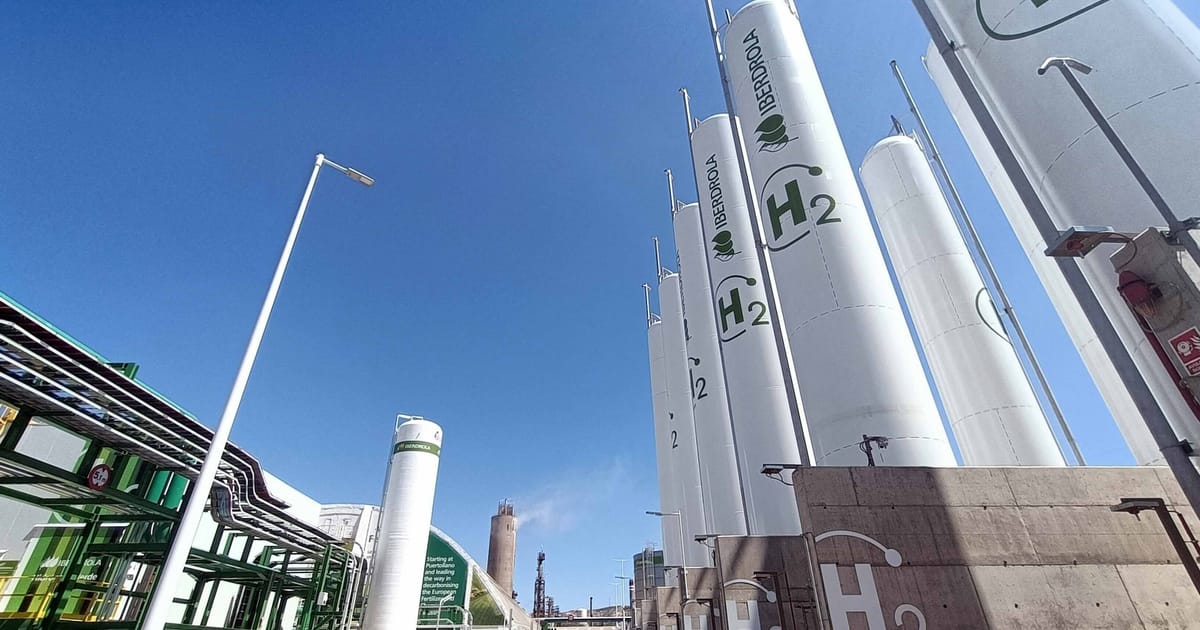
Startup ON.Energy has built a battery system called AI 1 that sits between the grid and a data center campus. It is meant to shield each side from the other. The system finished multi-megawatt trials earlier this year at the 2, the national lab formerly called NREL. AI data center developer Crusoe has ordered 5 gigawatts of it. The article doesn't say whether that figure means battery capacity or the size of the campuses it will serve.
The problem
Data centers have long used an uninterruptible power supply (UPS), a bank of mostly lead-acid batteries that bridges outages until generators start. Otherwise it sits idle. That is one reason operators have been slow to add more on-site batteries: they want a clear payback first.
Grid operators now have reasons of their own to want something better. Shahil Shah, who runs the lab's grid simulator, says AI workloads can push a data center's power draw "from 5% to 100% in a few milliseconds." Data centers are also sensitive to voltage disturbances. A brief wobble can make many of them switch to backup at once, and huge amounts of demand vanish. 3, the grid operator covering much of the mid-Atlantic, saw nearly 4 gigawatts of Virginia data center load disconnect in July. Losing load that fast throws frequency and voltage out of balance. Operators already require wind and solar farms to 4 such disturbances, and Shah says they are now drafting similar rules for data centers.
How it works
ON.Energy uses what CEO Alan Cooper calls patented "5" technology. Grid AC power is converted to DC to charge lithium-ion batteries, then converted back to AC for the servers. The servers never connect to the grid directly. "The grid sees a battery that's always charging, and the load sees a battery that's always outputting perfect quality power," Cooper said. The system combines a grid-scale battery energy storage system (6) and a UPS in one asset. Load spikes are absorbed by the battery, and grid disturbances never reach the servers.
It can't be added to existing sites. Campuses must be designed for it. At one Crusoe site, the newest building has land set aside for the batteries.
What's next, and what's missing
Cooper argues that once the battery pays for itself as backup, other uses come cheaply: cutting peak demand, storing surplus renewable power, or running the data center from its multi-hour battery when the grid is stressed. Rivals exist too. The lab is also testing a similar system from Prevalon Energy.
The article gives no test results, costs, or conversion-loss figures. The Crusoe deployment will be the first real proof at scale.
Startup ON.Energy says it has a new way to connect large data centers to the grid. Its product, called AI 1, is a centralized lithium-ion battery placed between the utility connection and the computing campus. Earlier this year it finished multi-megawatt trials at the 2, the national lab formerly called the National Renewable Energy Laboratory (NREL). It now has a 5-gigawatt order from Crusoe, a developer of AI data centers. The article doesn't say whether that figure means power capacity or the total size of the data centers it will serve. Either way, this would be the system's first commercial-scale test.
Two problems, one box
Data centers already use batteries. An uninterruptible power supply (UPS) is a bank of batteries, usually lead-acid, that keeps servers running through brief grid flickers or outages until backup generators start. Like the generators, a UPS earns nothing in normal operation. That helps explain why on-site batteries have been slow to catch on in the industry. Developers tend to see fossil generation as more reliable for round-the-clock power, and industry watchers say operators won't add batteries without a clear payback or a requirement they can't avoid.
A requirement may be coming. Shahil Shah is chief engineer at the lab and runs the grid simulator that tested ON.Energy's system. He says data centers cause grid operators two separate problems.
Fast load swings. Power draw follows computing activity, and AI workloads can move "from 5% to 100% in a few milliseconds. You're hammering the grid if you do that," Shah said.
Sudden mass disconnection. Data centers are sensitive to power quality. When grid voltage wobbles, their equipment can switch to UPS and generators at once, and gigawatts of demand disappear without warning. 3, the grid operator covering much of the mid-Atlantic and Midwest, has recorded several multi-gigawatt drop-offs in recent years. In one this July, nearly 4 gigawatts of data center load in Virginia disconnected. Losing that much load at once pushes frequency and voltage out of balance, and in the worst case a region-wide collapse can follow.
Grid operators already require large wind and solar farms to 4 voltage disturbances instead of tripping offline. Shah says many operators are now drafting similar rules for "large loads" such as data centers.
How the system works
ON.Energy's main technique is what CEO and cofounder Alan Cooper calls patented "5" technology. Double conversion is a standard design in smaller online UPS units. Incoming AC power is converted to DC, which charges the battery, and then converted back to clean AC for the load. Because the load always runs from the inverter output, never directly from the grid, the two sides are electrically decoupled. Cooper says ON.Energy applies this at utility scale with "the fastest-response, best-in-class inverters in the market." The article doesn't detail what the patent covers beyond that principle.
Cooper's summary: "The grid sees a battery that's always charging, and the load sees a battery that's always outputting perfect quality power." In practice, he says, the system merges 6 (battery energy storage system, the industry term for grid-scale batteries) and UPS into one asset.
A rough analogy: the battery works like a reservoir between a river and a town's water mains. The town's demand can spike or stop suddenly, but the river only sees a steady intake pipe. When the river runs muddy, the town keeps drawing clean water from the reservoir. For the utility, Cooper says, the result is "a really predictable utility-scale battery that just sits and takes power from the grid." Fast swings in AI workloads are absorbed on the battery side. A grid disturbance no longer trips the load off, because the load was never directly connected.
The catch: it has to be planned in
This isn't a retrofit. Data centers must be designed around the system from the start. Cooper showed aerial photos of a Crusoe campus under construction. The earliest buildings have a central building for traditional UPS equipment. The newest building sets aside land to one side for the AI UPS batteries. Moving to a centralized battery means changes to the site layout, not just new equipment.
Other uses
Cooper argues that once the battery has paid for itself as backup and grid shock absorber, other uses are easier to justify. These include cutting the site's peak demand and storing surplus solar or wind power to use later. Because he describes the battery as having "multi-hour duration," the data center could also be 7, meaning cut off from the grid and run from the battery, when the grid is stressed. "It's kind of a natural way to get data center flexibility," he said. That matters because flexible demand is one of the main ways grid planners hope to fit new data centers onto crowded grids without building new power plants just for peak hours.
Who else, and what's unproven
ON.Energy has competitors. Shah's lab is also testing a similar system from Prevalon Energy, plus others he can't name yet. That suggests "battery as grid interface" is turning into its own product category, not one company's idea.
Several questions stay open in the article. It reports that the lab trials showed the technology works but gives no test results, such as response times, ride-through performance or efficiency. Double conversion has a cost: every kilowatt-hour passes through two conversion stages, and the article gives no figure for those losses. Costs and battery durations aren't disclosed. The Crusoe order is the real test. It will show whether the system works at gigawatt scale, and whether grid operators' new large-load rules make it a requirement instead of an option.
Remember
Sudden data center disconnections, such as nearly 4 GW in Virginia in July, now threaten grid stability.
Double conversion means the grid sees a steady charging battery, not volatile AI server loads.
Pitched first as required backup, the battery could then add flexibility, such as peak shaving and renewable storage.
Countries are meeting in Armenia from 19 to 30 October for 1, the first global review of the nature targets they agreed in 2022. A UN progress report prepared for the summit finds them falling short on 22 of the 23 targets for 2030. It warns the goals will be missed unless action "accelerates rapidly".
The deal being checked
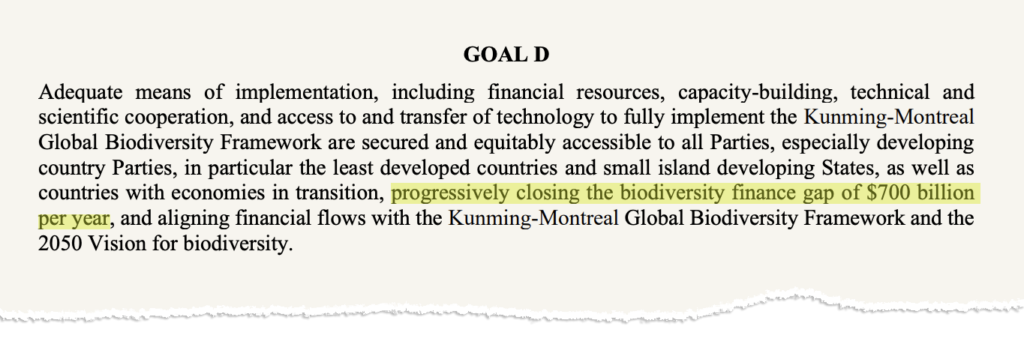
The 2, adopted by 196 countries, aims to halt and reverse nature loss by 2030. Its 23 targets range from restoring 30% of degraded ecosystems and conserving 30% of land and sea ("3") to raising $200bn a year for nature. Each country is meant to turn these into its own 4. So far 174 countries have submitted at least one.
Carbon Brief gives each target an 5 from 0 to 1, calculated from countries' self-reported data and standard progress indicators. The article doesn't spell out the formula, so the scores work best as a ranking.
Money is the weakest area
Mobilising $200bn a year: 0.13. A milestone of $20bn a year in international finance for developing countries by 2025 was "likely not achieved". Domestic spending as a share of GDP has fallen, and private finance has dropped since 2021.
Cutting 6 by $500bn a year: 0.17. Countries missed the 2025 deadline even to identify these subsidies, such as tax breaks that damage ecosystems.
Gender equality: also 0.13.
The headline land and species targets
30x30: 0.38. Indicators put the world just 25% of the way there, although marine protected areas are growing.
Restoration: 0.5. Restoration is expanding, but at levels "below" what is needed, and progress at sea and in freshwater lags.
Halting extinction: 0.25. Indicators show 0% progress, even though 70% of countries have addressed most of the target's elements in their plans.
The highest score, 0.75, goes to limiting climate impacts on biodiversity. But only 18% of countries reported numbers for it.
Thin evidence
Data is a problem across the review. For some targets very few countries reported quantitative data: 8% for biosafety, 12% for building biodiversity into wider policy, 15% for Indigenous participation. The report repeatedly calls progress "difficult to assess". The same obstacles recur from target to target: too little finance and capacity, harmful subsidies that persist, and weak enforcement. The report describes a "persistent disconnect" between policies and results.
There are some gains. Thousands of companies now disclose biodiversity risks, a number that grows each year, and wildlife-trade rules and biosecurity measures are improving. The article doesn't say what COP17 is expected to decide on finance, the area most clearly off track.
This month's 1 biodiversity summit in Armenia, running 19–30 October, holds the first global review of the 2022 nature deal. A UN progress report prepared for it finds countries falling short on 22 of the 23 targets set for 2030. It warns that the goals will not be met unless action "accelerates rapidly". Carbon Brief has gone through the report target by target, scoring each one and listing what is working and what is not.
What is being measured
In 2022, 196 countries adopted the 2 (GBF), the agreement under the UN Convention on Biological Diversity that aims to halt and reverse nature loss by 2030. It has 23 targets. Some cover land and species, such as restoring 30% of degraded ecosystems, conserving 30% of land and sea (known as "3") and halting human-caused extinctions. Others cover pressures such as pollution, invasive species and 4, and the rest cover implementation: finance, data, business disclosure, Indigenous participation and gender equality.
Countries are supposed to translate these into 5, their own versions of the global goals. So far 174 countries have submitted at least one. That leaves a handful of the 196 signatories without any.
How the scoring works
For each target, Carbon Brief reports four measures drawn from the UN assessment:
the share of countries that have addressed at least half of the target's elements
the share of relevant national targets that are on track or achieved
how far the world has got towards the global target according to 6, the standard metrics the framework uses
the share of countries that reported any quantitative data on those indicators
These feed into an 7 from 0 to 1, calculated from countries' self-reported data and the indicators. The article does not give the exact formula, so treat the scores as a rough ranking, not precise measurements.
Where things stand
Worst performers:
Mobilising $200bn a year for biodiversity: 0.13
Gender equality in implementation: 0.13
Reducing harmful incentives by at least $500bn a year: 0.17
The money targets look especially weak. The goal of moving $20bn a year in international biodiversity finance from rich to developing countries by 2025 was "likely not achieved", though the report says it needs more data to be sure. Domestic biodiversity spending as a share of GDP has fallen. Private biodiversity finance has also dropped since peaking in 2021, even as total biodiversity finance shows "upward trends". On subsidies, countries were supposed to identify harmful incentives by 2025, such as tax breaks that end up damaging ecosystems. The evidence suggests that milestone "was not achieved". Only 26% of related national targets are on track.
Best performers:
Minimising climate change impacts on biodiversity: 0.75
Sustainable use and trade of wild species: 0.67
Knowledge-sharing and access to data: 0.63
The climate score comes with a large caveat. Only 18% of countries reported quantitative data for it, and the report says 8 are "not being deployed" at the scale needed. These are measures such as restoring peatlands or planting trees that help both climate and nature.
Headline land and species targets:
30x30: score 0.38. Indicators put the world only 25% of the way there, even though 65% of countries reported data. Marine and coastal protected areas are expanding, but finance and capacity are short. Monitoring of Indigenous and local territories is "low".
Restoration: score 0.5. Restoration is expanding, but commitments are "below" what is needed. Progress lags in marine, coastal and freshwater areas, and "inconsistent definitions" make monitoring hard.
Halting extinction: score 0.25. Indicators show 0% progress towards the global target, even though 70% of countries have addressed most of the target's elements. That gap between plans on paper and results on the ground is the clearest example in the report.
The remaining targets mostly sit between 0.25 and 0.5. They include urban green space, mainstreaming biodiversity into policy, business disclosure, biosafety and Indigenous participation, all at 0.25, and agriculture and fisheries at 0.5.
The data problem
The weakest point in the review may be the evidence itself. Here is the share of countries reporting quantitative indicator data for selected targets:
Target
Countries reporting data
Biosafety
8%
Mainstreaming biodiversity in policy
12%
Gender equality
13%
Indigenous participation
15%
Climate impacts
18%
Halting extinction / finance
68%
When fewer than one in five countries report numbers, the "% of the way" figure rests on a thin base. Phrases such as "difficult to assess", "insufficient evidence" and "inconsistent definitions" come up for target after target. Sustainable aquaculture could not be assessed at all. This cuts both ways: some targets could be doing better than the scores suggest, and others worse.
What is holding things back
The same obstacles appear across many targets:
Lack of finance and capacity, both technical and institutional
Harmful subsidies that persist, cited under the agriculture and wild species targets as well as the subsidy target itself
Weak enforcement
National targets that only partly match the global wording. Elements on Indigenous rights, pathogen spillover (diseases jumping from animals to people), poverty strategies and women's access to land are often left out.
The report describes a "persistent disconnect between formal biodiversity policies and their effective implementation".
There are positives. Thousands of companies now disclose biodiversity-related risks, and the number rises each year. Countries report legal progress on regulating wildlife trade, more biosecurity measures against invasive species, and more biodiversity planning in cities.
What remains open
The article sets out the evidence but not the negotiating positions. It doesn't say what Armenia's summit is expected to decide on finance, or how countries will respond to the missed 2025 milestones. The scoring method is only outlined, and because much of the evidence is self-reported, some of the more encouraging scores are least certain. With roughly four years left, the review suggests the plans are mostly written. The money, the monitoring and measurable outcomes in ecosystems, especially for threatened species, are what is missing.
Remember
The two money targets score worst: 0.13 for raising finance and 0.17 for cutting harmful subsidies, and both 2025 milestones were missed.
Indicators show 0% progress on halting extinctions, although 70% of countries have addressed most of that target in their plans.
Very few countries report numbers on some targets, as low as 8%, so even the better scores are uncertain.
1, the nonprofit energy think tank formerly called the Rocky Mountain Institute, has published a report on whether the US grid could handle millions of new 2. Heat pumps move heat from outdoor air into a home instead of burning fuel. RMI concludes that about 109 million homes, roughly three-quarters of the US total, could switch using existing grid capacity. It says this would cut emissions and lower electricity bills by more than 20% in some states.
Where the spare capacity comes from
The grid is sized for its single busiest moment of the year. In most of the US that comes in summer, when air conditioners run hard. In winter, many homes heat with gas furnaces, which draw little electricity, so a lot of grid capacity goes unused. RMI calls this unused margin "3." Ryan Shea of RMI's buildings team says adding heat pump load in winter uses that capacity "without needing to build it out more." In other words, no wave of new gas plants.
Why rates could fall
Much of what utilities spend goes to fixed infrastructure. Selling more kilowatt-hours over the same equipment spreads those costs more thinly. Here's an illustration with made-up numbers: $1 billion in fixed costs spread over 10 billion kWh is 10¢ per kWh, but over 12 billion kWh it is about 8.3¢. Shea argues that "everyone benefits with a lower electricity rate," including households that don't switch.
Not uniform
Headroom varies by region. Phoenix has big summer peaks and mild winters, so it has plenty of winter slack. Colder places have less. Grids that rely heavily on solar also produce less in winter, when days are short.
Heat pumps would replace electric resistance heaters too: baseboard and space heaters that convert electricity directly to heat, common in the Pacific Northwest and Southeast. Heat pumps are three to four times more efficient, so that switch lowers grid demand. Earlier RMI research put the average savings for those households at about $1,530 a year.
How to speed it up
Replace broken air conditioners with heat pumps, which also cool.
Offer state rebates. Maine reached its 100,000-heat-pump goal two years early.
Build more apartments, which typically come with heat pumps.
What's missing
Grist's summary leaves out the method. It doesn't say whether local distribution equipment, such as neighborhood transformers, has the same headroom as the bulk grid. It also doesn't address extreme cold snaps, when heat pumps lose efficiency, backup heating kicks in and some southeastern utilities already hit their annual peaks. The 20% savings figure comes without the states or the assumptions behind it.
The finding
1, the nonprofit energy think tank once called the Rocky Mountain Institute, has published a report on whether the US grid can handle a mass switch to 2. A heat pump moves heat from outdoor air into a building instead of burning fuel to make it. RMI says the grid can. Because of what it calls winter "3," roughly three-quarters of US homes, about 109 million, could adopt heat pumps without new generating capacity. RMI says this would cut greenhouse gas emissions and lower electricity bills by more than 20% in some states. Grist's coverage doesn't say which states those are.
What "headroom" means
Grid operators build enough power plants and wires to meet the year's highest demand. In most of the US that peak comes in summer, when millions of air conditioners run at once. In winter, many homes heat with gas furnaces, so their heating energy never touches the electric grid. The gap between what the grid can supply and what winter actually demands is the headroom.
Ryan Shea, a manager on RMI's buildings team, describes heat pumps as a way to add load "where there is all that available grid capacity" without building more of it. Grist frames the practical upshot this way: running 109 million heat pumps through the winter would not require a fleet of new gas-fired power plants.
Why more electricity use could lower rates
The affordability argument is the less obvious part. Much of a utility's cost is fixed: power plants, transmission lines and poles have to be paid for whether they run flat out or sit idle. If those costs are spread across more kilowatt-hours sold, each kilowatt-hour costs less. Shea says the result is "a lower electricity rate" for everyone, not just heat pump owners.
Here is a simple illustration with made-up numbers. Suppose a utility must recover $1 billion a year in fixed costs and sells 10 billion kWh. That works out to 10¢ per kWh for fixed costs. If winter heat pump load adds 2 billion kWh using equipment that already exists, the same $1 billion is spread over 12 billion kWh, or about 8.3¢ per kWh. This only works if the new load doesn't force new capacity to be built. That is exactly the claim the headroom analysis rests on.
It varies by region
Headroom differs from place to place. Climate matters: Phoenix has hot summers that drive big air-conditioning peaks and mild winters with little heating demand, so it has plenty of winter slack. Boston's balance is different. The power mix matters too. Gas plants can run all year, but solar output falls in winter as days get shorter, which shrinks winter capacity on solar-heavy grids. Utilities are adding large battery installations, testing electric vehicles as backup power, and trying underground storage for longer durations. Grist's author goes further and asserts that renewables plus batteries make the grid more reliable than fossil fuels. That is the outlet's claim, and the article doesn't support it with data.
Replacing resistance heat counts too
Heat pumps would also replace 4: baseboard heaters, space heaters and electric furnaces that turn electricity directly into heat. These are common in the Pacific Northwest and the Southeast, where winters are milder. Heat pumps deliver about three to four times as much heat per unit of electricity, so switching from resistance heat reduces the load on the grid. RMI's earlier research put the potential savings for these households at about $1,530 a year on average.
How to speed it up
RMI and Grist suggest several approaches:
Replace broken air conditioners with heat pumps. A heat pump also cools, so a failed AC unit is a natural moment to switch.
State rebates. Maine, which has cold winters, reached its goal of 100,000 installed heat pumps two years ahead of schedule.
Build more apartments. New housing units tend to get heat pumps, so more construction means more installations.
Heat pump targets in affordability plans. Shea argues states should set explicit installation goals.
Earlier Grist coverage, which this piece builds on, also counters the claim that heat pumps fail in the cold. Models designed for cold climates work through hard winters, as their wide use in the Nordic countries shows.
What the article leaves open
Grist's summary gives none of the report's methodology. It doesn't say whether the headroom was measured at the level of bulk generation or at local 5, the neighborhood transformers and feeders that can become bottlenecks even when the overall grid has slack. It also skips the hardest case: extreme cold snaps. Heat pump efficiency drops in very low temperatures, and backup resistance elements may switch on just as demand spikes. Some southeastern utilities already hit their annual peaks in winter for this reason. The headline 109 million figure presumably excludes homes where headroom is too thin, but the article doesn't say which homes those are or why. The "over 20 percent" bill savings is likewise given without the states or the assumptions behind it. Readers who want to judge how robust the claim is will need the RMI report itself.
Remember
Most US grids peak in summer, so winter capacity sits partly idle and could serve electric heating.
Selling more kilowatt-hours over existing equipment spreads fixed costs, which can lower rates for everyone.
Swapping resistance heaters for heat pumps cuts grid demand roughly threefold; RMI estimates about $1,530 a year in household savings.
A data center under construction. Sites of 50 MW or more on lines of 100 kV and up would fall under the rules.
Stakeholders of the 1, the body that sets mandatory reliability rules for the North American high-voltage grid, have approved on a final ballot a set of standards for AI data centers, crypto mining facilities and other "computational loads." NERC announced the result on Oct. 15. The standards now go to NERC's Board of Trustees, which is expected to vote in the fourth quarter. If the board adopts them, they go to the 2 for final approval.
The problem
Grid planning has long treated demand as smooth and fairly predictable. Large computing sites break that assumption. NERC points to several incidents in which data centers suddenly dropped their load or swung their demand up and down rapidly, which threatened the stability of regional grids.
The grid must match supply and demand second by second. When hundreds of megawatts of demand vanish at once, generators suddenly produce more than is being used, and frequency and voltage move out of their safe ranges.
In May, NERC issued a 3, its most serious category, which requires a response. The alert listed seven actions grid entities "must implement" to deal with the immediate risks while permanent rules were written.
What the rules require
The standards were developed under NERC Project 2026-02 and cover three areas:
Interconnection studies and modeling. Large sites must provide modeling data that is checked and reported, so planners can simulate how they behave years ahead.
Operational data and communications. Transmission operators, 4 (which keep supply and demand matched in an area) and 5 (which oversee wide regions) must get site data and have communication channels with predefined protocols, so they can act quickly when something goes wrong.
The rules would apply to computational loads of 50 MW or more connected at 100 kV or above.
Why now
NERC forecast in January that summer peak demand will grow by 224 GW over 10 years, a 24% increase over the 2025 peak, with data centers driving the projections. NERC says these loads are "exposing reliability gaps" in both day-to-day operations and long-term planning.
What's still unknown
The article does not give compliance deadlines or penalties. It also does not say whether the rules require sites to stay connected through grid disturbances ("ride through" them) or only to report and model them. Those details will decide how much the rules actually change site design.
Stakeholders of the 1 have approved on a final ballot a set of reliability standards for AI data centers, crypto mining facilities and other "computational loads." NERC is the organization that writes mandatory reliability rules for the 2, the high-voltage network of large generators and transmission lines. It announced the result on Oct. 15, 2026.
Two steps remain. NERC's Board of Trustees is expected to take up the standards in the fourth quarter. If it adopts them, they go to the 3, whose approval makes NERC standards enforceable, with fines for violations.
Why loads became a reliability problem
Reliability rules have mostly governed generators and transmission owners. Demand was treated as the sum of many small customers. Individual customers switch devices on and off at random, so the total changes smoothly and can be predicted from weather and time of day.
Large computing sites break that model in two ways that NERC identifies. First, data centers have "unexpectedly dropped load." Second, they have "oscillated demand rapidly." Either one threatens regional stability.
The physics explains why. The grid has to balance generation and consumption continuously. If 1,000 MW of demand disappears in an instant, generators are suddenly producing 1,000 MW more than anyone is using. Frequency rises, and operators have to cut output fast. Rapid oscillation is a quieter danger. Repeated swings in demand can excite the natural oscillation modes of generators and grid controls, and those oscillations can grow.
The article does not describe the individual incidents. A widely reported example from July 2024 shows the pattern. In Northern Virginia, about 1,500 MW of data centers switched to backup power almost at once during a brief fault on the transmission system. This is what their protection systems are built to do when voltage dips. The sudden loss of load had to be absorbed quickly. A useful analogy: dozens of large customers all leave the room through the same door at the same moment, and nobody told the people managing the room that it could happen.
The stopgap: a 4
In May, NERC issued a Level 3 alert. NERC's alerts come in three escalating levels: advisories, recommendations, and "essential actions." Level 3 is the essential-action tier, and entities must respond to it. The May alert set out seven actions grid entities "must implement to address immediate risks posed by computational loads" while permanent standards were developed. The new standards build on research and findings gathered around that alert.
What the standards contain
The standards were developed under NERC Project 2026-02. NERC describes their purpose as establishing "requirements to support the reliable integration of large computational loads into the bulk power system." There are several standards, grouped into three areas.
Interconnection studies and modeling. The standards set procedures for providing modeling data, verifying it and reporting it, for "development of 5." These are the computer simulations planners use to test whether the transmission system will hold up years from now. A model that treats a 300 MW data center as a fixed, steady load will miss how it really behaves during a fault. Requiring verified models closes that gap.
Operational data and communications. Three kinds of grid entities must have the computational-load site data they need "to plan, monitor, and assess" reliable operation. Transmission operators run the lines in an area. Balancing authorities keep supply and demand matched within a region. Reliability coordinators have the widest view and authority over a large area. The standards also require communication capabilities "with predefined communications protocols," so that operators and sites can take prompt action when an event begins.
Load protection coordination and disturbance monitoring. Protection coordination means that a site's own protective settings, such as the voltage at which it switches to backup power, work together with the grid's protection scheme instead of against it. Disturbance monitoring means recording how the site actually behaved during events, so models can be checked against reality.
Who is covered
The rules would apply to computational loads of 50 MW or more connected at 100 kV or higher. For scale, 50 MW is roughly the demand of tens of thousands of homes. Many recent AI campuses are planned at hundreds of megawatts, and some at more than a gigawatt. The 100 kV threshold matches the voltage level generally used to define the bulk power system. Smaller sites connected to local distribution networks would fall outside the rules.
The demand backdrop
NERC forecast in January that summer peak demand across the bulk power system will grow by 224 GW over the next decade. That is a 24% rise over 2025 peak demand, after decades of nearly flat growth, and data centers drive much of the projection. NERC says these loads are "reshaping the demand profile and exposing reliability gaps in both operational and planning time horizons." In other words, both the second-to-second job of running the grid and the years-ahead job of building it are affected.
What remains open
The article leaves several important questions unanswered:
Compliance timelines. It gives no implementation dates, and NERC standards often phase in over years.
Performance versus information. The summarized requirements cover data, models, communications and coordination. The article does not say whether sites must stay online through specified voltage and frequency disturbances ("6"), as generators often must. That rule would most directly prevent mass load drops, and it would cost sites the most.
The article does not say whether facilities already operating are covered, or on what terms.
What the ballot does establish is a principle. Very large loads are being brought under the same kind of mandatory reliability rules that have long applied to power plants.
Remember
Large loads are joining power plants under mandatory grid reliability rules, which reverses the old assumption that demand is passive.
The coverage threshold is 50 MW at 100 kV or above, which captures most large AI and crypto campuses.
The article does not say whether the rules require ride-through, the requirement that would most directly prevent mass load drops.
Protection coordination and disturbance monitoring. A site's own protective equipment must work in step with the grid's, and the site must record how it behaves during disturbances.
Existing sites.
FERC's response. FERC can approve the standards, send them back, or direct changes.