New figures on idle grid capacity and battery failures arrive the same week UNEP concedes that even its most ambitious path now overshoots 1.5°C.
Picked from 71 new articles across 13 sources · arrow keys for other days
Today in 30 seconds
30s left
Virginia utilities published how much of their local grid gets used: Dominion averages 41%, Appalachian Power 14%. Regulators must now decide what follows. story 1 ↓
US grid battery failure rates fell over 97% while installations grew 250-fold. EPRI data puts them on par with substation transformers. story 2 ↓
Brazilian Amazon clearing fell to about 3,300 km² in the year to July, its lowest since 1988. Cerrado clearing hit a record low. story 3 ↓
UNEP's lowest-warming scenario now peaks at 1.7–1.8°C and needs a 69% emissions cut by 2040 plus large-scale carbon removal. story 4 ↓
Google expanded its Voltus virtual power plant deal in PJM from 100 MW to 1.17 GW, with the contract running through 2040. story 5 ↓
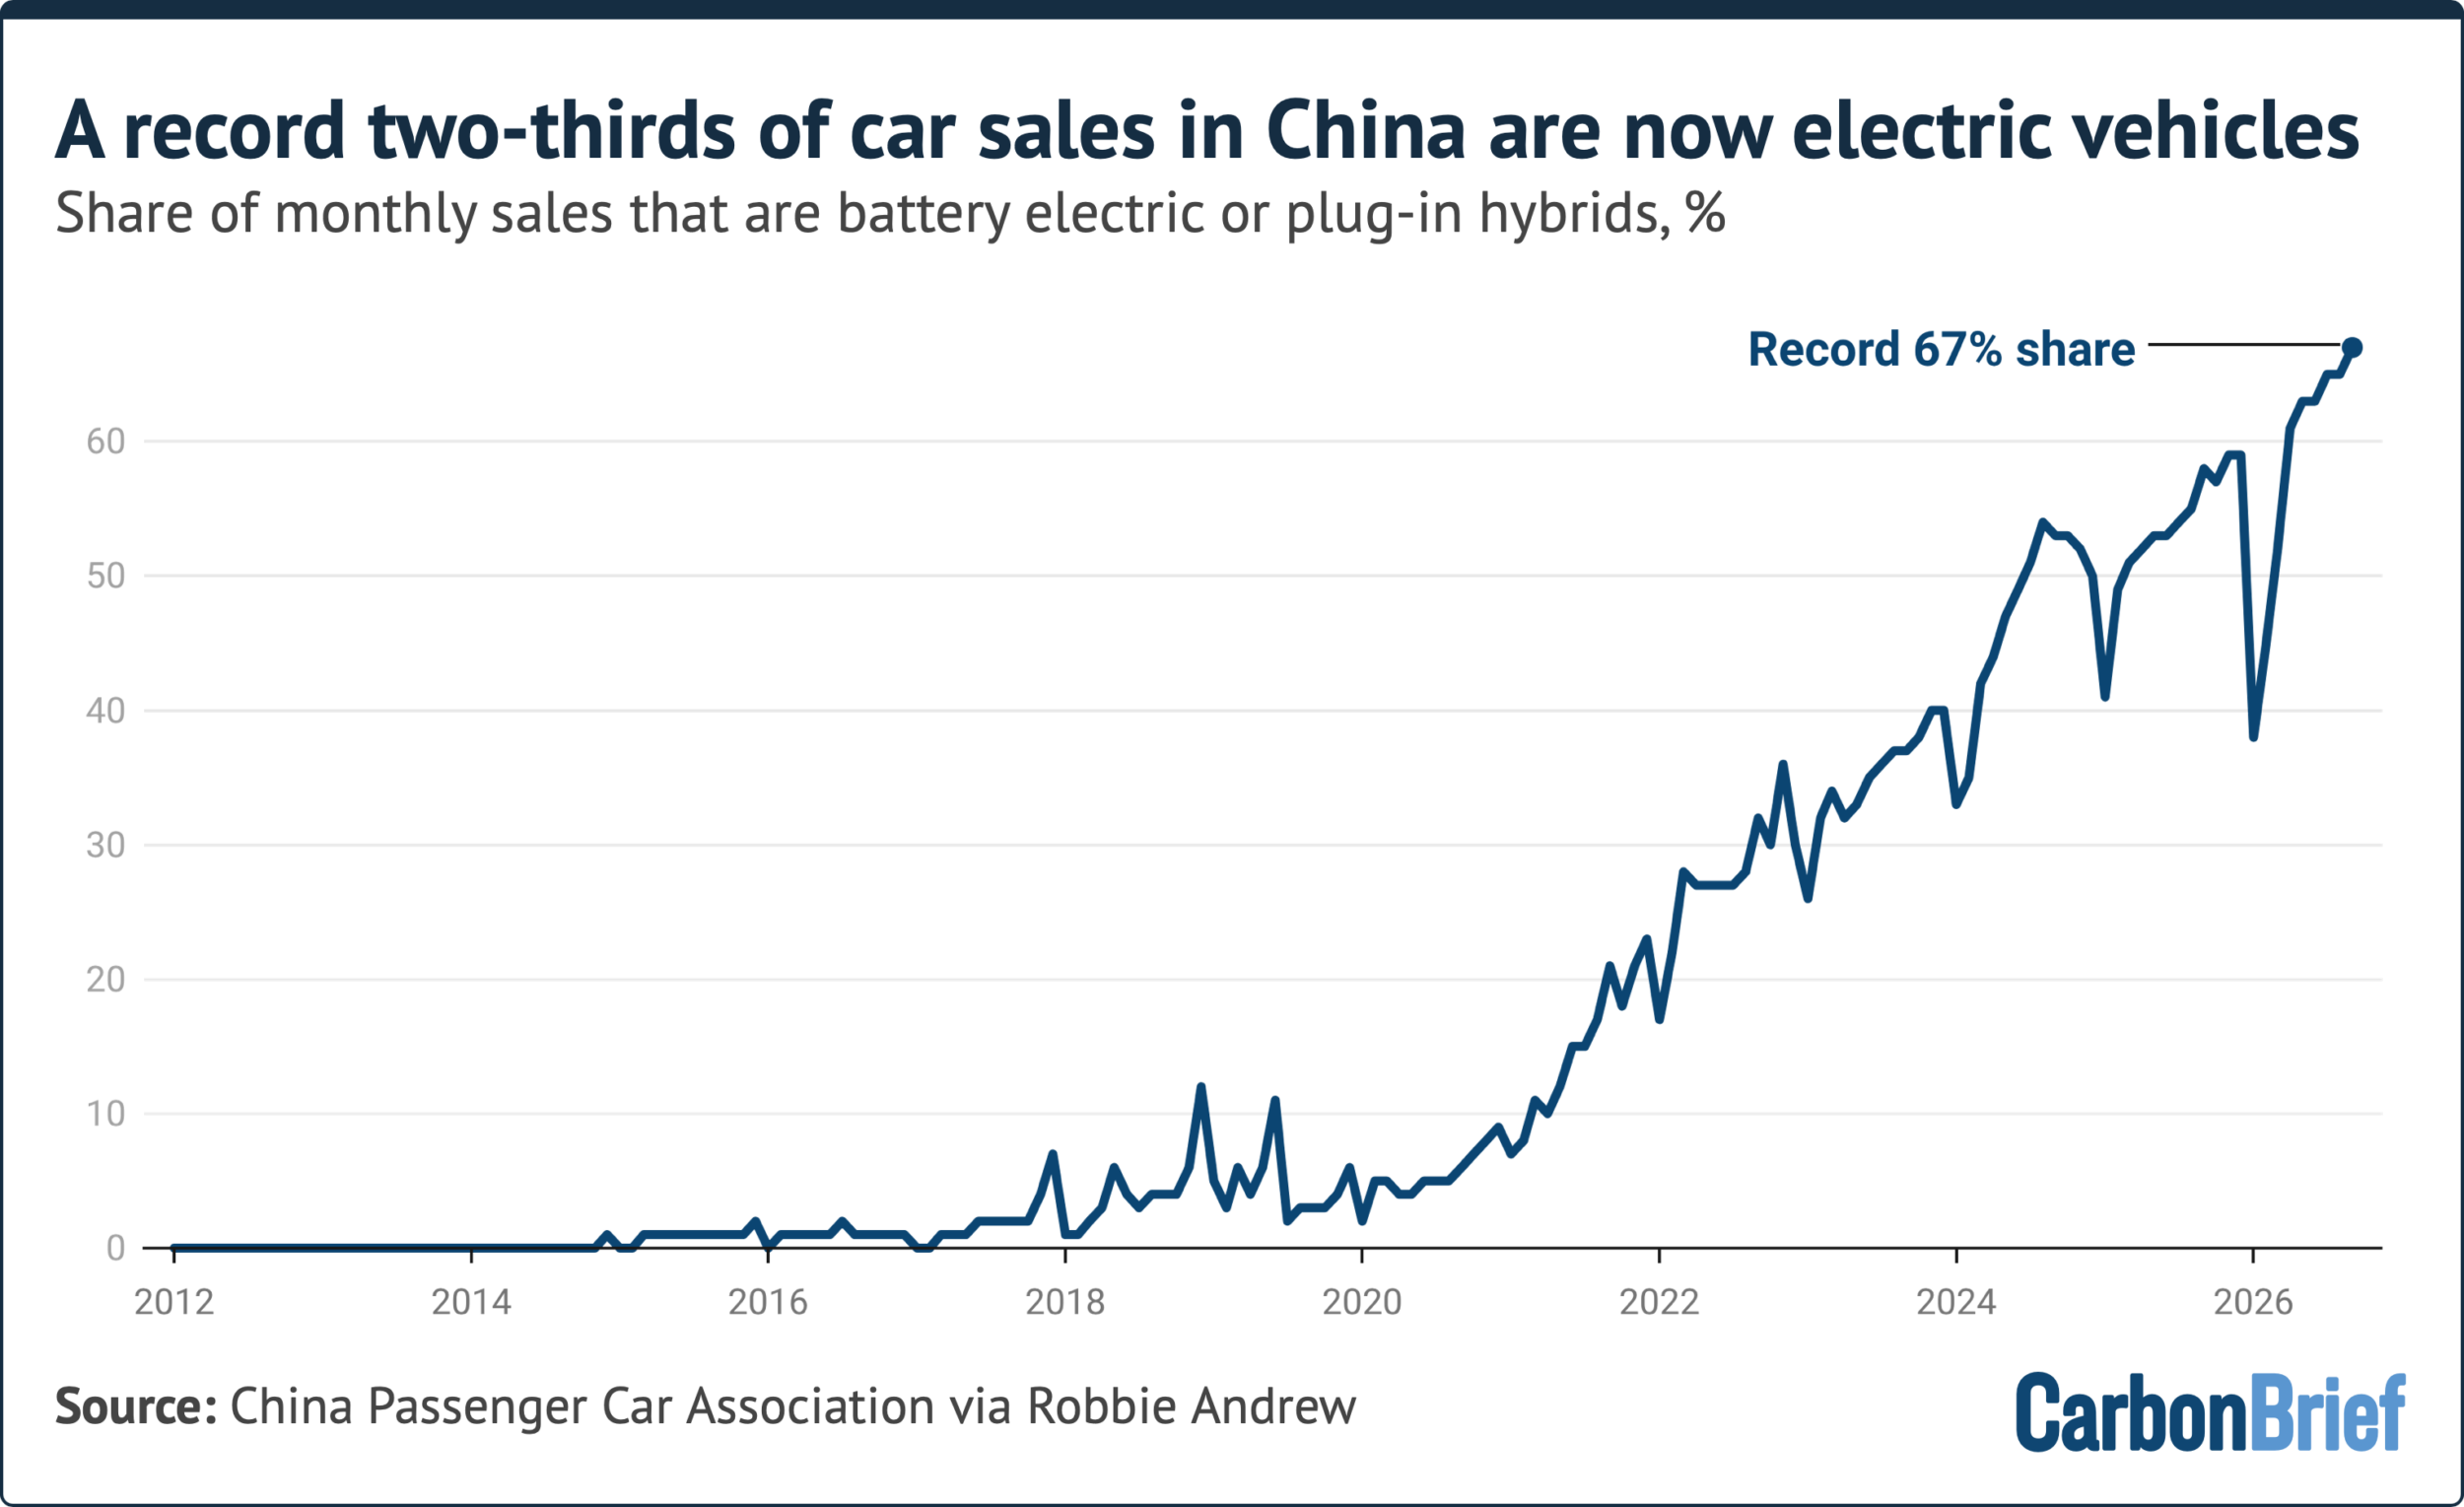
Electric vehicles made up a record 67% of China's new car sales in September, according to Carbon Brief.
1/5Latitude Media· Catherine Boudreau· Oct 21
Virginia utilities publish the first public numbers on how much of their grid gets used
Under a new Virginia law, Dominion Energy and Appalachian Power published how much of their local grid capacity customers actually use: 41% and 14% on average over the year, and 80% and 54% at peak.
Why it matters · If regulators can measure idle grid capacity, they can make utilities show that a new line or substation beats cheaper options like batteries or flexible demand before customers pay for it.
Know this first
Context from the editor, not the article · 29 sec
1 · Grids are built for peaks
Utilities size wires, transformers and substations for the few hottest or coldest hours of the year, so most capacity sits idle most of the time. Customers pay for that capacity through rates, plus an allowed return on it.
2 · Distribution versus transmission
Transmission lines move bulk power over long distances at high voltage. The distribution system, meaning substations and the local lines called feeders, delivers power to homes and businesses. A strain on one system can differ from a strain on the other.
3 · Why Virginia is the test case
2/5Canary Media· Julian Spector· Oct 23
US grid battery failure rate fell over 97% as installations grew 250-fold
Canary Media combined failure data from a nonprofit utility research group with US installation figures. From 2016 to 2025, battery failures per unit installed fell more than 97% while the installed base grew 250-fold.
Why it matters · Local opposition over fire fears now limits how fast batteries get built, so knowing the real failure rate matters for siting, permitting and grid reliability.
Know this first
Context from the editor, not the article · 25 sec
1 · Why grid batteries matter now
Large lithium-ion battery plants store cheap midday solar power and release it when demand peaks. They have become the main type of new on-demand power capacity being added to the US grid.
2 · Why battery fires are hard
A damaged or faulty lithium-ion cell can overheat and set off its neighbours, a chain reaction called thermal runaway. Water barely slows it, so firefighters usually just let the fire burn out.
3 · Who EPRI is
The Electric Power Research Institute is a nonprofit research group funded mostly by utilities. It keeps a public database of failures at commercial and grid-scale battery sites around the world.
3/5Sustainability by Numbers (Hannah Ritchie)· Hannah Ritchie· Oct 22
Brazilian Amazon deforestation falls to lowest level since 1988
Brazil's space agency estimates about 3,300 km² of Amazon forest was cleared between August 2025 and July 2026, the lowest since 1988. Clearing in the Cerrado also hit a record low, so it wasn't simply displaced there.
Why it matters · Tropical deforestation is a major source of carbon emissions. This series shows that policy can cut it a lot, and also how fast those cuts can be reversed.
Know this first
Context from the editor, not the article · 24 sec
1 · How the Amazon is measured
Brazil's National Institute for Space Research (INPE) runs PRODES, which maps clear-cut forest from satellite images each year. Its "year" runs August to July, matching the dry season, when cloud-free images are easier to get.
2 · The Legal Amazon
PRODES covers the Legal Amazon, an administrative region of nine Brazilian states covering about 5 million km², roughly 60% of Brazil. It includes rainforest plus some savanna transition zones.
3 · Why the politics matters
Amazon clearing in Brazil has risen and fallen with enforcement, land-use rules and farm-commodity prices. Changes of president have repeatedly marked turning points in the satellite record.
4/5Inside Climate News· By Lauren Dalban· Oct 21
UN report: even the most ambitious path now overshoots 1.5°C warming
The UN Environment Programme's annual emissions gap report finds that even steep emissions cuts would leave peak warming at 1.7–1.8°C. Current policies point to 2.8°C by 2100, even though renewables have grown faster than forecast.
Why it matters · The 1.5°C goal is no longer the planning baseline. The questions now are how far warming overshoots, how fast fossil emissions fall, and how much carbon removal the world can count on.
Know this first
Context from the editor, not the article · 27 sec
1 · The Paris temperature goals
The 2015 Paris Agreement commits nearly every country to holding warming well below 2°C above pre-industrial levels while pursuing 1.5°C. By most recent estimates the world has already warmed by roughly 1.3°C.
2 · What the gap report does
Every year the UN Environment Programme compares where pledges and policies will take global emissions with where they need to be for each temperature goal. The difference between the two is the emissions gap.
3 · Overshoot and carbon removal
If warming passes a target and later falls back, that is an overshoot. Bringing temperatures down afterwards requires net-negative emissions, meaning more CO2 is pulled out of the air through forests or engineered capture than is emitted.
5/5Utility Dive· Ethan Howland· Oct 22
Google expands its Voltus virtual power plant deal in PJM to 1.17 GW
Google will pay Voltus to pool about 1,170 MW of flexible demand from homes and businesses: batteries, thermostats and factory processes. Voltus will offer it into PJM, the biggest US grid, when supply is tight.
Why it matters · This deal shows large buyers using long-term contracts to finance demand flexibility the way they once financed wind and solar, and it comes as data centers strain PJM's capacity.
Know this first
Context from the editor, not the article · 29 sec
1 · What a virtual power plant is
A virtual power plant (VPP) pools many small, flexible resources, such as home batteries, smart thermostats, backup generators and adjustable factory loads. Software dispatches them together, so the pool can cut demand or add supply like one power plant.
2 · PJM's capacity market
PJM runs the grid and wholesale market for 13 states plus Washington, D.C. Its capacity auctions pay resources to be available years ahead. Cutting demand on request, called demand response, can also earn these payments.
3 · Data centers and tight supply
Fast-growing data center demand has pushed PJM capacity prices to record levels. Even so, PJM has recently fallen short of its reliability margins. That has started a debate over whether large new loads should bring their own power supply.
Northern Virginia's Loudoun and Prince William counties hold the world's largest cluster of data centers, known as Data Center Alley. Their fast-growing demand is pushing Dominion Energy toward large grid build-outs.
Image: Latitude Media
Virginia's two big investor-owned utilities have filed the first public numbers on how much of their 1 gets used. The distribution grid is the substations and local lines that deliver power to customers. A new state law required the filings.
The numbers
Dominion Energy, which serves northern Virginia's Data Center Alley, reported 41% average annual utilization from July 2025 to July 2026. In the rare peak hours, use averaged 80% of capacity, higher in some places and lower in others.
Appalachian Power (APCo), which mostly serves the rural southwest where demand is falling, reported 14% annual utilization and 54% at peak.
Everyone in the industry knew grids sit underused most of the year, because they are built for a few peak hours. These filings are the first to put public figures on it. Dominion says the headroom could serve new load, especially if demand can be shifted away from peaks.
What the numbers are for
The law tells Virginia's 2, the utility regulator, to use the metrics when judging whether 3 could fix a grid constraint faster and more cheaply than new poles and wires. Examples include batteries, customer solar and data centers that can flex their demand.
Dominion wants the metrics used only as a screening tool, not as a "deciding factor" for rejecting its spending. Deploy Action, a clean-energy group that worked on the law, says that reading undercuts the law's purpose.
There is also a fight over method. Dominion's "general" metric counts customers' rooftop solar and batteries as added capacity. Its "planning" metric doesn't, because Dominion says those resources can't be counted on when local demand peaks. Deploy Action says both utilities undervalued these resources and flexible demand.
Stress in Data Center Alley
The transmission data is the sharper finding. Dominion and the 4, a utility-funded research group, tracked warnings that the system was so constrained that "ordinary correction actions may not be sufficient." There were 8 in 2023. This year there have been more than 172 so far, covering 2,530 hours, nearly all in Loudoun and Prince William counties. Dominion says lines aren't overloaded in normal operation. The problem is that safety margins for losing a major line are shrinking.
Caveats and timing
The figures are system-wide averages, and they can hide congested individual 5 and substations, as both Dominion and outside analysts point out. Dominion wants regulators to watch trends for three to five years before making any metric binding. Deploy Action calls that too slow. California is the only other state with a similar law.
Virginia's two largest investor-owned utilities have filed the first public numbers on how much of their distribution system is actually used over a year. The distribution system is the substations and local lines that carry power to homes and businesses. The filings follow a Virginia law requiring grid utilization metrics. They are the opening move in what could be a years-long fight over how regulators judge requests for new grid spending.
The headline numbers
Dominion Energy serves northern Virginia, including Data Center Alley. It reported an annual distribution utilization rate of 41% from July 2025 to July 2026. During the year's few peak hours, the grid ran at an average of 80% of capacity, with some locations higher and some lower.
Appalachian Power (APCo) mostly serves Virginia's rural southwest, where demand is declining. It reported 14% annual utilization, rising to 54% at peak.
The article doesn't give the exact formula. In general terms, a utilization rate compares the power actually flowing through equipment with what that equipment could carry. A 41% annual figure means that, averaged over all 8,760 hours of the year, Dominion's distribution equipment carried well under half its capacity. Dominion says this points to "a lot of potential headroom" for new load, especially if demand can be controlled or moved away from peak hours.
Industry insiders have long known that U.S. grids sit mostly idle, because they are sized for the hottest or coldest few hours of the year. These filings are the first to quantify it publicly and propose ways to measure it. "We've historically asked utilities to build for peaks," said Ian Magruder, executive director of the Utilize Coalition, which pushes for policies that get more use out of existing grids. "Now, we're shifting to say, peak remains important, but there's more we can get out of the system 8,760 hours of the year."
Why the metric matters: who pays for what
Utilities earn a regulated return on the capital they invest, so building new infrastructure is how they make money. Other ways of easing grid constraints often cost less but earn less. These include battery storage, transmission upgrades and data centers that can cut or shift their demand on request. Together they are called 1, solutions that avoid new poles and wires.
The Virginia law directs the 2 (SCC), the state's utility regulator, to use utilization metrics when deciding whether a non-wires alternative would solve a given constraint faster and more cheaply.
That is where the first dispute comes in. Dominion argues the metrics should be mainly a screening tool for spotting constraints, not a "deciding factor" in whether regulators deny capital spending. Deploy Action, a group that promotes clean energy as a way to lower bills and worked on the law, says this reading conflicts with one of the law's core purposes.
The fight over rooftop solar and batteries
The second dispute is about method. Dominion reported two versions of its metric:
General utilization treats customers' solar panels and batteries, known as 3, as both drawing power and adding capacity to the grid.
Planning utilization counts DERs only as demand, not as capacity.
Dominion says DERs can't be fully relied on when local demand peaks, so they shouldn't count as 4. Here is an illustrative example, not from the filings. Suppose a neighborhood has rooftop solar, and its local peak comes at 7 p.m. after sunset. The solar adds nothing at that hour, so a planner can't count on it to keep the 5 from overloading. Deploy Action counters that Dominion and APCo both undervalued DERs and flexible demand.
Molly Knoll, a senior advisor at Align Energy Advisors, isn't worried yet. She says Dominion gave "important visibility" into the DERs on its system, which opens a conversation about how it treats them in planning.
Stress in Data Center Alley
Dominion also worked with the 6 (EPRI), a utility-funded research organization, on two utilization metrics for its transmission system, the high-voltage backbone. One tracks how often the system is so constrained that "ordinary correction actions may not be sufficient." Dominion calls these events Post-Contingency Local Load Relief Warnings. A "7" is the sudden loss of a major line or transformer, and the grid is supposed to keep serving customers when one fails.
Such warnings rose from 8 in 2023 to more than 172 so far this year, covering 2,530 hours in total. That is more than a quarter of the hours in a year. Nearly all were in the data center corridors of Loudoun and Prince William counties.
Dominion says this "does not necessarily mean that facilities are physically overloaded under normal conditions." Instead, contingency margins are shrinking, which leaves operators less room to absorb the loss of a critical line. The two findings sit side by side: the local grid has a lot of idle capacity on average, while the bulk grid serving data centers has very little spare room.
Limits of a system-wide average
Both Dominion and outside analysts warn against reading too much into the averages. A 41% system-wide figure can hide a feeder or substation that is maxed out next to others that are nearly idle. Dominion says the results should be weighed alongside "reliability, resilience, operational requirements, customer needs, and other system-specific factors." Knoll says she is cautious about drawing conclusions for the same reason. Magruder hopes data down to the feeder and substation level will lead to a standard set of metrics the whole industry uses.
Timeline and what success looks like
Dominion asked regulators to watch the data for three to five years before approving binding metrics. Deploy Action objects: "Decisions about new poles and wires are being made today, and every year without clear metrics is another year of investments made without them."
So far, California is the only other state with a similar law. Within two years, Magruder wants more than a dozen states to adopt utilization policies, along with action from the Department of Energy and the Federal Energy Regulatory Commission (FERC), the federal regulator of interstate power markets, to help flexible technologies scale up. Knoll expects it could take up to five years for utility commissions to build enough trust to tie utility profits to system efficiency. She describes a 2018 call in which a Maryland distribution engineer couldn't see why anyone would ask how much more energy existing assets could carry if peaks were smoothed. "We let all that latent value sit there because we didn't need it," she said. "And now it is rapidly being absorbed by data centers."
Several questions remain open. What formula becomes standard? Will rooftop solar and batteries count as capacity? Will the metrics ever be able to block a capital project, or only flag one for review?
Remember
Peak use, not average use, drives grid spending: Dominion's local grid averages 41% but reaches 80% in peak hours.
Northern Virginia's transmission warnings jumped from 8 in 2023 to over 172 this year, nearly all in data center counties.
The fight is over whether utilization metrics can block utility spending or only flag constraints for review.
Cover chart: US battery failure rate set against cumulative grid battery installations, 2016 to 2025.
Batteries are now the main type of new on-demand power being added to the US grid. Local fears about fire have become one of the main things slowing them down. New data suggests that fear is out of proportion to the risk.
What the data shows
The 1, a nonprofit research group funded by utilities, tracks failures at commercial and grid-scale batteries worldwide. It counts fires, explosions and 2, which are electrical discharges through the air. Canary Media took the US part of that record and set it against installation figures from the 3, the main US solar and storage trade group, and 4, a battery-market analysis firm.
From 2016 to 2025:
Failure rate: failures per amount installed fell by more than 97%.
Zero years: in three of those years, no known failures happened at all.
EPRI links the decline to new safety standards that came in after the first large batteries were built, along with better batteries and safer site layouts.
Compared with transformers
EPRI calculates that grid battery units now fail at about the same rate as 5. These are the large units at substations that step voltage up or down. Utilities have used them for decades and the public barely notices them. Lakshmi Srinivasan, lead author of the EPRI report, says batteries get a level of public scrutiny that transformers and substation projects do not.
The caveats
Few events: "There just aren't a lot of failures, which is a good thing, but that means you don't have a very robust dataset," Srinivasan said.
No severity measure: the count treats every failure the same. Some were brief incidents at small batteries. A 2019 explosion near Phoenix seriously injured four emergency responders, the only significant injuries from a US grid battery fire so far. In January 2025, a fire at 6 in California largely destroyed one of the first very large battery plants and forced nearby residents out of their homes for several days. Nobody was hurt.
Rate, not count: a lower rate per unit installed does not have to mean fewer fires in total. When the fleet grows 250-fold, the yearly number of fires can stay flat or even rise while the rate drops.
The article argues that communities can use these numbers to weigh the real risk against what batteries bring: tax revenue, a more reliable grid and downward pressure on power prices.
Batteries are now the main type of new on-demand power being added to the US grid. Public worry about fire has grown alongside them. Canary Media's Julian Spector reports that this worry has become a limiting factor on their growth, and anyone who has watched local permitting fights over storage projects will recognise it. Battery fires do happen, and normal firefighting methods barely touch them. A dataset from the 1 suggests the risk is much smaller than the debate implies. Spector's comparison: in the US, these fires happen less often than shark attacks.
The underlying problem
A lithium-ion cell that is damaged, badly made or overheated can go into 2. The cell heats itself, gives off flammable gas and passes heat to the cells next to it. In a site holding thousands of cells, one bad cell can in principle spread through a whole enclosure. Water cools the outside but does little to stop the chemical reaction inside. Firefighters therefore usually protect nearby equipment and let the fire burn out.
The fires are rare but can be dramatic, so a single high-profile incident can shape local opinion for years.
What EPRI measured
EPRI is a nonprofit research group funded mainly by utilities. It keeps a record of failures at commercial and grid-scale battery sites worldwide, including:
Fires
Explosions
Arc flashes, sudden high-energy electrical discharges through the air
Its recent report shows the worldwide yearly failure rate falling steeply while installations grew exponentially.
Countries differ a lot in their safety rules and development practices, so Canary built a US-only version. It plotted EPRI's US failures against a count of commercial and utility-scale installations from two sources:
SEIA, the Solar Energy Industries Association, the main US solar and storage trade group
3, a firm that analyses battery supply chains and markets
Results for 2016 to 2025:
Failure rate: down more than 97%.
Cumulative installations: up 250-fold.
Zero years: in three years there were no known failures. On the chart these look like gaps in the downward line, but they actually show years with no incidents.
Why the rate fell
The article gives three reasons, without measuring how much each contributed:
Standards: new safety standards took effect after the first large batteries were installed.
Hardware: the batteries themselves have improved.
Layout: project designs have become safer. The article doesn't go into detail. In general, the industry has moved toward separate outdoor containers with more space between them and away from large shared buildings, which limits how far a fire can spread.
Reading the numbers carefully
A rate is failures divided by the amount of equipment in service, so a falling rate is not the same as fewer fires. Here is an illustrative calculation that is not in the article. Suppose the fleet grows 250 times and the rate falls by exactly 97%. The yearly number of failures would then be about 250 × 0.03 ≈ 7.5 times the 2016 figure. With a fleet growing that fast, the number of failures each year can rise even as each installed battery becomes far safer. The article says "far fewer fiery failures are happening," but it gives no absolute counts. Readers should treat the 97% figure as risk per unit, not as a total.
Two further limits come from the article itself:
Small sample. "There just aren't a lot of failures, which is a good thing, but that means you don't have a very robust dataset to analyze," said Lakshmi Srinivasan, the report's lead author. With so few events, one bad year can move the rate a lot.
No measure of severity. Every failure counts as one, whatever its size. Some were short incidents at small batteries. Others were serious:
The transformer comparison
EPRI's most useful benchmark is not sharks. It calculated that grid battery units now fail at a rate comparable to 5. These are the bulky units at substations that convert power between high and low voltage, and they can also catch fire. Srinivasan describes them as "very well understood technology that's been deployed on the grid for decades," familiar to grid operators and essentially "invisible" to the public.
Her conclusion: "We can say safely that battery projects are receiving a lot of public scrutiny in ways that I don't see currently, at least, transformers or substation buildouts receive."
The article does not say what unit the comparison uses, such as failures per unit per year or per unit of capacity. That matters because one battery site and one transformer are very different in size.
What it means for siting
Spector argues that the data can help communities judge the risk more accurately and weigh it against the benefits of hosting a battery:
Tax revenue for the host community
Grid reliability, from stored power available on demand
Lower power prices, which matters at a time of widespread worry about energy bills
What remains open
The article leaves several questions unanswered:
How the US failure rate compares with other countries'
How much each factor contributed to the decline: standards, hardware or layout
Whether older plants built before current standards, as Moss Landing was, still carry higher risk
How failure rates change as batteries age
The overall trend is clear: much more storage and far less risk per unit. But the record is still short, and it contains only a handful of events.
Remember
The rate of failures per unit installed fell, but the article gives no total counts, and a 250-fold larger fleet allows more fires overall.
Grid batteries now fail about as often as substation transformers, which get far less public scrutiny.
Only one US battery incident, near Phoenix in 2019, has caused serious injuries. Moss Landing in 2025 destroyed a plant but injured no one.
Annual Amazon deforestation since 1988; the 2026 bar is the lowest in the series.1 / 4
Brazil's National Institute for Space Research (1) estimates that about 3,300 square kilometres of forest was cleared in the Brazilian Amazon between August 2025 and July 2026. That is a big drop from the year before and the lowest figure since the satellite record began in 1988. For scale, 3,300 km² is a little larger than Luxembourg, which covers about 2,600 km².
The number comes from 2, INPE's project that maps clear-cut forest across the 3. The Legal Amazon is a nine-state administrative region that covers about 60% of Brazil.
A pattern that follows presidents
Hannah Ritchie plotted the annual figures labelled by who was president. Under Luiz Inácio Lula da Silva's first presidency in the 2000s, deforestation fell by three-quarters from its peak. It stayed fairly flat under the next two presidents, then rose again under Jair Bolsonaro. The early-2020s peak was only half the early-2000s rate, but well above the decade before it. In Lula's current term, which began in 2023, rates have fallen by roughly three-quarters again.
Ritchie's verdict: "Credit where it's due, his government can reduce deforestation." The timing is political. Lula faces Flávio Bolsonaro, Jair's son, in an election this weekend that looks very close. The record also shows how quickly the gains can be reversed.
The total still grows
A lower rate still means more forest lost each year. Ritchie's cumulative chart shows that by the early 2000s, the area cleared since 1988 equalled the UK. Five years later it equalled Germany, and this year it will reach the size of Spain. A 2024 study estimates that about one-fifth of the Brazilian Amazon has been lost. That counts only outright clearing. 4, meaning forest that is thinned or damaged but still standing, makes the loss of intact forest larger.
Not just pushed elsewhere
A fair worry is that clearing just moved to another region. Ritchie checks the 5, a mix of forest, woodland and grassland to the south-east. In most years more forest is lost there than in the Amazon, and last year was no exception. But Cerrado clearing also hit its lowest level since that series began in 2001. Ritchie concludes there is no sign that deforestation was displaced from one key region to the other.
What's missing
The post doesn't say which policies caused the drop. It doesn't address weather, commodity prices, or clearing moving across Brazil's borders. It also gives no Cerrado figure for this year.
Brazil's National Institute for Space Research (1) has published its latest annual estimate of Amazon deforestation. About 3,300 square kilometres of forest was cleared between August 2025 and July 2026. That is a large fall from the previous year and the lowest figure since the satellite record began in 1988. Hannah Ritchie, writing in Sustainability by Numbers, ties the result to an election: President Luiz Inácio Lula da Silva faces Flávio Bolsonaro, son of former president Jair Bolsonaro, in a vote this weekend that she expects to be very tight.
Where the number comes from
The estimate comes from 2, INPE's satellite project that maps clear-cut forest. It covers the 3, a nine-state administrative region of about 5 million km², roughly 60% of Brazil. PRODES measures the area cleared each "year" from August to July. It counts clear-cutting only, not forest that has been thinned, burned or otherwise degraded but is still standing. That matters for interpreting the totals below. The data is public, and Ritchie links to it.
Four waves, tied to presidents
Ritchie re-plots the annual series with each year's bar labelled by the president in office. The story falls into rough phases:
Lula's first presidency (2003–2010): deforestation fell by about three-quarters from its early-2000s peak.
The next two presidents: rates stayed fairly stable. These were Dilma Rousseff and Michel Temer, though the post doesn't name them.
Jair Bolsonaro (2019–2022): rates climbed again. The early-2020s peak was still only about half the early-2000s level, but well above the decade before.
Lula's current term (from 2023): rates have fallen by roughly three-quarters again, to this year's record low.
For a sense of scale, and as general background rather than figures from the post: the early-2000s peak was around 27,000–28,000 km² a year, and the Bolsonaro-era peak around 13,000 km². Today's 3,300 km² is about an eighth of the 2004 level.
Ritchie's reading is direct: "Credit where it's due, his government can reduce deforestation." She notes that she can't judge Lula's whole record, only this part of it. The chart shows two things. Federal policy has repeatedly moved the rate up or down by a factor of three or four within a few years. And the low rates of the 2010s did not last once the government changed.
The post doesn't say how the cuts were achieved. It doesn't discuss enforcement, credit rules, protected areas, commodity prices or weather, so the link to Lula is shown by timing, not explained.
The total still goes up
Ritchie notes that readers asked her for a chart of cumulative loss, because a falling rate can hide the obvious: every year of clearing adds to the total. Her cumulative chart counts forest lost since 1988 and compares it to countries:
By the early 2000s, the cleared area equalled the UK (about 240,000 km²).
About five years later, it equalled Germany (about 357,000 km²).
This year it will reach the size of Spain (about 500,000 km²).
The country areas in brackets are general reference figures, not from the post. They show the growth slowing, even though it hasn't stopped. A Spain-sized loss over 38 years averages about 13,000 km² a year, about four times this year's rate.
Ritchie cites a 2024 study in Communications Earth & Environment (Messias and colleagues) estimating that about one-fifth of the Brazilian Amazon has been lost. She adds that this counts deforestation only. 4 from logging, fire and fragmentation means more intact forest has been lost than the headline suggests. Until clearing reaches zero, the cumulative area keeps growing, however good the annual figure looks.
Checking for displacement: the 5
A common worry with regional successes is 6: pressure that is blocked in one place moves somewhere less watched. For Brazil, the obvious candidate is the Cerrado. It is a large mix of forest, woodland and grassland south-east of the Amazon, and it has had much weaker legal protection.
Ritchie points out that in most years more forest is lost in the Cerrado than in the Amazon, and that was true again last year. The Amazon gets most of the attention, but by area cleared the Cerrado is often the bigger problem.
Even so, Cerrado deforestation also reached its lowest level since that series began in 2001. Its record is shorter than the Amazon's. Because both fell together, Ritchie concludes there is "no sign" that deforestation in one key region was pushed into the other.
The check has limits. It compares only two of Brazil's biomes. It doesn't consider clearing in the Pantanal, the Atlantic Forest or the Caatinga. It doesn't consider clearing in neighbouring countries such as Bolivia or Paraguay, where demand for soy and cattle land could also shift. The post also gives no actual Cerrado figure for this year.
What to take from it
The data shows that tropical deforestation responds strongly to government action: two separate drops of about three-quarters, each within a single presidency. It also shows the risk that gains can be reversed, as the Bolsonaro years did.
Three questions stay open:
Causes: which policies, prices or climate conditions drove the fall. The post doesn't analyse this.
Degradation: whether forest damage is falling as well. PRODES doesn't track it, and fire-driven degradation has been significant in drought years.
Durability: whether the rate holds if the government changes. The election makes that question immediate.
Remember
Amazon clearing has twice fallen by about three-quarters within a single presidency, so policy moves the number a lot.
The cumulative area cleared since 1988 is now about the size of Spain; a falling rate still adds loss.
The Cerrado often loses more forest than the Amazon, and it also hit a record low this year.
The 1 says in its annual 2 that holding global warming to 1.5°C above 3 is no longer realistic. Even the report's most ambitious scenario lets warming peak at 1.7–1.8°C. Under current policies, the world is headed for about 2.8°C by 2100.
What the report measures
The 2015 4 aims to keep warming well below 2°C and to pursue 1.5°C. Each year UNEP's report compares the emissions path that national policies and pledges imply with the path each goal requires. This year, no modelled path stays under 1.5°C. Rutgers climate scientist Robert Kopp said that's not surprising, since 1.5°C was already at the edge of feasibility in 2015.
What the best case demands
The lowest-warming scenario needs emissions to fall 18% by 2030, 45% by 2035 and 69% by 2040, all compared with 2025. By our own rough arithmetic, that means about 4% a year at first and close to 11% a year by the late 2030s. That is faster than the roughly 6–7% drop during the 2020 pandemic shutdown, sustained year after year.
It also relies on removing large amounts of CO2 from the air. Part of that would come from reforestation and part from 5 that are still early in development.
What's working
Renewables have beaten forecasts. Global renewable electricity capacity grew three times faster than expected in 2015, and 6 capacity grew seven times faster. Global emissions in 2025 were roughly flat compared with 2024. Lead author Anne Olhoff called that a "welcome divergence" from decades of growth.
What isn't
Emissions from burning oil, gas and coal are still rising. Clean capacity is being added, but it isn't yet pushing fossil fuels out. The article doesn't explain why. A common reading is that growing energy demand is absorbing the new supply. Setu Pelz of the 7, a chapter co-author, argues that fossil-fuel targets for 2030–2040 need the same ambition the renewables build-out has shown.
Why the decimals matter
UNEP chief Inger Andersen said 1.5°C should stay the target because "every additional fraction of a degree matters." She pointed to Western Europe's heat last spring and summer, which killed thousands and included four of the region's 10 worst heat waves since 1950.
The article doesn't say how long the overshoot lasts or how much carbon removal the best case assumes.
The 1 has concluded in its latest annual 2 that limiting global warming to 1.5°C above 3 is no longer a realistic outcome. That holds even under the most ambitious emissions scenario the report models. In that best case, warming peaks at 1.7–1.8°C. Under the policies governments actually have in place, warming could reach 2.8°C by 2100.
What the report is measuring
The 2015 4 set a goal of keeping warming well below 2°C (3.6°F) while pursuing efforts to hold it to 1.5°C. Nearly every country adopted it, although the United States under President Donald Trump has withdrawn twice, most recently last year. UNEP's emissions gap report, published every year, compares the emissions path implied by national pledges and policies with the path each temperature goal requires. This year the report says the lowest path no longer stays under 1.5°C at all.
Robert Kopp, a climate scientist at Rutgers University, said the finding was not surprising. In his view 1.5°C sat at the edge of feasibility even in 2015. Each year of high emissions since then has used up more of the remaining carbon budget.
What the best case requires
The report sets out what its lowest-warming scenario requires. Global emissions would need to fall, relative to 2025 levels:
18% by 2030
45% by 2035
69% by 2040
Converting those targets to annual rates shows how hard they are. The following is our own illustrative arithmetic, not the report's. An 18% cut over five years works out to about 4% a year. Getting from there to 45% by 2035 needs roughly 8% a year. Getting to 69% by 2040 needs nearly 11% a year. For comparison, the pandemic-driven drop in 2020 was around 6–7%, and that came from an economic shutdown, not policy. The pathway asks for cuts larger than that every year, accelerating through the late 2030s.
The scenario also depends on removing substantial amounts of carbon dioxide from the atmosphere. Part of that would come from reforestation. Part would come from 5 that the article describes as still early in development. So even the 1.7–1.8°C figure assumes industries that barely exist yet are built out quickly.
Where things went better than expected
The report gives clean energy its due. Global renewable electricity capacity grew three times faster than was anticipated in 2015. Solar photovoltaic (PV) capacity grew seven times faster. Jan Minx, who leads the Evidence for Climate Solutions working group at the Potsdam Institute for Climate Impact Research and co-authored a chapter, called the warming outlook "bleak". He also said wind and solar have beaten expectations.
Global emissions in 2025 were about the same as in 2024. Anne Olhoff, director of the UNEP Copenhagen Climate Centre and the report's lead author, called that a "welcome divergence" from decades of growth.
The part that isn't working
Emissions from burning oil, gas and coal are still rising. The rapid growth in clean capacity has not yet pushed fossil combustion down. The article doesn't say why. The common explanation in the field is that rising energy demand has absorbed much of the new clean supply, so renewables have been adding to the energy mix rather than displacing fossil fuels. Setu Pelz of the 6, another chapter co-author, said countries need to keep up the pace to meet the goal of tripling renewable capacity by 2030. That goal was agreed at the 2023 UN climate summit. Pelz framed the report as evidence for setting fossil-fuel phase-down targets for 2030, 2035 and 2040 that are as ambitious as the renewables build-out has been.
Why the overshoot size still matters
UNEP executive director Inger Andersen said the findings are no reason to drop 1.5°C as a target. In her words, "every additional fraction of a degree matters". Every extra year above 1.5°C makes floods, heatwaves and wildfires worse. The article points to Western Europe, where thousands of people died from heat last spring and summer. That period included four of the region's 10 most severe heat waves since 1950. Asked what a world above 2°C would look like, Andersen pointed to Europe's recent heat, wildfires in Scandinavia, and droughts and harvest failures, all happening "much more frequently".
What the article leaves open
The article doesn't say how much carbon removal the best-case scenario assumes, how long warming stays above 1.5°C, or whether and when temperatures come back down. It also doesn't give the report's estimate of where current national pledges, as opposed to current policies, would lead. And it doesn't break the fossil-emissions rise down by country or sector. Those details decide how much of the 1.7–1.8°C figure depends on emissions cuts and how much depends on carbon removal that hasn't been built yet.
Remember
Getting to 1.7–1.8°C would mean emissions cuts accelerating to about 11% a year by the late 2030s, plus large-scale carbon removal.
Solar PV capacity grew seven times faster than 2015 forecasts, yet emissions from burning fossil fuels are still rising.
Global emissions were flat in 2025 compared with 2024, the first break from a long growth trend that the report highlights.
Google is making its 1 (VPP) deal with Voltus about ten times larger. A VPP pools many small, flexible resources so they can be dispatched like one power plant. In June the companies signed a 100 MW agreement in 2, the largest US wholesale power market. On Thursday they added 1,070 MW, for roughly 1,170 MW in total. Voltus, a 3 company, expects to reach full size in three to four years and to run the plant under contract with Google through 2040.
Why PJM needs it
PJM runs the grid for 13 states and Washington, D.C. Data center growth has pushed its 4 prices to record levels. These auctions pay resources to be available years ahead. Even so, PJM has fallen short of its reliability margins. New power plants take years to build and connect, but cutting peak demand can be organized faster.
How it works
Google pays Voltus to sign up homes, businesses and factories. Their batteries, smart thermostats, on-site generators and adjustable industrial processes can cut or shift power use. Voltus pools these resources and offers them into PJM's market when the grid is strained.
Voltus CEO Dana Guernsey compares these contracts to the 5, long-term commitments from corporate buyers, that made utility-scale wind and solar financeable. A long contract gives the aggregator steady funding to recruit customers. The article doesn't disclose what Google pays or how it counts the capacity toward its own use.
The numbers
PJM's market monitor, 6, reported that demand response revenue rose 240% from 2024 to 2025, to $523.5 million. Most of the increase came from higher capacity prices.
Emergency demand response, which is called only when the grid is under stress, made up 88% of that revenue.
Voltus says PJM users can earn up to $350,000 per MW-year.
Voltus has about 8.5 GW under contract across North America. It aims for 20 GW by 2030 and just raised $225 million.
A Brattle Group report argues that VPPs can lower rates for everyone by reducing peak demand.
The policy backdrop
Monitoring Analytics wants data centers to bring their own new generation before connecting to the grid. PJM proposed a "bring your own new capacity" framework that would have cut power to large loads without new supply during grid stress. The 7 largely rejected it this month. Google describes this deal as bringing "our own capacity" anyway.
Caveats
The added 1,070 MW is a target several years away. The article doesn't say how much of it will be resources newly added to the grid rather than ones that would have enrolled anyway. Pooling thousands of small sites for emergencies at gigawatt scale is still largely untested.
Google is making its 1 contract with Voltus about ten times larger. In June the two companies signed a 100 MW deal in 2, the largest US wholesale power market. On Thursday they announced another 1,070 MW, which brings the total to roughly 1,170 MW. Voltus is a San Francisco company that runs 3, meaning it pays customers to use less power on request. A spokesperson said Voltus expects to reach full capacity in three to four years and to operate the plant under contract with Google through 2040.
The problem: PJM is short on capacity
PJM runs the grid in 13 states and the District of Columbia. Its capacity market pays resources to be available in future years, so supply is there for the hours when demand peaks. Demand from data centers has climbed fast, and 4 prices have soared. PJM has still fallen short of its reliability margins.
Building new power plants and connecting them to the grid takes years. Reducing demand at peak can be organized faster. Demand-side resources are spread across thousands of sites, though, and someone has to recruit them, add up their capacity and make sure they respond when called.
How the deal works
Google pays Voltus to aggregate distributed resources from residential, commercial and industrial customers. The resources can include:
batteries
smart thermostats
on-site generation
industrial process adjustments, such as shifting or pausing energy-intensive work
other flexible assets that can cut energy use
Voltus combines them and offers the pool into PJM's market when the grid is strained. To the grid operator, the pool acts like a power plant that can be dispatched. It works by taking load off the system rather than adding generation, though batteries and on-site generators can do some of both.
Voltus CEO Dana Guernsey has compared these contracts to 5 (PPAs), the long-term deals in which corporate buyers committed to purchase output from wind and solar farms. Those guaranteed revenue streams made new projects financeable. Her argument is that a 14-year contract from a buyer like Google can do the same for distributed resources: it gives an aggregator steady funding to sign up customers and install equipment.
The article doesn't give the price Google pays. It also doesn't say how Google counts the capacity against its own consumption, whether the resources must sit near its data centers, or how many of them are newly enrolled rather than already in PJM programs.
The money in PJM demand response
6, PJM's independent market monitor, reported that demand response revenue in PJM rose 240% from 2024 to 2025, to $523.5 million. Most of the increase came from higher capacity prices. Emergency demand response, which is called only when the grid is under stress, made up 88% of that revenue. In PJM today, most demand response earns its money by being on standby for rare emergencies, not by trimming load every day.
Voltus says PJM energy users can earn up to $350,000 per MW-year from demand response payments. As an illustrative ceiling only: if all 1,170 MW earned that top rate, the total would be about $410 million a year. Actual earnings depend on auction prices, how resources perform, and how revenue is split among Google, Voltus and the participating customers.
A Brattle Group report released this month argues that VPPs can also lower electricity rates for everyone by reducing peak demand. Peak demand drives how much capacity has to be bought and built.
Context: the "bring your own capacity" fight
The deal comes during a policy fight over large new loads. Monitoring Analytics has pushed for rules requiring data centers and other big loads to supply their own new generation before they connect to the grid. Earlier this year PJM proposed a "bring your own new capacity" framework. It included a plan to cut power to large loads that hadn't brought new supply whenever the grid was stressed. The 7 (FERC), which oversees wholesale power markets, largely rejected that plan this month.
Google's own wording echoes the debate. Ellen Zuckerman, Google's head of energy market development for North and South America, called the expansion part of its effort to "actively bring our own capacity to the grids that serve us." Voltus also runs an initiative it calls Bring Your Own Capacity. The company has about 8.5 GW of distributed assets under contract across North America and aims for 20 GW by 2030. It recently raised $225 million.
Scale against other VPPs
At about 1.17 GW, the Google-Voltus plant is far larger than the other recent announcements the article lists:
a 150 MW, $500 million VPP from Budderfly and Schneider Electric
a 16 MW VPP from Sunrun, Renew Home and Tesla
a VPP offered by Pacific Gas & Electric with partners including Google, Rewiring America, Carrier, Tesla and Sunrun
What stays open
There are three main questions:
Delivery. The 1,070 MW addition is a target to be built over three to four years. It is not capacity that exists today.
Additionality. The article doesn't say how much of the pool will be resources newly added to PJM rather than demand response that would have enrolled anyway. That decides how much new capacity the grid actually gains.
Performance. Emergency demand response rarely gets called. Its reliability depends on thousands of separate sites responding at the same moment, at a large scale PJM hasn't fully tested.
FERC's rejection of PJM's framework leaves the rules for large loads unsettled. For now, voluntary contracts like this one are how data center owners show they are adding capacity.
Remember
Most PJM demand response revenue (88%) comes from standby for grid emergencies, not everyday load trimming.
Voltus pitches long contracts as the PPA equivalent for distributed resources: guaranteed revenue that pays for recruiting customers.
Federal regulators rejected PJM's rule for large loads, so voluntary deals like this fill the gap for now.
Near Phoenix, 2019: an explosion sent four emergency responders to hospital with serious injuries. It remains the only significant bodily harm caused by a US grid battery fire.
4, California, January 2025: one of the first very large battery installations caught fire. Nobody was injured, but the plant was largely destroyed and nearby residents were evacuated for several days. Opponents of new storage projects across the country now regularly cite it.