The Missing $532 Billion in Interest · Morning Gist
Saturday, October 105 stories · 15 min
The Missing $532 Billion in Interest
Today: US income was bigger than reported, how the Fed decides which price spikes count, and higher rates are leaving the housing market with more listings and fewer sales.
Picked from 48 new articles across 16 sources · arrow keys for other days
Today in 30 seconds
30s left
US statisticians raised their estimate of business interest payments by 86%, or $532 billion. That lifts total US income about 2%, but the tax data behind it only runs through 2023. story 1 ↓
The NY Fed's research chief explains why the Fed looks past some price shocks but reacts to others, and why inflation expectations matter so much. story 2 ↓
As rates rise again, savers earn over 4% on T-bills, while home sales stay below 4 million a year and apartment construction falls. story 3 ↓
Early local data puts September home sales down about 5% from a year ago, while inventory rose 9.4%, giving buyers more leverage. story 4 ↓
IRS data show 64% more high earners left California than moved in during 2022-23. One economist blames the state's tax mix, not its jobs. story 5 ↓
About half of this year's European defense-tech funding came from US investors, partly because European funds face limits on what they can invest in.
1/5The Overshoot· Matthew C. Klein· Oct 9
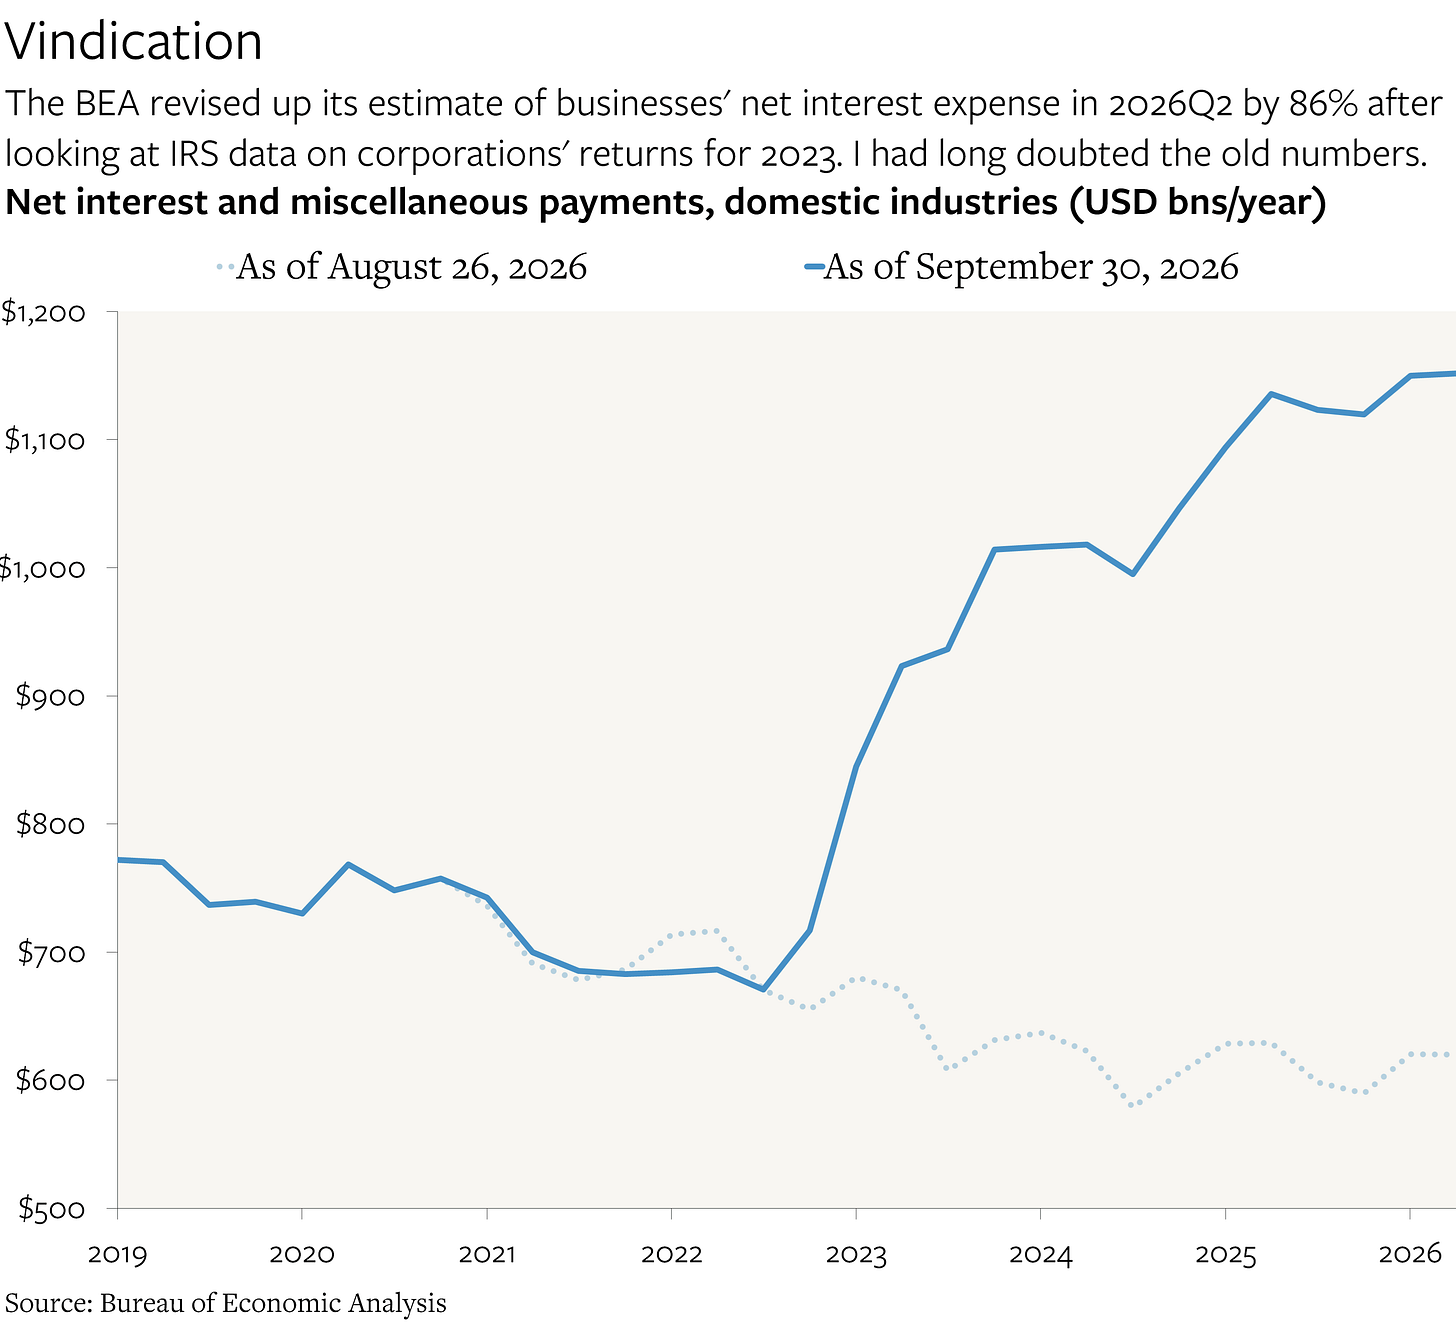
US statisticians revise business interest payments up 86%, adding $532 billion
The Bureau of Economic Analysis, which compiles US income statistics, revised five years of business net interest payments up by $532 billion a year. Matthew Klein had called the old figures implausible since 2023.
Why it matters · If interest income was undercounted, the economy and the income of savers and lenders were larger than official income data showed, and income-based growth measures were too gloomy.
Know this first
Context from the editor, not the article · 33 sec
The US measures its economy two ways: by adding up spending (gross domestic product, GDP) and by adding up incomes (gross domestic income, GDI). In theory the two match. The income side includes wages, profits, rents and net interest, meaning the interest businesses pay minus the interest they earn on cash and bonds they hold. Interest a company pays is income to whoever lent the money, so getting it wrong distorts the picture of who is earning what. These figures come from the Bureau of Economic Analysis (BEA), a Commerce Department agency. Detailed corporate tax data reaches it with a long lag, so it fills recent years with estimates. From 2022 to 2023 the Federal Reserve raised short-term interest rates from near zero to above 5%.
How much the BEA's revision raised net interest payments by domestic industries1 / 3
2/5Liberty Street Economics (NY Fed)· Oct 9
NY Fed research chief explains how the Fed fights inflation without setting prices
The New York Fed's research director, Kartik Athreya, argues the Fed doesn't need to control individual prices. Its job is to keep people expecting low inflation, so price jumps in one sector don't spread to the rest.
Why it matters · It explains why the Fed brushes off some grocery or gas price spikes but reacts to others, and why its talk about inflation expectations matters as much as rate moves.
Know this first
Context from the editor, not the article · 30 sec
Congress gives the Federal Reserve a "dual mandate": stable prices and maximum employment. In practice, price stability means inflation of about 2% a year, measured by the PCE price index. The Fed's main tool is the federal funds rate, a short-term interest rate set by its policy committee, the Federal Open Market Committee (FOMC). Raising that rate slows borrowing and spending. Cutting it does the opposite. Economists also watch inflation expectations: what households and businesses think prices will do. Those expectations shape how firms set prices and how workers bargain over wages. This post is part of "Street Level," a plain-language column on the New York Fed's Liberty Street Economics blog, written by its research director.
inflation expectations
What households and firms believe future inflation will be. These beliefs feed into how firms set prices and how wages are bargained.
Image: Liberty Street Economics (NY Fed)
3/5A Wealth of Common Sense· Ben Carlson· Oct 9
Who gains and who loses as interest rates climb again
Ben Carlson sorts the winners of rising rates (savers, retirees, cash-rich firms, people with locked-in loans) from the losers (homebuyers, car buyers, small businesses, taxpayers, renters). He concludes the harm now outweighs the benefits.
Why it matters · Your mortgage, car payment, savings yield and future rent all depend on rates, and Carlson's tally shows which of these move in your favor.
Know this first
Context from the editor, not the article · 26 sec
Interest rates are the price of borrowing, and they set the return on saving. The Federal Reserve (the Fed), the US central bank, raises its policy rate to cool inflation. Market rates on Treasury bills, bonds, mortgages and car loans tend to move with it. For most of the 2010s, rates sat near zero, and in the early 2020s many households and companies locked in very cheap long-term loans. Starting in 2022, rates rose sharply to fight post-pandemic inflation. Ben Carlson, a wealth manager who writes the blog A Wealth of Common Sense, wrote this post because rates are rising again.
Fixed income
Investments such as bonds that pay scheduled interest, as opposed to stocks.
US existing-home sales have stayed low for years, even as the population has grown.1 / 4
4/5Calculated Risk· CalculatedRisk by Bill McBride· Oct 9
Early local data shows September home sales down about 5% from last year
Bill McBride tracks markets that report sales early. In those markets, September closed home sales fell 4.8% from a year earlier and inventory rose 9.4%. That points to another weak national sales report next week.
Why it matters · More homes for sale and slower sales give buyers more bargaining power. That can affect prices and how you time a home purchase.
Know this first
Context from the editor, not the article · 31 sec
The National Association of Realtors (NAR) publishes the main monthly count of US existing-home sales, meaning resales of homes that aren't newly built. Many local real estate boards and multiple listing services release their numbers earlier, so analysts like Bill McBride of Calculated Risk use them to preview the national figure. One timing detail matters: NAR counts a sale when it closes, usually 30 to 60 days after the contract is signed. Each month's closings therefore reflect the mortgage rates buyers faced one or two months earlier. US existing-home sales have stayed near 4 million a year since 2023. That is well below the pre-pandemic pace, because high mortgage rates hold back both buyers and owners who would otherwise sell.
Existing-home sales by month, 2025 compared with 2026, at seasonally adjusted annual rates.1 / 4
5/5Marginal Revolution· Tyler Cowen· Oct 10
Economist argues California's taxes, not its jobs, are driving high earners away
Economist Philip Graves argues that California's weather and coast should draw people in. Instead, he says, the state takes the value of those perks through income taxes and limits on housing, which pushes high earners out.
Why it matters · It shows how a state's choice of what to tax decides who moves, which in turn shapes housing markets, the tax base and where jobs end up.
Know this first
Context from the editor, not the article · 35 sec
Philip Graves is known for the "amenity" view of migration. In this view, Americans move mainly toward pleasant places (mild weather, coastline, scenery) rather than toward jobs. A nice place is worth something, so people will accept lower wages or higher rents to live there. Economists call that extra value a location rent. Someone ends up collecting it: landlords, landowners or the government.
Proposition 13, a California ballot measure passed in 1978, limits property tax to about 1% of a home's assessed value. That assessed value can rise by at most 2% a year until the home is sold. Long-time owners therefore pay far less than recent buyers and lose that discount if they move. Tyler Cowen highlighted the paper on his blog Marginal Revolution and gave only its abstract, so the full methods aren't shown.
Image: Marginal Revolution
The puzzle
Graves argues that California has the natural amenities that should make it a steady net gainer of Americans moving between states. It has both mild weather all year and a mix of climates within reach. Yet more residents have left it for other states than arrived every year since about 1990. His explanation is that the amenities haven't changed. What changed is who captures the value they create: the state, through politics.
The 1 has revised five years of business interest data. The change confirms a complaint Matthew Klein, author of The Overshoot newsletter, has made for three and a half years.
The revision
The BEA used the newest corporate tax data it has, which only covers 2023. With it, the agency raised its estimate of "2 and miscellaneous payments, domestic industries" by 86%, or $532 billion at an annual rate. That lifted its estimate of total income generated in the US by about 2%. Before the fix, the official figure for US corporations' net interest payments in the second quarter of 2026 was negative. In other words, companies as a group were supposedly earning more interest than they paid.
Why the old numbers looked wrong
The old data showed net interest paid by 3 (ordinary companies, not banks or insurers) falling at the fastest yearly pace on record between the third quarter of 2022 and the third quarter of 2023. That was the period when interest rates rose fastest. Klein grants that companies had "4" their debt in 2020–21, locking in cheap long-term fixed rates. He argues that still couldn't explain the drop:
Borrowing costs had soared.
Companies as a group owed far more debt than they held in interest-earning assets.
They had been adding debt faster than they added cash.
Much of their debt was 5, whose interest rises with market rates, not fixed-rate bonds.
He adds that much of the borrowing since early 2022 was relatively high-yield floating-rate debt. It came from 6 funds, which lend directly instead of through banks, and from hedge funds and nonbank finance companies. Some of these loans were bundled into 7.
Klein's evidence came from the Federal Reserve's 8, which track sector balance sheets, debt issuance and cash holdings, along with market yields on bonds, loans and money market funds. A 2024 revision had already partly fixed the same error for noncorporate businesses, but not for corporations.
He does note one point on the other side. The gap between nonfinancial corporations' debt and the bonds and loans they hold as assets has stayed flat at about $10.2 trillion since late 2022. Such plateaus are normal after borrowing booms, as in the early 1990s and early 2000s. But a flat gap while rates were climbing should still mean rising net interest, not falling.
What's missing
The excerpt stops before Klein explains how the BEA builds its estimates, where the missing interest income ended up, and what the revision means for the economy today. It also shows a weakness in the system itself: the benchmark data behind these revisions is about three years old.
Remember
Official data showed corporate net interest collapsing exactly when rates rose fastest. That was a measurement error, not reality.
Revisions depend on corporate tax data that is years old, so recent income-side figures can be badly off.
Cross-checking with Fed balance-sheet data and market yields can flag implausible official statistics before they're revised.
Kartik Athreya, research director at the New York Fed, sets out what he calls an apparent paradox. The Fed is charged with price stability, yet it sets no actual prices. He quotes Fed Chairman Warsh at the 1's September press conference: "we cannot affect any individual price, whether it be oil prices, whether it be foodstuffs at the grocery store."
What inflation actually measures
Athreya's answer starts with a definition. Inflation is a budget-weighted average of price changes across everything consumers buy. The Fed's preferred gauge, the 2, covers more than 300 categories of goods and services. Each item counts in proportion to its share of household spending. Food takes up close to 10% of a typical budget. Pumpkin products barely register.
So the Fed's job is narrower than managing what specific things cost. It is to keep the typical price change small from month to month and year to year.
Two kinds of shock
A narrow shock. Suppose the world suddenly wants far more pumpkin pie. Pumpkin prices have to rise, or shelves go empty. But pumpkins are a tiny slice of spending, and other prices may be falling at the same time for their own reasons. Overall inflation barely moves. For shocks like this, Athreya says, the Fed's response is "It doesn't have to!"
A broad shock. Now suppose demand for fertilizer is expected to grow much faster than the world can produce it, say because of faster growth in Africa or Asia. Every food price faces lasting upward pressure, and food is a sizable share of budgets. Price cuts elsewhere won't cancel that out. In the short run, measured inflation will be higher. The only way to stop that would be very aggressive Fed tightening, which would likely push unemployment up.
Why expectations are the mechanism
Athreya argues the longer run need not be grim. The broad shock stays temporary as long as households and firms outside the food sector keep expecting low, stable inflation. If they do, only fertilizer users and food sellers raise prices, by enough to cover their real cost increase. Everyone else keeps prices on their usual path. The 3, food getting dearer compared with other goods, is how a market signals that something has become scarcer. That part is supposed to happen.
The danger is that unaffected businesses read a narrow spike as the start of general inflation. They then raise their own prices to protect themselves, and the spike becomes self-reinforcing. Athreya says the Fed prevents this in two ways. It states its low-inflation goal clearly. Then it backs that up by setting the short-term interest rate at the right level relative to the "4," the rate that neither speeds up nor slows down the economy. The post doesn't say how to estimate that rate.
The post is a conceptual explainer, not new research. It includes no data on current inflation or on how well the 2025–26 tariffs have stayed contained, though it links to other posts on those topics.
Remember
Inflation is a spending-weighted average, so price spikes in small budget items barely move it.
Broad shocks to big categories like food lift inflation for a while, unless the Fed tightens hard and accepts more unemployment.
The Fed's main defense is credibility: stopping unaffected firms from raising prices because they expect general inflation.
Ben Carlson starts from a simple point: every shift in the economy creates winners and losers. With rates rising again, he sorts out who is on each side and concludes that, on balance, the damage is bigger than the benefit.
The winners
Savers.1 (short-term US government debt, or T-bills) pay more than 4%. Savings accounts, 2 (CDs) and money market funds pay about the same.
Bond investors. High-quality bonds yield well over 5%, and riskier parts of the bond market yield 6–7%. In Carlson's words, fixed income "actually provides income again."
Retirees. They rode a decade of rising stock and house prices. Now, as they move into safer assets, those assets pay real yields and annuity rates are higher.
Cash-rich companies, which can earn a return on their cash with little risk.
Anyone who locked in cheap debt. Carlson calls the 3% mortgage "the best inflation hedge in history."
The losers
The renter "doom loop"
Carlson argues renters are the most important loser. While rates were low, developers built many apartment buildings. That new supply held rents roughly flat for several years after they jumped early in the decade. Apartment construction has now "fallen off a cliff."
He quotes Torsten Slok, an economist at the investment firm Apollo: higher rates mean less building, less building means higher rents, and higher rents push inflation up, which keeps rates high. The effect is large because 4 makes up about a quarter of the 5 (CPI). Owners' equivalent rent is the government's estimate of what homeowners would pay to rent their own homes.
Carlson isn't calling for a return to zero rates. His argument is that today's rates will keep hurting the economy for years.
Remember
Higher rates help people with cash and hurt people who need to borrow now, especially homebuyers and small firms with floating-rate debt.
Big corporations and 3%-mortgage homeowners are largely shielded from higher rates, for now, because they locked in cheap fixed-rate debt.
Fewer apartments being built today could lift rents and inflation for years, keeping rates high.
In the local markets that report early, September closed sales were down 4.8% year over year. That figure is not seasonally adjusted (1), meaning it is the raw count. In August, the same markets were down 7.1%, so sales are still falling but at a slower rate.
September 2026 and September 2025 both had 21 working days. McBride notes this means the raw year-over-year change should be close to the seasonally adjusted change 2 will report, though other seasonal factors can still move it.
NAR releases its September figure on Tuesday, October 13, earlier in the month than in past years. Forecasters expect 3.96 million on a seasonally adjusted annual rate (3) basis. SAAR is the monthly pace scaled up to a full year and adjusted for normal seasonal swings. The forecast is slightly below August's 3.98 million and below the 4.08 million of September 2025. McBride concludes that the national number will probably show a year-over-year decline.
Compared with September 2019, sales are down sharply in every market he tracks.
The rate surge hasn't shown up yet
September closings mostly came from contracts signed in July and August. The average mortgage rate was 6.54% in July and 6.67% in August, higher than the rates behind August's closings. McBride also points to a more recent jump in mortgage rates. It will probably reduce contracts signed in September and October, but those deals won't close and appear in sales data until later reports.
Supply is building
4 (homes newly put on the market) rose 3.3% year over year, up from 1.4% in August. Compared with 2019, the picture varies by market.
5 (all homes currently for sale) rose 9.4% year over year, up from 5.4% in August. McBride writes that the year-over-year increase in inventory "is picking up." Inventory is now above 2019 levels in most of these markets. San Diego is the exception.
Caveats
This sample covers only a few early-reporting markets. The article's tables list them, but the text names only the Seattle area as a new addition. The 2019 comparisons include only markets that have 2019 data. The national result could differ from these local numbers.
Remember
Closings lag contracts by one to two months, so this report doesn't yet reflect the recent jump in mortgage rates.
Inventory growth sped up from 5.4% to 9.4% year over year, which gives buyers more choice.
Sales remain far below 2019 levels, while inventory now exceeds 2019 levels in most markets tracked.
Graves says the method of capture decides whether people leave:
A 1 would fall on landowners. Land can't move, so the tax would drive no one away.
Taxes on 2, above all a 3, do drive people away, because a household can take its income to another state.
Limits on new housing also raise the cost of living there and push people out.
He then adds a second effect. When tax revenue pays for 4, high earners pay much more than the value of the public services they get back, which gives them another reason to leave. Employers must also pay higher pre-tax wages to make up for the income tax, so jobs leave along with households.
5 makes this worse, Graves argues, in two ways. Capping property tax pushes the state to rely more on income taxes. It also ties long-time owners to their low tax bills. So the out-migration we can see understates the real pressure to leave: many people who would otherwise go stay put.
The numbers
IRS data for 2022-23:
Group
Out-migrants per in-migrant
All households
1.40 (40% more leaving)
Households earning $200,000+
1.64 (64% more leaving)
In low-tax states the pattern runs the other way: high earners make up a larger share of people arriving than of people leaving.
A comparison across all states finds no link between tax burdens and natural amenities. Graves takes this as a sign that competition among pleasant states limits how much any one can charge. California charges well beyond its neighbors and loses residents to them in disproportionate numbers. He says comparisons of areas on either side of state borders, and data on how long homeowners stay, fit the argument.
Caveats
The paper admits that its cross-state comparison can't hold 6 constant. California's tech and entertainment clusters, for example, could pull people in or push them out for reasons unrelated to taxes. The abstract also doesn't show how big the border or length-of-residence effects are, so how strong that evidence is can't be judged from this excerpt.
Remember
Graves argues a land tax would drive no one away, while income taxes and limits on new housing push mobile, high-earning households out.
Proposition 13 hides the pressure to leave: low tax bills keep long-time owners from moving.
The gap in departures was widest among $200,000+ households: 64% more left than arrived, versus 40% overall.
Homebuyers. A 7% mortgage rate isn't high by historical standards. The trouble is that home prices were set when rates were 3%, and buyers now face both. Around 2000, more than 5 million existing homes sold each year in a country of 280 million people. Today fewer than 4 million sell, with nearly 65 million more people.
Car buyers. Auto loan rates average over 7%, and vehicle prices are up almost 30% this decade. The average new-car payment is close to $800 even though a quarter of new loans run 84 months. More than 20% of new loans carry payments of $1,000 or more.
The federal government. Interest costs on trillions of dollars of pandemic-era debt keep climbing. Carlson admits he wrongly expected policymakers to keep rates low for that very reason.
Small businesses. Large corporations locked in low fixed rates, so their net interest costs as a share of profits haven't risen. Smaller firms often borrow at 3, which reset higher when market rates rise.
Risky "yield products." These were sold as bond substitutes when rates were near zero. Carlson considers losing them a good thing, because safe bonds now compete with them.