The Fed is raising rates again after concluding policy was never tight, while home prices stall and its own model sees slow growth and sticky inflation.
Picked from 107 new articles across 16 sources · arrow keys for other days
Today in 30 seconds
30s left
The Fed hiked to 3.75–4% in September; Matthew Klein says two years of cuts misread a strong economy as fragile. story 1 ↓
Case-Shiller home prices rose 1.5% in the year to June, below inflation; list prices have trailed year-earlier levels ten straight months. story 2 ↓
Property-tax cuts for homeowners push school and police costs onto commercial property, rentals and states, and may lift prices, a paper argues. story 3 ↓
Mr. Money Mustache tells retirees not to fear an AI bubble: $100,000 invested amid similar worries in 2006 became $852,000. story 4 ↓
The New York Fed's model now sees 3.3% core inflation in 2026 and just 0.1% growth in 2027. story 5 ↓
1/5The Overshoot· Matthew C. Klein· Sep 24
The Fed raises rates and admits policy wasn't actually tight
On September 16 the Federal Reserve raised its key rate band to 3.75–4%. Matthew Klein argues this shows officials finally accept that strong demand, not tariffs or oil shocks, is keeping inflation high.
Why it matters · If the Fed now expects rates to rise through 2027, borrowers, savers and bond holders face a different outlook from the falling-rate path officials projected only a year ago.
Know this first
Context from the editor, not the article · 27 sec
1 · The Fed's rate target
The Federal Reserve sets a target range for the overnight rate banks charge each other, the federal funds rate. Mortgage, loan and savings rates throughout the economy follow its changes.
2 · The dual mandate
Congress gives the Fed two goals: maximum employment and stable prices, which the Fed defines as 2% yearly inflation. Usually it cuts rates when jobs look weak and raises them when inflation runs hot.
3 · The dot plot
Four times a year each Fed official anonymously projects where they think the policy rate should be at the end of the next few years. Plotted together as dots, the projections show which way the committee is leaning.
2/5Calculated Risk· CalculatedRisk by Bill McBride· Sep 21
US home prices have barely moved in four years and are now cooling
Bill McBride of Calculated Risk reviews US house prices for mid-September 2026. List prices have moved sideways since rates jumped in 2022. The main repeat-sales index is up just 1.5% from a year earlier.
Why it matters · For buyers, sellers and owners, a flat market where prices rise more slowly than inflation means homes are slowly losing real value. That changes the math on whether to buy now or wait.
Know this first
Context from the editor, not the article · 29 sec
1 · Two ways to measure prices
Median prices are the middle price of whatever homes happened to list or sell, so they move when the mix of homes changes. Repeat-sales indexes such as Case-Shiller track the same homes over time, which strips out most of that mix effect.
2 · How Case-Shiller is reported
The S&P CoreLogic Case-Shiller indexes come out about two months late and average three months of sales. The "June" reading mostly reflects deals agreed in spring. It comes in national, 10-city and 20-city versions.
3 · Seasonal adjustment
Home prices rise every spring and soften every fall. Seasonally adjusted (SA) figures remove that pattern so month-to-month changes mean something. Not seasonally adjusted (NSA) figures are the raw data, best compared year over year.
States are cutting homeowners' property taxes, and that may raise home prices further
After home values jumped post-COVID, several US states cut property taxes on owner-occupied homes. Some considered abolishing them. Economist Timothy Taylor, summarizing a new paper, argues this mostly helps existing owners and makes homes costlier for buyers.
Why it matters · If you own a home, plan to buy one, or rent, these reforms change what housing costs you, who pays for local schools and police, and how much those services can count on.
Know this first
Context from the editor, not the article · 24 sec
1 · How property taxes work
Local governments assess each property's market value and charge a percentage of it every year. A $400,000 home taxed at 1.5% owes $6,000, whatever the owner's income that year.
2 · Who funds local services
In most of the US, property taxes are the main revenue local governments raise themselves. They are the main funding source for public schools and often pay for police.
3 · The post-COVID housing run-up
US home prices climbed steeply after 2020, especially in suburbs. Higher assessed values led to bigger property tax bills, even where rates stayed the same. Meanwhile, many commercial properties, such as office buildings, lost value.
4/5Mr. Money Mustache· Mr. Money Mustache· Sep 25
Mr. Money Mustache argues an AI bubble shouldn't scare retirees
The early-retirement blogger Mr. Money Mustache says fear of an AI stock crash misses the point. In his view, wealth comes from productivity, and AI should raise it. He also gives practical ways to manage financial fear.
Why it matters · Record AI-driven stock valuations have many savers wondering whether to retire, sell or wait, and this piece makes the long-horizon case for staying put.
Know this first
Context from the editor, not the article · 28 sec
1 · The dot-com crash
In the late 1990s, investors bid up internet stocks far ahead of their profits. From its March 2000 peak to late 2002, the tech-heavy Nasdaq index fell about 78%. It is the usual comparison for today's AI boom.
2 · The early-retirement movement
FI, short for financial independence, is a movement of people who save heavily and live off index-fund portfolios, often decades before 65. A big market crash early in retirement is the risk they fear most.
3 · Who is Mr. Money Mustache
Pete Adeney, a former software engineer, retired around age 30 and has blogged about frugality and index investing as Mr. Money Mustache since 2011. He is among the best-known voices in the FI movement.
5/5Liberty Street Economics (NY Fed)· Sep 18
New York Fed model now sees slower growth and stickier inflation through 2029
In its September 2026 update, the New York Fed's in-house economic model kept 2026 growth at 1.2 percent. It cut growth forecasts for 2027–2029 and raised its inflation forecasts, partly because it now expects weaker productivity.
Why it matters · The Fed's research staff use this model when they forecast, so how it changes hints at how they weigh tight money, AI spending and productivity against inflation.
Know this first
Context from the editor, not the article · 29 sec
1 · What a DSGE model is
A dynamic stochastic general equilibrium model describes the whole economy as households, firms and a central bank, each following set rules. Random 'shocks' push the economy around. Economists fit it to data, then simulate where things are likely to go next.
2 · Core PCE inflation
The Fed targets 2 percent inflation as measured by the personal consumption expenditures (PCE) price index. The 'core' version drops food and energy, whose prices jump around, so it shows the underlying trend more clearly.
3 · The natural rate, r*
r* ("r-star") is the inflation-adjusted interest rate that neither speeds up nor slows down the economy. When the Fed's real rate sits above r*, policy is restrictive. When it sits below, policy is stimulative.
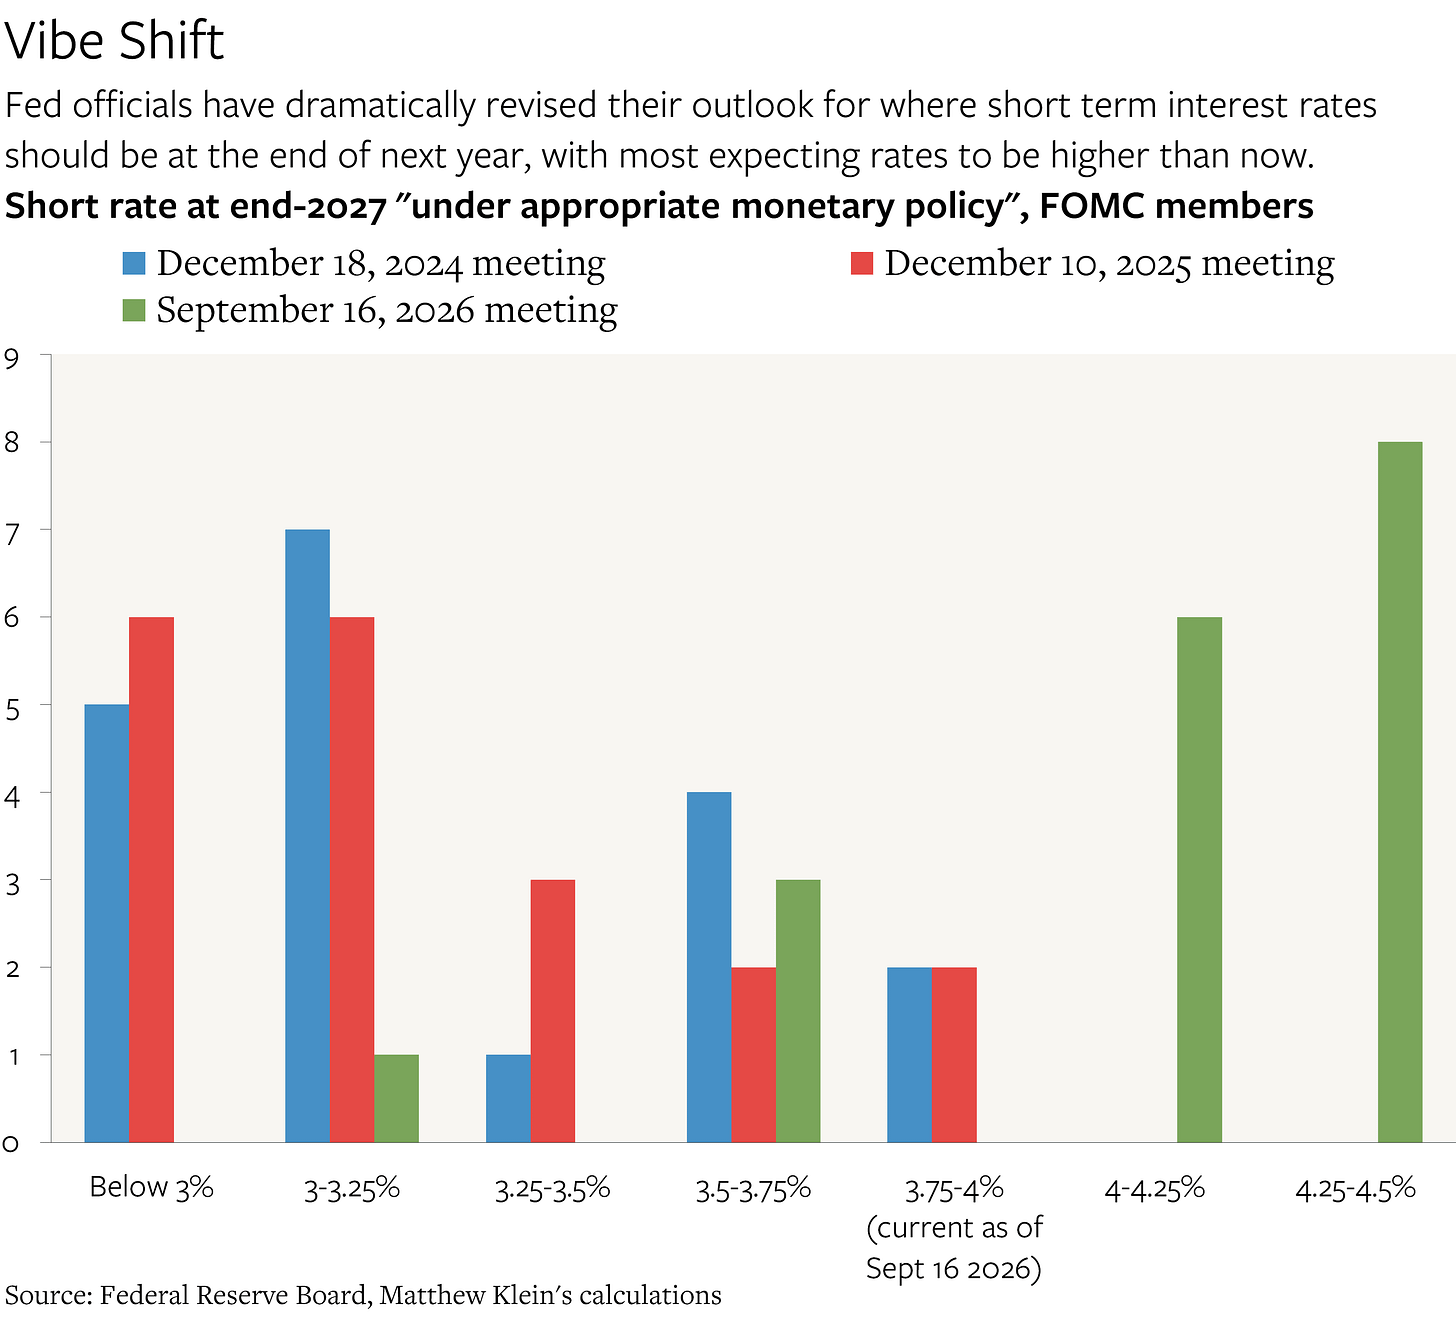
Probably the Fed dot plot: officials' projected end-of-year policy rates, now tilted toward higher rates.1 / 3
On September 16, 2026, the Federal Reserve raised its short-term interest rate target from 3.5–3.75% to 3.75–4%. Matthew Klein, who writes The Overshoot, reads it as an admission of error. In his view the Fed cut rates by mistake twice, in September–December 2024 and again in September–December 2025, because it kept underestimating both the strength of the economy and how fast prices were rising underneath.
What changed in the Fed's language
Fed chair Kevin Warsh called the hike "remov[ing] a dose of 1." Accommodation means rates low enough to boost the economy. He did not call it tightening. As recently as January, Governor Christopher Waller and New York Fed President John Williams described policy as "2," meaning high enough to slow the economy. Warsh said officials now "were hard-pressed to describe it that way."
The officials' own projections, known as the 3, have moved too. Almost all of them now expect the policy rate to be higher at the end of 2027 than it is today. At the end of 2025 none expected that, and most saw rates at 3.25% or lower. Klein says the projections for end-2028 are still too low for an economy whose 4, meaning total income before adjusting for inflation, is growing about 6% a year.
Why it isn't tariffs or oil
Klein rules out the obvious explanations. Fed Board economists estimate tariffs have added essentially nothing to prices since last October. The St. Louis Fed finds tariffs never added more than 0.6 5 to year-over-year 6, which excludes food and energy. Shipping disruptions at the Strait of Hormuz and 7 should hurt growth at least as much as they raise prices, so they don't explain a hike either.
His explanation is demand. The prices most sensitive to domestic spending, and least affected by measurement quirks, have risen 1–2 percentage points a year faster than before the pandemic. They were speeding up even before the war with Iran.
The tell in the Fed's risk view
From mid-2022, Klein argues, officials treated every inflation shock (Russia's invasion of Ukraine, tariffs, deportations, the Iran war) as a threat to jobs as well. So their worries about inflation and unemployment rose and fell together. When ordinary demand, such as easy credit or strong business investment, drives the economy, those two worries shouldn't move together. That link has now broken. Officials are more optimistic about growth and jobs than at any time since before the pandemic. The free excerpt ends before Klein presents the balance-sheet and borrowing data he says explains why.
On September 16, 2026, the Federal Reserve raised its short-term interest rate target band by a quarter point, from 3.5–3.75% to 3.75–4%. Matthew Klein, author of the newsletter The Overshoot, treats the hike as the start of an atonement. He opens with Maimonides, the medieval Jewish philosopher, who wrote that you know someone truly regrets a mistake when, facing the same circumstances again, they act differently.
The mistake, in Klein's telling, goes back years. Fed officials "repeatedly underestimated both the strength of the U.S. economy and the underlying inflationary trend." He argues those errors led the Fed to cut rates wrongly twice, in September–December 2024 and again in September–December 2025. This time, with inflation still above target, they raised rates.
The words matter
The federal funds rate is the overnight rate banks charge each other, and the Fed's target band for it feeds through to borrowing costs everywhere. Officials judge their stance against an unobservable "neutral" rate that neither speeds up nor slows the economy. Above neutral, policy is "1." Below it, policy is "accommodative."
Fed chair Kevin Warsh called the September move "remov[ing] a dose of 2." That wording admits rates had been stimulating the economy. He did not call it a tightening or an increase in "restriction." This is a reversal. As recently as January, Governor Christopher Waller and New York Fed President John Williams were saying policy was at least somewhat restrictive. Warsh now says officials "were hard-pressed to describe it that way."
The 3 has flipped
Each quarter, every Fed official writes down the policy rate they think will be "appropriate" at the end of each of the next few years. Plotted together, these projections form the dot plot, published in the Summary of Economic Projections. Klein compares recent editions:
End of 2025: no official expected rates at the end of 2027 to be above the level of the time. Most expected big cuts, and the large majority put end-2027 rates at 3.25% or lower.
Now: almost every official expects end-2027 rates to be higher than today's 3.75–4%.
End-2028: projections have shifted noticeably even since March.
Klein, who wrote in January that markets might be underpricing the chance of hikes, says even the end-2028 projections still look "inconsistent with 4 growth of ~6% a year." Nominal income growth is total income growth before adjusting for inflation. The article doesn't spell out the reasoning. The usual intuition goes like this: if incomes are rising about 6% a year and the policy rate sits near 4%, borrowing stays cheap relative to how fast incomes and revenues grow, so the rate is unlikely to be holding the economy back. The article's charts, likely of these dot-plot distributions, show how far views have moved.
Ruling out tariffs and oil
Why did officials change their minds? Klein dismisses the two obvious candidates.
Tariffs. Klein calls them "old news." Fed Board economists estimate tariffs have had essentially zero effect on the price level since last October. St. Louis Fed economists estimate tariffs never added more than 0.6 5 to year-over-year 6, which strips out volatile food and energy. As of June, they explained only 0.4 points of the amount by which core inflation exceeded normal. Tariffs also act as a tax that reduces disposable income, so they weigh on growth and jobs. That is an argument against hiking, not for it.
Shipping disruptions. Commodity flows out of Arabia through the Strait of Hormuz and 7, the narrow strait at the mouth of the Red Sea, have been disrupted. That raises prices, possibly only for a while, but Klein argues it should hurt growth at least as much. A supply shock like this doesn't on its own justify higher rates.
The real driver: demand
Klein's explanation is that some officials have "belatedly realized" that underlying nominal growth is running too fast for the Fed's 2% inflation target, "and for largely benign reasons." In other words, the economy is strong, not broken.
His evidence is a measure he has tracked for years. He looks at prices that are most sensitive to domestic demand and least prone to measurement problems or one-off quirks. Those prices have risen 1–2 percentage points a year faster than in the years just before the pandemic, and they were accelerating in the months before the war with Iran. A chart in the piece appears to show this series. Here is an illustrative example, not Klein's figures: if this basket rose about 2% a year before 2020, it is now running at roughly 3–4%. That gap reflects sustained spending, not a single shock.
Why the Fed missed it: correlated risks
The most interesting part of the argument concerns how officials judged risks. The 8 gives the Fed two goals, maximum employment and stable prices, and officials regularly say whether they see risks to each tilted up or down.
Klein argues that from mid-2022 until recently, officials treated every inflationary force as a growth threat too: Russia's war on Ukraine, tariffs, deportations, the war with Iran. Each looked like a supply shock that raises prices and costs jobs. So their worries about inflation and about employment moved together. When one rose, so did the other, and the Fed leaned toward caution and cuts.
But if the economy is driven by "normal" demand factors, such as households' access to credit or businesses' appetite to invest, the pattern should look different. Strong demand pushes up both jobs and prices, so the risk of high inflation rises while the risk of weak employment falls. The two risk assessments should be unrelated or move in opposite directions.
Klein says that shift has now happened. Officials are more bullish on growth and employment, and less worried about downside risks, than at any time since before the pandemic.
What's left open
The free portion ends just as Klein turns to "the latest data on private sector balance sheets, borrowing, and asset purchases," which he says helps explain the Fed's new optimism. That evidence isn't available here. The excerpt also leaves some questions unanswered. How many more hikes would the 6% nominal-growth logic imply? Is Warsh's committee united on this, or is the change driven by a few officials? And how would the Fed respond if the Gulf disruptions worsen and growth weakens? Klein's case rests on his own inflation measure and his reading of the dot plot. Both are reasonable, but they are one analyst's argument, and the Fed has not officially endorsed it.
Remember
Warsh called the hike removing accommodation, which concedes policy had been stimulative, not restrictive, until now.
Fed and St. Louis Fed research says tariffs explain little of today's excess inflation.
When inflation and jobs risks stop moving together, it signals demand, not supply shocks, is driving the economy.
Realtor.com median list prices: peak in 2022, then about four years of sideways movement.1 / 2
Bill McBride of the Calculated Risk blog has published Part 2 of his mid-September 2026 review of the US housing market, this time on prices. Part 1 covered inventory and sales. Only the first section is free, and the material on mortgage rates and rents is for paid subscribers. The public figures still tell a clear story: prices have stopped rising.
Four years of sideways
McBride shows a Realtor.com chart of 1, meaning the middle asking price of homes for sale. By Realtor.com's figures, list prices peaked in 2022, when mortgage rates jumped, and have moved mostly sideways since.
Lately they have slipped. Median list prices have been below their year-earlier level for ten straight months. McBride notes two limits:
Medians can be distorted by the mix of homes listed. If more cheap condos and fewer big houses come to market, the median drops even if no single home lost value.
List prices usually peak in June, so he expects this measure to keep falling through December.
2: barely positive
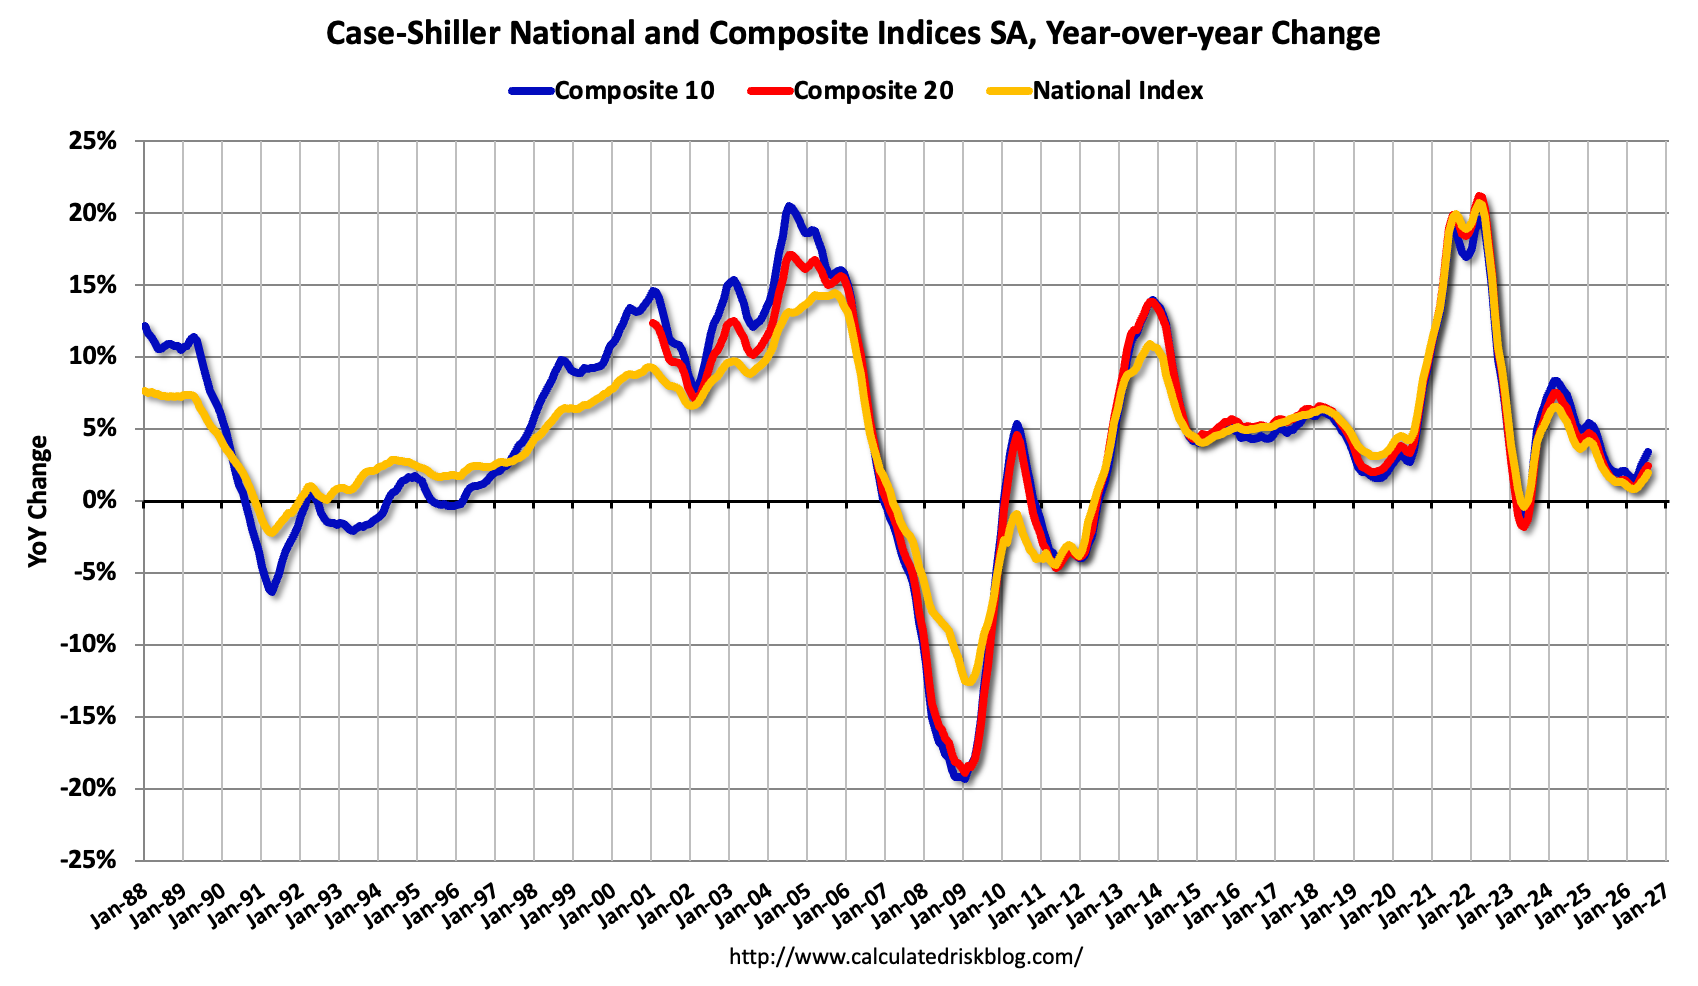
The Case-Shiller indexes avoid the mix problem by tracking repeat sales of the same homes. They come out about two months late. In June, before seasonal adjustment, prices were up from a year earlier by:
2.9% in the 10-city composite
2.1% in the 20-city composite
1.5% nationally
After seasonal adjustment, the National index rose 0.13% from May. That followed three straight monthly declines. McBride expects the July report to show slightly faster annual growth.
What it adds up to
The largest cities are holding up better than the country as a whole. A 1.5% national gain is below the Federal Reserve's 2% inflation target, so in real terms the typical home is probably worth slightly less than a year ago. That conclusion comes from the numbers; McBride doesn't state it.
One small monthly gain after three declines doesn't make a turnaround. With asking prices falling and the seasonal peak past, the free data points to a flat-to-soft market through year-end. The more timely price data, rates and rents that could confirm or challenge that view are behind the paywall.
Bill McBride's Calculated Risk blog publishes a two-part review of the US housing market every month. Part 1 covered inventory and sales. Part 2, dated September 21, 2026, turns to prices. Only its opening section is free. The parts on mortgage rates, rents and more timely price data are for paid subscribers, so this summary covers just the price figures McBride shows publicly.
The big picture: four flat years
McBride starts with a Realtor.com chart of 1, meaning the middle asking price of homes put up for sale. By Realtor.com's numbers, list prices peaked in 2022, the year mortgage rates rose sharply, and have moved mostly sideways ever since.
That fits how housing usually adjusts. Owners rarely cut prices outright. When higher rates make homes less affordable, sellers hold out, buyers step back, and prices stall in nominal terms while inflation slowly brings real prices down.
Asking prices are now falling year over year
McBride adds two cautions about the Realtor.com series.
Mix distortion. A median is just the middle home of whatever is listed that month. Suppose more small condos and fewer large suburban houses come onto the market (a made-up example). The median falls even if no single home lost value. McBride flags this limit himself.
Seasonality. Median list prices usually peak in June. He expects this measure to keep falling through December.
Even with those cautions, the trend is clear. Median list prices have been below their year-earlier level for ten months in a row.
2: still up, but only just
The S&P CoreLogic Case-Shiller indexes avoid the mix problem by tracking repeat sales of the same homes. They are released about two months late and average three months of data, so the June report mostly reflects deals struck in spring. The latest year-over-year figures, not 3 (4):
Index
Change from a year earlier
5 (10 large metro areas)
+2.9%
Composite 20 (20 metro areas)
+2.1%
On a seasonally adjusted basis, the National index rose 0.13% from May to June. That broke a run of three straight monthly declines. McBride expects the July report to show slightly faster annual growth, based on other data he doesn't name in the free section.
Reading the numbers
Two patterns stand out:
Big cities are firmer than the country. The 10-city index is up nearly twice as much as the national one. Price weakness is concentrated outside the largest metro areas.
Prices are falling after inflation. A 1.5% nominal gain is below the Federal Reserve's 2% inflation target. With inflation at or above that level, the typical home is worth slightly less in real terms than a year ago. The article doesn't make this point. It follows from the figures.
The month-over-month bounce is too small, and comes after too many declines, to call a turn. With asking prices falling and the seasonal peak behind, the free data points to a market that is flat to soft heading into the end of the year.
What's missing
The paywalled section holds the material that would test this view: more timely price indexes, mortgage rates and rents. The free portion can't show whether the June uptick held into late summer, or whether falling rates are bringing buyers back.
Remember
Nominal US home prices have been roughly flat since 2022, when mortgage rates rose sharply.
Large metro areas are firmer: the 10-city index is up 2.9% a year, against 1.5% nationally.
Median list prices can fall just because cheaper homes make up more of the listings. Repeat-sales indexes avoid that.
Several US states have overhauled their property taxes in the past three years. Homeowners who live in their homes now get large tax breaks. The cost of schools and police moves to commercial property owners (including rental apartment buildings), to other local taxes, and to state budgets funded by sales and income taxes. Florida, Ohio, North Dakota and Texas debated going further: ending property taxes on 1 homes, or ending them entirely.
That is the subject of "The Great American Property Tax Freak Out," a new paper by law professor David Schleicher posted on 2, an online working-paper repository. Economist Timothy Taylor summarizes it on his Conversable Economist blog.
Why richer owners got angry
Home values jumped after COVID, especially in suburbs. The property tax is a 3, charged on what you own rather than what you earn. So bigger home values meant bigger tax bills. Taylor notes the standard problem with wealth taxes: your wealth can rise without bringing in cash to pay the bill. Older homeowners have lots of home equity and modest incomes, and they are a powerful, sympathetic voting bloc.
What the reforms do
Schleicher argues that the reforms turn the property tax from a way for homeowners to pool money for local services into a transfer from commercial owners to homeowners. He expects:
more state control over local governments
less stable local funding, though fewer 4 in recessions
higher housing costs
Taylor adds that voters may not have connected lower property taxes with cuts to local schools and police.
The price feedback loop
Taylor's sharpest point is about mechanism. A property tax is a yearly cost of owning. Remove it and buyers will pay more for the same house.
Here is a made-up example. A home paying $6,000 a year in tax could, if the tax were abolished, sell for up to about $120,000 more. That is the value of the yearly saving at a 5% 5. Real effects would be smaller once replacement taxes and service cuts are counted.
The irony: high prices drive voters to cut property taxes, and the cuts push prices higher. Current owners gain twice. Future buyers face steeper prices.
What's missing
The post doesn't list which reforms have passed, how much revenue is shifting, or how large the price effects might be.
What changed
Over the past three years, a number of US states have substantially reformed their property tax systems, according to "The Great American Property Tax Freak Out," a paper by law professor David Schleicher posted on 1, an online repository for working papers, on September 1, 2026. The reforms give large tax breaks to 2 homes. Paying for schools and police shifts to three other places:
commercial property owners, a group that includes rental apartment buildings
other local taxes
state funding, which comes mostly from sales and income taxes
Florida, Ohio, North Dakota and Texas went further and debated ending property taxes on owner-occupied housing, or ending property taxes altogether.
Timothy Taylor, the economist who writes the Conversable Economist blog, summarizes the paper and adds three points of his own. He opens with a confession most homeowners will recognize. He wants his house to gain value but other houses to get cheaper, so he can trade up. He also wants his house to gain value while his property tax falls.
The puzzle: richer and angrier
Homeowners might be expected to welcome the post-COVID jump in their largest asset. Schleicher points out that the property tax is a 3. It is levied on what you own, not what you earn. When home values rose, assessments rose, and tax bills followed. Owners responded with political anger. The tax burden often shifted toward commercial owners, whose properties were losing value over the same period.
Taylor's second point explains why the anger has political force. Every wealth tax has the same weakness: your wealth can grow without bringing in any cash to pay the higher bill. A retiree whose house doubled in value still lives on the same pension. Older voters tend to have a lot of home equity and modest current income. That makes them a powerful and sympathetic group in campaigns to cut or abolish the tax.
What the reforms actually do
Schleicher argues that the reforms change what the property tax is. Today it works as a tool homeowners use collectively to buy the local services they want. Under the reforms it becomes ordinary redistributive taxation, in which commercial property owners pay for services that homeowners use. He predicts several knock-on effects, some of them pulling in opposite directions:
More state control over local governments, because states replace lost local revenue and set the limits.
Less stable local funding. Revenue from sales and income taxes falls further in recessions than property tax revenue does. The flip side is fewer 4 in downturns.
Stricter zoning. Schleicher also expects more home building where building is allowed. The article does not spell out why either effect follows.
Higher housing costs, which he calls a substantial transfer of wealth to people who already own homes.
Taylor's first point is that the mechanics usually run through state law that limits or blocks local property taxes. He doubts that voters supporting these measures have connected them to likely cuts in local services such as schools.
Why abolishing the tax raises prices
Taylor's third point is about mechanism. A property tax is a yearly cost of owning a home. Cut that cost and owning becomes more attractive, so buyers bid more. His analogy: picture a guarantee that your roof, plumbing, driveway and HVAC never need repair. Owning would cost less, and the house would sell for more.
Here is a worked example with made-up numbers. A $400,000 home pays $6,000 a year in property tax. Suppose the tax is abolished and buyers value that saving like a steady income stream, discounted at 5%. The stream is worth about $6,000 ÷ 0.05 = $120,000. A buyer could pay up to that much more and still come out even. Economists call this "5": an expected future saving gets built into today's price. In practice the rise would be smaller. Replacement taxes, cuts to services buyers value, and any new building would offset part of it. But the price pressure points upward.
That creates the irony Taylor highlights. High home prices make voters want to cut property taxes, and cutting them pushes prices higher still. Current owners, who already gained from the run-up, gain again in a one-time windfall. Would-be buyers face higher purchase prices. Renters may face higher costs too, since apartment buildings count as commercial property and can end up carrying more of the tax.
What the piece leaves open
The post is a short summary of a longer paper, so a lot is missing. It does not name the states that have already passed reforms or give their details. It has no figures on how much revenue is moving, or on how much prices might rise. It also does not say how much local services would actually be cut. The effects of "stricter zoning" and "more building where legal" are asserted, not explained. Taylor's case against the reforms rests on two things: capitalization, which is standard economics, and distribution, meaning who gains and who pays. The paper may address whether the redistribution is justified, for example as relief for cash-poor retirees. Other tools, such as letting retirees defer the tax until the house is sold, are not discussed here.
Remember
Rising home values automatically raise property tax bills, even when rates don't change, because the tax is charged on value.
Cutting property taxes on homes tends to raise home prices, because buyers bid up houses that cost less to own each year.
These reforms move the cost of local services onto commercial owners and renters, and make local budgets less stable in recessions.
Adeney's slide of 2006 worries, which closely mirrors today's list of fears1 / 4
Pete Adeney, the blogger known as Mr. Money Mustache, has been retired for 21 years. He gets asked a lot whether an AI bubble could wreck people's retirements. His answer, first given as a talk at the Camp FI Midwest event, is mostly not about AI. It is about fear.
The scale of the boom
He starts by sizing the boom. More than 1.5 billion people already use AI tools, which he calls the fastest adoption of any technology in history. Since 2022, about $1.8 trillion has gone into AI, mostly data centers, and he expects another trillion next year. For comparison, the entire US interstate highway system cost about $660 billion in today's dollars. Many investors expect a crash bigger than the 1 of the early 2000s, when overpriced internet stocks collapsed. Adeney's own tech career nearly went down with it.
The 2006 test
His main argument is a then-and-now comparison. A friend once asked how he could sleep at night with everything going on in the world. She asked in 2006. That year's worry list looks a lot like today's: dangerous leaders, a Middle East war, national debt, inflation, an overvalued market (housing then, AI now), jobs lost to outsourcing (AI now), and "2," the fear that oil supply would soon start to shrink.
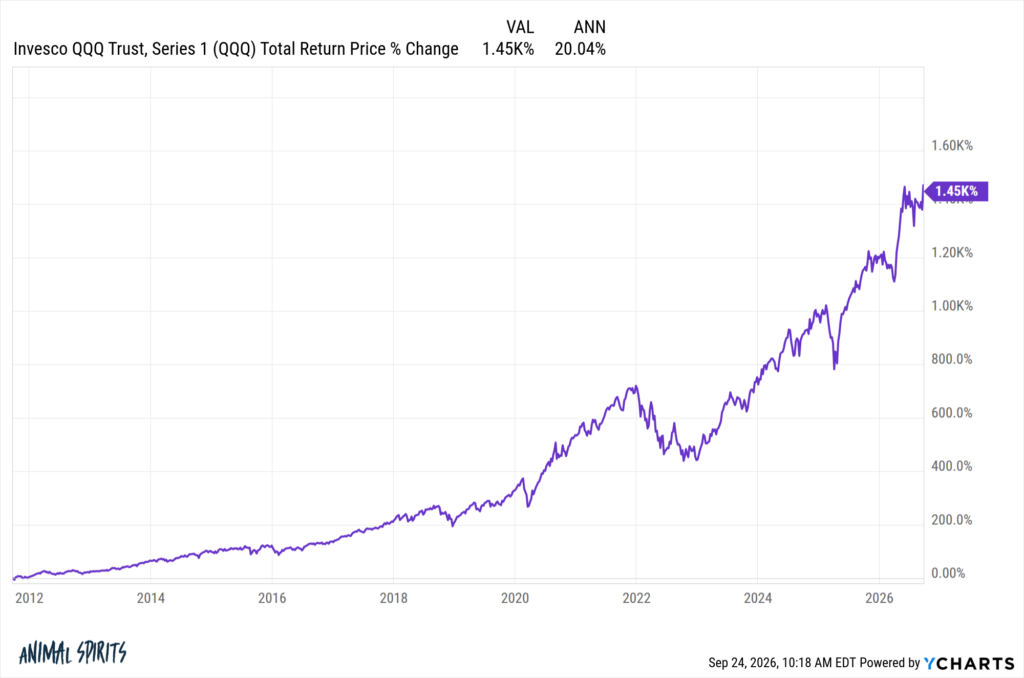
The 3 did arrive, the worst crash since the Great Depression. Even so, he writes, $100,000 invested in 2006 is worth $852,000 today, about 11% a year. Over the same 20 years:
Extreme poverty fell from 20% of the world's people to 8%.
Infant mortality halved.
Solar panels became roughly 40 times cheaper.
Electric cars went from almost no sales to about a quarter of new cars sold.
Productivity, not prices
Adeney argues that prosperity comes from productivity: people doing real work with better tools. Markets, in his view, are "made-up numbers" that can be reset after a crash, as happened in 2008. He calls AI a "cognitive nail gun," a tool that lets fewer workers do more. It will cost some jobs, starting with entry-level software and finance roles. The gains flow mostly to the companies' owners, which includes most index-fund investors.
Managing the fear
The rest is practical advice. Figure out where your fears come from, often from childhood. Picture the realistic worst case. Take action, because action builds resilience. Cut back on daily news. Spend time outdoors and with optimistic people.
What it doesn't cover
This is a pep talk, not a valuation analysis. Adeney never argues that AI stocks are fairly priced, and he doesn't estimate how big a crash might be. He also skips the risk that matters most to new retirees: a deep crash in the first few years of withdrawals can do lasting damage, even if the market recovers later.
Pete Adeney, the former software engineer who writes as Mr. Money Mustache, has been retired for 21 years. Lately the question he hears most is whether an AI bubble will destroy people's retirements. He answered it in a talk at Camp FI Midwest, a gathering of the financial-independence crowd, and plans to give it again at the 1 conference in November. (Bogleheads are followers of Vanguard founder John Bogle's low-cost index investing.) The blog version comes with his slides. His answer is mostly not about AI. It is an argument about fear and where prosperity comes from.
The size of the AI boom
Adeney starts by laying out the worry fairly. AI can now handle complex reasoning tasks that many people didn't expect to see in their lifetimes. He says more than 1.5 billion people use it, along with most large companies, which makes it the fastest-adopted technology in history. That has set off what he calls the largest investment cycle humans have ever undertaken: about $1.8 trillion spent since 2022, mostly on data centers, with another trillion expected next year.
His comparisons:
The Burj Khalifa, the world's tallest building, cost about $2 billion in today's dollars.
The 48,000-mile US interstate system, with its 55,000 bridges, cost about $660 billion.
So AI spending since 2022 already comes to roughly 2.7 interstate systems.
The fear is that the technology is real but the mania is "too much, too fast." That would set up a repeat of the 2, when the tech-heavy Nasdaq index lost about three-quarters of its value between 2000 and 2002. Adeney lived through that one. The internet boom launched his career, and the bust nearly cost him his job and his US citizenship application.
The 2006 test
The core of the piece is one comparison. A friend once asked how he could be comfortable in retirement, "with everything that's going on in the world." He shows a slide of 2026 worries:
Trump and Putin
inflation
the AI bubble
the national debt
wars in Iran and Ukraine
Then he reveals that she asked in 2006. That year's slide is nearly the same:
Bush, Saddam Hussein and Bin Laden
the Iraq war
the national debt and inflation
an overvalued market propped up by housing instead of AI
jobs lost to outsourcing to India and China instead of to AI
"3," the fear that fossil-fuel supply would soon start an irreversible decline
The bad outcome did happen. The 4 of 2007–09 grew out of a house-price frenzy and heavy 5 (borrowed money) inside the mortgage system. It was the worst crash since the Great Depression. Yet on Adeney's chart, $100,000 invested in 2006 is worth $852,000 today. The article doesn't name the index, but the figure works out to about 11.3% a year compounded over 20 years. On that chart, the 2020 Covid crash is a small dip.
He adds world data for the same period:
Extreme poverty fell from 20% of the world's population to 8%.
Infant mortality was cut in half.
Solar panels became about 40 times cheaper. Solar is now most of the new generating capacity added each year; last year's additions matched the peak output of 647 nuclear plants.
Fully electric cars went from essentially zero to about a quarter of global new-car sales, and 100% in Norway.
He then asks whether it is different this time. Maybe the debt finally bites, or the AI bubble dwarfs the housing bubble, or a superintelligence decides it doesn't need us. He doesn't try to disprove these. He argues that the doom stories miss the fundamentals.
Prosperity comes from productivity
Adeney's central claim, which he first made in a 2014 post, is that wealth comes from productivity: real people doing real work with ever-better tools. The financial system, in his words, is "made-up numbers on some computers." If those numbers crash, governments and central banks can "make up some new numbers" and everyone goes back to work, which he says is roughly what happened in 2008.
He calls AI a "cognitive nail gun." His analogy: give the best carpenters nail guns and a builder can lay off half the crew and still build more. AI does the same for office work. He openly expects job losses, already visible in entry-level software and finance roles and later among drivers. He expects cheaper services and new industries in return, as the internet and smartphones brought. He also notes that the gains go mainly to owners, and that most of his readers are owners through their index funds, as their portfolios over the past two years show.
Managing the fear
The second half of the piece is about psychology. Adeney's view is that humans are danger-detection machines whose fear "keeps moving the goalposts." Solve survival and people worry about scarcity, then about fitting in, then about status. He cites 6 and the contrast effect: people judge their lives by comparison rather than in absolute terms. Wealthy people end up worrying about 7 (RMDs), the IRS rule that forces withdrawals from tax-deferred retirement accounts starting in the early 70s. He says 72; it is currently 73.
His remedies:
Find where the fear comes from. His own fear of running out of money traced back to his father's scarcity mindset, inherited from Depression-era grandparents.
Spell out the worst case. It is often survivable.
Act. "Action cures fear," because doing things builds resilience, which he calls "Badassity."
Cut out daily news. Read books instead.
Live like a human. Move, get outdoors, solve problems, and spend time with optimistic people.
He calls his overall approach "Everything is an Experiment." AI, in that light, is one more experiment, and he finds it more fascinating than frightening.
What the piece leaves open
This is a motivational essay, not a market analysis, and it should be read that way. Adeney never claims AI stocks are fairly valued and offers no view on how big a correction might be. His 2006 example also covers a full 20 years. A retiree who starts withdrawing just before a deep crash faces 8: selling shares at low prices early in retirement can permanently shrink a portfolio, even if the market later recovers. The usual protections are a cash or bond buffer and spending flexibility. He doesn't mention either. His claim that the financial system can simply be reset also skips over what that reset cost the people who lost homes and jobs in 2008. What holds up is his main point: over decades, productivity has driven returns more than any particular scare.
Remember
Adeney's 2006 worry list nearly matches 2026's, and $100,000 invested then is now about $852,000.
AI spending since 2022, about $1.8 trillion, is roughly 2.7 times the inflation-adjusted cost of the interstate highways.
The essay doesn't argue AI stocks are fairly priced; it argues long-term prosperity depends on productivity.
GDP growth: actual data, the model's forecast to 2030 with uncertainty bands, and June's forecast for comparison.1 / 3
The New York Fed's 1 model, a simulation of the whole economy that the bank's researchers update every quarter, now sees weaker growth and stickier inflation than it did in June. The authors stress it is one input into the staff's forecasting, not an official New York Fed forecast.
The numbers
Growth. The forecast for 2026 GDP growth, measured fourth quarter over fourth quarter, holds at 1.2 percent. The forecasts for 2027–2029 fell to 0.1, 0.5 and 1.2 percent, from 0.2, 0.7 and 1.5.
2 (the Fed's preferred inflation gauge, excluding food and energy) is now forecast at 3.3, 2.1, 1.8 and 1.8 percent for 2026–2029. In June the forecasts were 3.1, 1.8, 1.6 and 1.7.
The natural rate, 3 (the inflation-adjusted interest rate that neither stimulates nor restrains the economy). The 2026 estimate slipped to 1.9 percent from 2.0. It then declines to 1.2 percent by 2029, about 0.1 point higher than June's path.
Why the model changed its mind
The model runs on data through mid-2026. For the third quarter, which hadn't been reported yet, the team used private forecasters' estimates and market expectations for interest rates.
Those forecasters now expect third-quarter growth more than 1 percentage point faster (annualized) than the model predicted. The authors say the model "keeps being surprised" by a stronger economy. It explains this quarter's miss with two causes. Financial conditions were looser than expected. And the AI investment boom showed up as 4: jumps in how productive each dollar of business investment is.
The model still cut its later growth forecasts. It now expects tighter monetary policy and has lowered its outlook for productivity growth. Slower productivity also raises inflation, because producing each unit of output costs firms more. So one revision both lowers growth and raises prices.
How much to trust it
The uncertainty is huge. The model gives two-in-three odds that 2027 growth lands somewhere between −5.2 and 5.5 percent. That range covers everything from a deep recession to a boom.
The inflation range for 2026 is narrow, 3.0 to 3.7 percent. This year will very likely end well above the 2 percent target.
The direction of the revisions tells you more than the exact numbers. Weaker productivity means slower growth and higher inflation at the same time, and the model admits it keeps underestimating how strong the economy is. The post doesn't break the revisions down by cause.
The Federal Reserve Bank of New York has published its quarterly update to its 1 (dynamic stochastic general equilibrium) model forecast. Six economists in the bank's Research and Statistics Group, led by Marco Del Negro, wrote the post. The model's 2026 growth forecast is unchanged from June. It now sees weaker growth in later years and expects inflation to take longer to return to the Fed's 2 percent goal.
The authors stress that this is not an official New York Fed forecast. It is one input into the research staff's broader forecasting process.
What goes into the forecast
The model uses official data through the second quarter of 2026. Third-quarter data hadn't been released yet, so the team fills that quarter in with outside sources:
Philadelphia Fed 2, August release. The SPF is a quarterly poll of private forecasters. The team takes its median forecasts for third-quarter real GDP growth and core PCE inflation, plus its short-run inflation expectations.
New York Fed Survey of Market Expectations, July release. This survey supplies the expected future path of the federal funds rate, the Fed's main policy rate.
Bond yields. These are the 10-year Treasury yield and the yield on Baa-rated corporate bonds (the lower end of investment grade). The gap between the two measures how tight credit conditions are.
One way to picture it: the model starts from the latest data plus what forecasters and markets currently expect. It then works out which mix of economic "shocks" best explains that starting point, and projects how those shocks play out over the next few years.
Growth: surprised again on the upside
The authors say the model "remains pessimistic on growth, and keeps being surprised when the economy turns out to be stronger than it expected." This quarter's example: the SPF projects third-quarter GDP growth more than 1 percentage point higher (annualized) than the model expected in June.
The model has to attribute that gap to something. It points to two causes, assuming the SPF figure turns out to be right:
Financial conditions were looser than expected. Easier credit and higher asset prices support spending.
The AI-related investment boom. The model captures this through MEI (marginal efficiency of investment) shocks. MEI measures how efficiently spending on investment goods becomes productive capital. A positive MEI shock makes each dollar of investment more productive, so businesses invest more. The model treats the AI capital-spending surge as this kind of shock.
Even so, the 2026 growth forecast (fourth quarter over fourth quarter) stays at 1.2 percent. Later years were cut, for two reasons. First, the model now expects monetary policy to be more restrictive than it did in June. Second, it lowered its expectations for 3 (total factor productivity) growth. TFP is the part of output growth that more workers or more machines don't explain: better technology and better ways of working.
GDP growth (Q4/Q4)
2026
2027
2028
2029
September 2026
1.2
0.1
0.5
1.2
June 2026
1.2
0.2
0.7
1.5
The uncertainty is very large. The 4, the range the model gives roughly two-in-three odds, runs from −5.2 to 5.5 percent for 2027. That one band covers a deep recession at one end and a boom at the other. A mean forecast of 0.1 percent says little about any particular outcome. It mainly shows that the model leans toward a weak economy.
The 2026 band did narrow, from −2.2 to 4.5 in June to −0.8 to 3.1. That is expected, since three-quarters of the year is now known or close to it.
Inflation: slower return to 2 percent
The SPF's third-quarter core inflation forecast roughly matched what the model expected in June, so there was no big surprise here. The model still raised its whole inflation path. Part of the reason is the same productivity downgrade. When productivity grows more slowly, producing each unit of output costs firms more, and the model passes those higher costs into prices.
The 2026 band is now tight, at 3.0 to 3.7 percent. Inflation well above target this year is close to locked in. From 2027 on, the bands widen to roughly 0.5 to 3 percent.
The 2026 figure is the year's main signal. The model now expects core inflation to finish 2026 at 3.3 percent, 1.3 points above target. That is even though it also expects tighter policy.
The natural rate
The model's estimate of the short-run real natural rate (6) for 2026 slipped from 2.0 to 1.9 percent. In this kind of model, r* is the inflation-adjusted rate the economy would settle at if prices and wages adjusted instantly. From 2027 on, the path is about 0.1 point higher than in June: 1.8, 1.4 and 1.2 percent for 2027–2029, compared with 1.7, 1.3 and 1.1. The bands are wide here too, roughly −0.5 to 2.8 percent by 2029.
The decline over time matters for policy. If r* falls toward about 1 percent, a given policy rate becomes more restrictive over time, even if the Fed never raises it.
How to read it
This update has three useful lessons:
The authors openly say the model keeps underestimating growth. The model may be missing something about how the economy works now, most likely the scale of AI investment and how resilient financial conditions have been. Treat its weak growth forecasts with that in mind.
Lower productivity hurts twice. In this model it both slows growth and raises inflation. That is the stagflation combination central banks find hardest to handle.
The means hide a lot of uncertainty. For 2027–2029 the growth bands are about 10 points wide. The direction of the revisions tells you more than the exact numbers.
The post doesn't say how much of the inflation revision comes from lower productivity and how much from other factors. It also doesn't say why the model expects tighter monetary policy, or how much weight the research staff gives this model compared with their other tools.
Remember
Slower expected productivity both lowers growth and raises inflation in the model, a stagflation-like combination.
The model's 68 percent band for 2027 growth runs from −5.2 to 5.5 percent, so its mean forecasts say little on their own.
The model now expects core inflation to end 2026 at 3.3 percent, and its range for this year is narrow, 3.0 to 3.7.