Rich Stock Returns, Pricier Mortgages and Drug Plans · Morning Gist
Monday, October 195 stories · 13 min
Rich Stock Returns, Pricier Mortgages and Drug Plans
Stocks have run well above their long-run average, housing costs keep climbing, and export bans and subsidies aren't doing what they were meant to do.
Picked from 101 new articles across 16 sources · arrow keys for other days
Today in 30 seconds
30s left
The S&P 500 has returned 15.7% a year for 15 years, versus roughly 10% over the past century. Ben Carlson asks how long that lasts. story 1 ↓
A European Commission study finds US chip-gear exports to China fell 22–36%, while EU, Japanese and Singaporean suppliers filled the gap. story 2 ↓
Mortgage rates reached 7.12%, refinancing fell 62% from a year ago, and adjustable-rate loans rose to 9.8% of applications. story 3 ↓
Fannie and Freddie added only $39 billion of mortgage bonds against Trump's $200 billion goal, and mortgage spreads have widened since January. story 4 ↓
One retiree's Medicare Part D premium rises 80% for 2027, from $72.30 to $130 a month, after a temporary federal subsidy ends. story 5 ↓
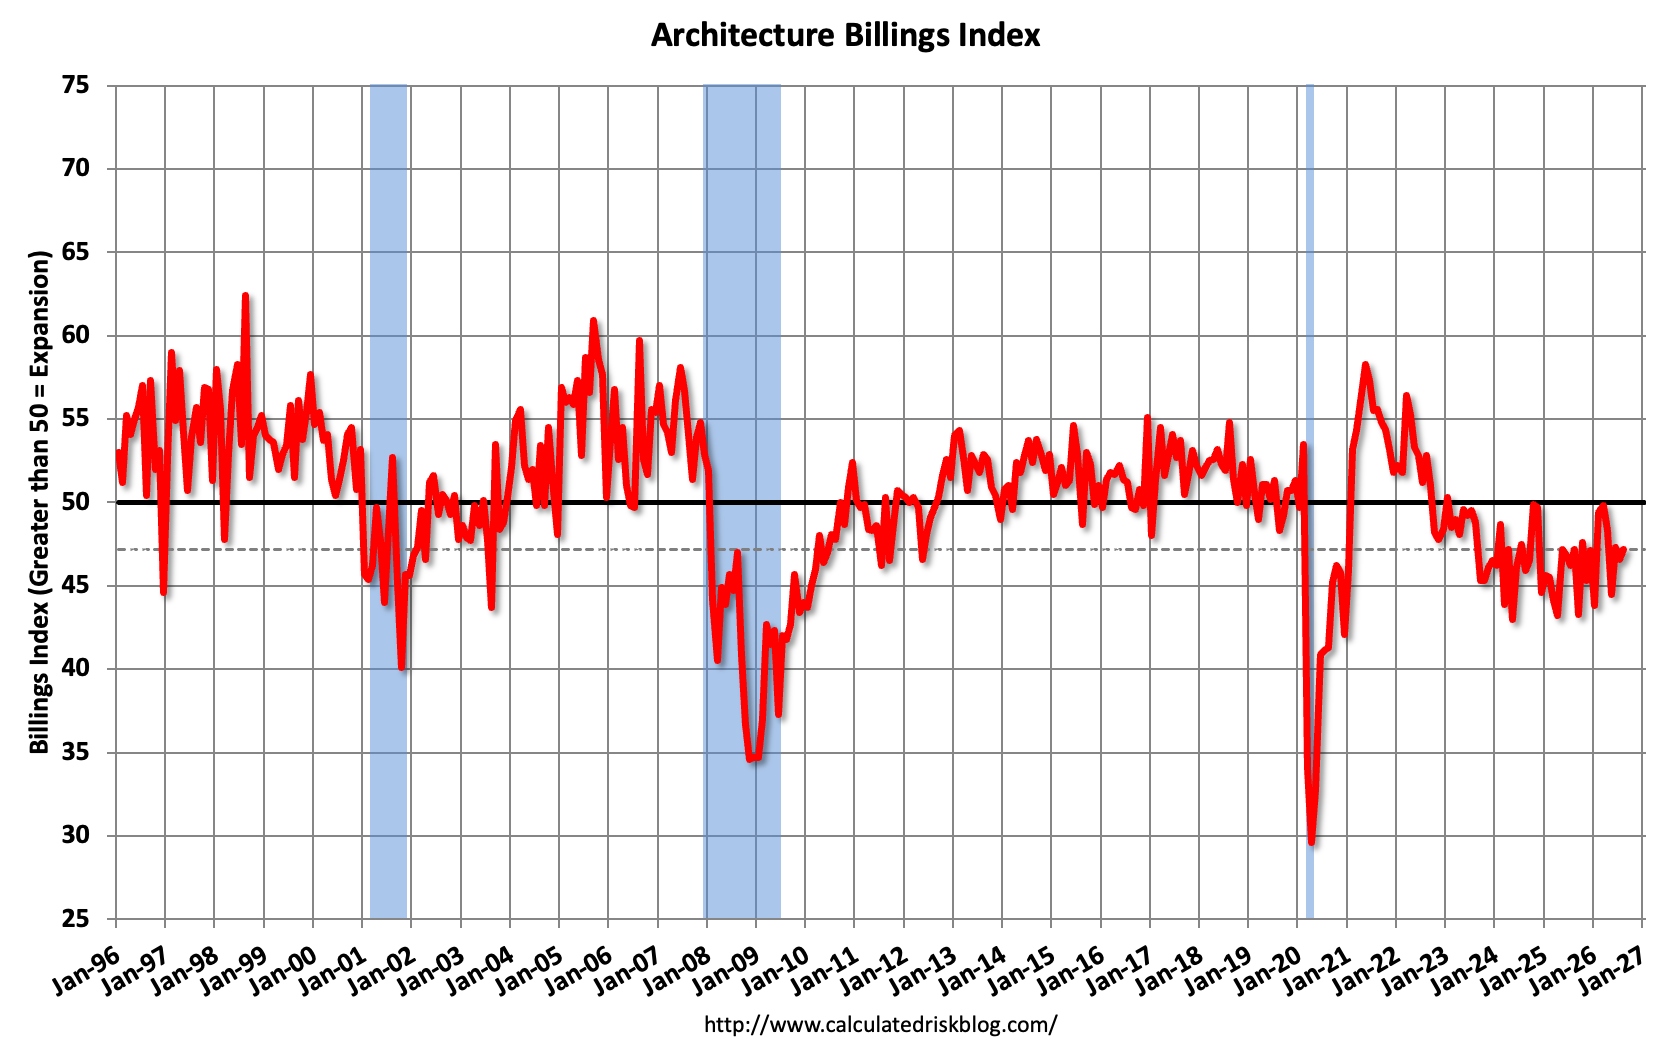
Architecture firm billings, an early sign of construction spending, fell again in August. Multifamily billings have shrunk in 47 of 49 months.
1/5A Wealth of Common Sense· Ben Carlson· Oct 19
S&P 500's 15-year returns are far above the long-run average
Ben Carlson shows the S&P 500 has returned about 15–16% a year over the past 3 to 15 years, well above its roughly 10% long-run average. Nobody knows when that reverses, so he suggests planning for lower returns.
Why it matters · If your retirement or savings plan assumes recent returns will continue, history says you may be counting on a stretch that has always faded eventually.
Know this first
Context from the editor, not the article · 31 sec
1 · Annualized returns
An annualized return is the steady yearly rate that would turn a starting sum into its ending value. It includes reinvested dividends and smooths over good and bad years, so a "15.7% a year" period still had down years in it.
2 · Rolling returns
A rolling 15-year return measures every overlapping 15-year window in the data: 1926–1940, then 1927–1941, and so on. Plotted together, these show how good or bad a long holding period could turn out to be, depending on when you started.
3 · Secular bull and bear markets
"Secular" here means long-lasting, often a decade or more. In a secular bull market, prices trend up for many years. In a secular bear market, returns stay weak for many years, like the 1930s, the 1970s and 2000–2009.
2/5Klement on Investing· Joachim Klement· Sep 22
US chip export bans moved sales to Europe and Japan without slowing China
A European Commission study finds that after US chip export bans, China kept buying the same kinds of goods from the EU, Japan and Singapore. Its share of global chipmaking rose 18%. Joachim Klement concludes that the bans mainly moved US profits to other countries.
Why it matters · One country's export controls can quietly shift revenue between companies and countries, and investors in chip and chip-equipment stocks are exposed to that shift.
Know this first
Context from the editor, not the article · 29 sec
1 · What the bans target
Since 2020, Washington has limited sales to China of advanced chips and of the machines that make them. The aim is to keep China from building cutting-edge chips used in AI, phones and weapons.
2 · Who makes chipmaking machines
The global market for chipmaking equipment belongs to a few firms. Some are American, such as Applied Materials and Lam Research. Others are Dutch (ASML), Japanese (Tokyo Electron) or from elsewhere in Asia. If one country stops selling, buyers can often turn to another.
3 · The Huawei surprise
In August 2023, Huawei launched the Mate 60 Pro smartphone. It ran on an advanced processor made in China, the kind of chip US controls were meant to stop China from producing.
3/5Calculated Risk· CalculatedRisk by Bill McBride· Sep 23
Mortgage rates hit 7.12%, applications fall and home listings tick up
The 30-year mortgage rate jumped to 7.12% in mid-September, its highest since May 2024. Applications to buy and refinance fell, and homes for sale rose 3.2% from a year earlier. List prices barely moved.
Why it matters · If you're buying, selling or thinking about refinancing, this is an early look at the housing market turning toward buyers: weaker demand, slowly rising supply, and flat prices.
Know this first
Context from the editor, not the article · 29 sec
1 · Weekly housing gauges
The Mortgage Bankers Association (MBA) surveys lenders every week and publishes indexes of mortgage applications. They come out well before official home-sales data, so analysts treat them as an early read on buyer demand and refinancing.
2 · Seasonal adjustment
Housing activity follows the calendar: busy in spring, slow around holidays. Seasonally adjusted figures strip out those regular swings so one week can be compared fairly with the next. Raw, or unadjusted, numbers can move a lot just because of the calendar.
3 · Why inventory has been tight
Many owners locked in mortgages below 4% in 2020–21. Selling would mean taking on a much costlier loan, so fewer homes have been listed. Supply has stayed below pre-pandemic (2019) levels for years.
4/5Calculated Risk· CalculatedRisk by Bill McBride· Sep 28
Fannie and Freddie fall far short of Trump's $200 billion mortgage-bond buying
August data show Fannie Mae and Freddie Mac have added just $39 billion of mortgage bonds this year, far below the $200 billion President Trump floated in January. The early drop in mortgage-rate spreads has since reversed.
Why it matters · Whether the government can push mortgage rates down by having Fannie and Freddie buy bonds affects home affordability, and this is the clearest monthly scorecard on how that plan is going.
Know this first
Context from the editor, not the article · 30 sec
1 · Who Fannie and Freddie are
Fannie Mae and Freddie Mac are government-sponsored enterprises (GSEs). They buy home loans from lenders and package them into guaranteed mortgage-backed securities. Both have been under federal conservatorship since the 2008 crisis, and caps limit how big their investment portfolios can get.
2 · How bond buying lowers rates
Mortgage rates follow MBS yields, which trade at a spread above Treasury yields. A big buyer adds demand for MBS, which raises their prices, lowers their yields and narrows that spread. Lenders can then offer cheaper mortgages.
3 · The January announcement
5/5HumbleDollar· R Quinn· Sep 29
A retiree's Medicare drug plan premium jumps 80% for 2027
HumbleDollar writer R Quinn says his Medicare drug plan premium will rise from $72.30 to $130 a month in 2027, and his deductible from $615 to $700, because a federal subsidy that held premiums down is ending.
Why it matters · For retirees, drug coverage is a fixed cost that doesn't depend on income, so a sudden 80% jump lands hardest on people with modest, fixed budgets.
Know this first
Context from the editor, not the article · 33 sec
1 · What Medicare Part D is
Part D is Medicare's prescription drug coverage. Private insurers run it, either as standalone drug plans or inside Medicare Advantage plans. Enrollees pay a monthly premium and a yearly deductible, and the federal government covers most of the remaining cost.
2 · The 2022 drug-law redesign
The Inflation Reduction Act of 2022 capped what enrollees pay out of pocket for drugs (about $2,000 a year from 2025) and moved more of the cost of very expensive patients from Medicare onto insurers. That pushed up insurers' costs, and premiums with them.
3 · The temporary cushion
To head off a premium spike, Medicare started a premium stabilization demonstration in 2025. It paid standalone drug plans a monthly per-member subsidy and capped how far premiums could rise. It was always meant to be temporary, and it shrank in 2026.
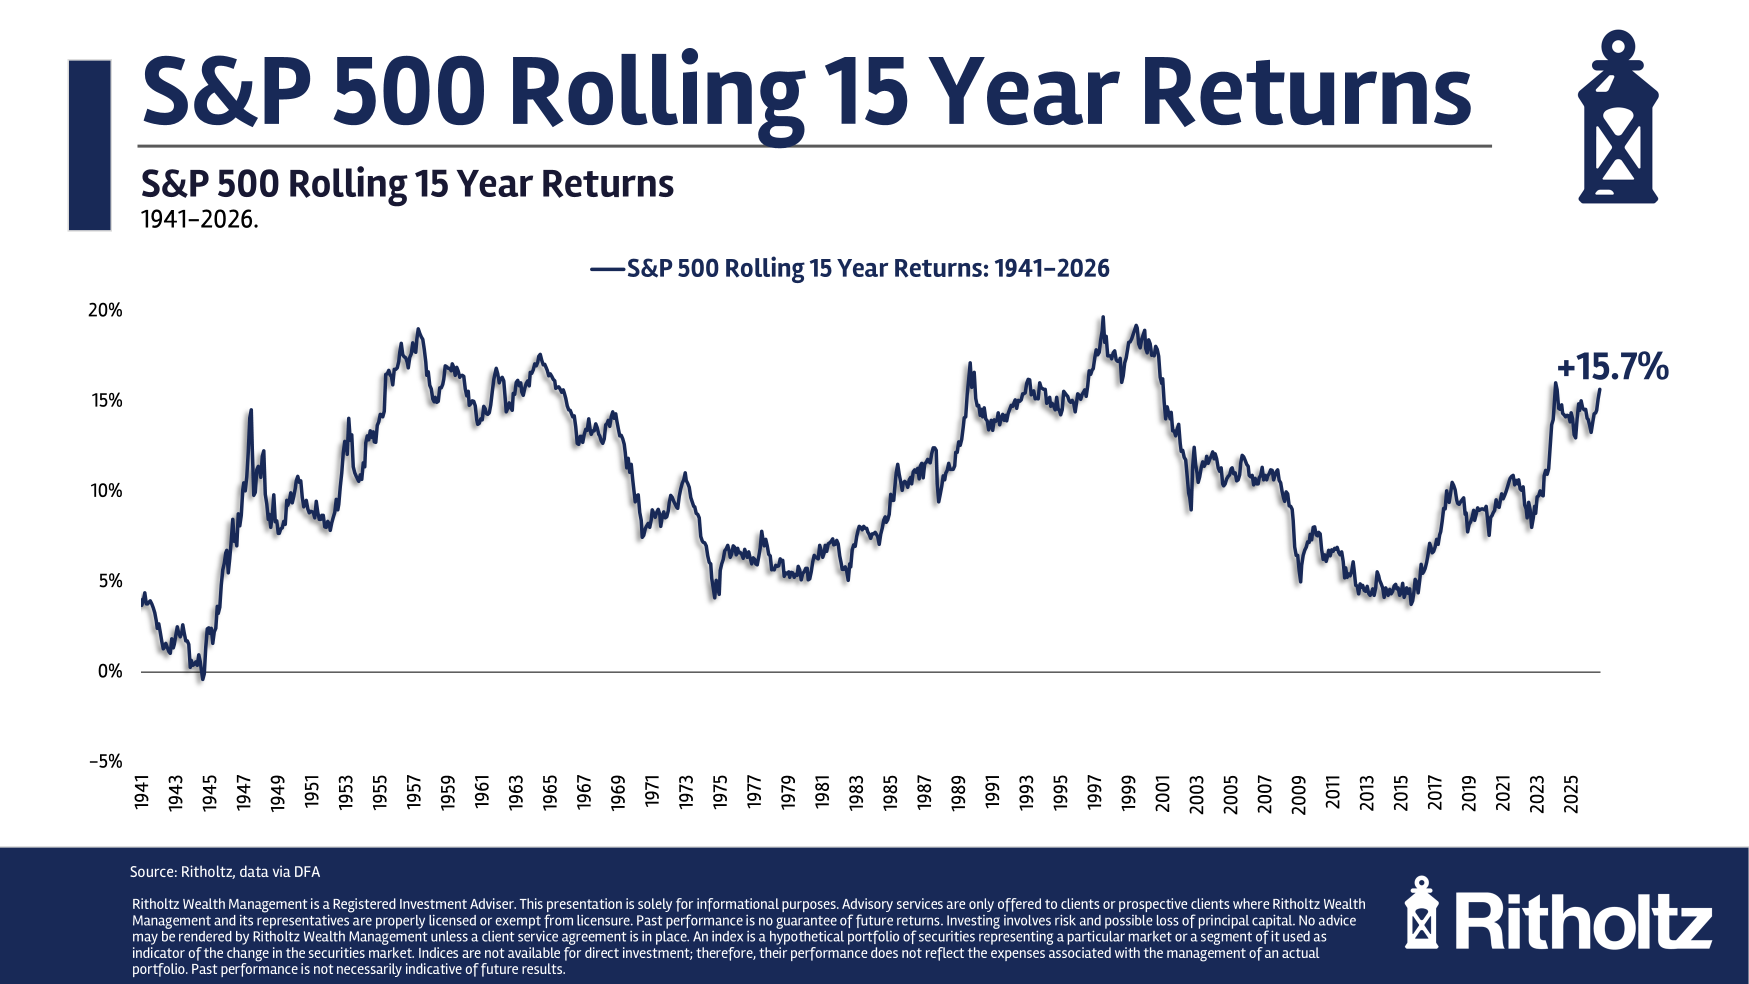
Rolling 15-year S&P 500 annual returns over about a century, swinging in long waves between strong and weak periods.
The 1, an index of 500 large US companies, has had an unusually good run. Through September 2026, Ben Carlson of A Wealth of Common Sense reports these 2 (average yearly gains, compounded):
3 years: +22.9%
10 years: +15.3%
15 years: +15.7%
20 years: +11.2%
50 years: +11.9%
The average over about 100 years is roughly 10% a year. The 20- to 50-year figures are close to that average. The 15-year figure and everything shorter are well above it.
That gap matters more than it looks. As an illustration (our math): at 10% a year, $1 becomes about $4.20 in 15 years. At 15.7%, it becomes about $8.90.
Good runs end, but slowly
Carlson's premise is 3, the tendency of unusually strong or weak results to drift back toward the average. Above-average returns eventually lead to below-average ones, "because, well, math." The usual reasoning is that long rallies make stocks expensive relative to company earnings. But reversion can take years. People warning about high valuations since the mid-2010s have been early for a decade.
His chart of 4, which measures every overlapping 15-year window over the past century, shows a slow wave. Long stretches of strong returns give way to long stretches of weak ones, and then the cycle repeats.
It could still go higher
How long will this run last? "Nobody knows," Carlson writes. He wouldn't be shocked if the AI boom pushed returns to dot-com or post-WWII highs. From 1995 to 1999, the index returned between 20.9% and 37.2% every year. Since 2019, it has returned 31.2%, 18.0%, 28.5%, −18.0%, 26.1%, 24.9%, 17.8% and 12.8% so far in 2026. The pattern is similar but not identical, and he says a "5" is possible. That's a late surge in prices driven by enthusiasm.
He also admits the evidence is thin. A century of data contains only about three giant bull markets and three long bear markets, so the wave is history, not a rule.
The practical takeaway
For more than a decade, professionals predicted below-average returns, and they were wrong. Carlson still argues for assuming lower returns in your own plan. A conservative assumption gives you a 6. If markets disappoint, you're prepared. If they keep rising, you have more than you planned for.
Through the end of September 2026, the 1, an index of 500 large US companies, has delivered returns well above its historical norm over every recent stretch. Ben Carlson of A Wealth of Common Sense lays out the annualized figures:
Period
Annual return
3 years
+22.9%
7 years
+16.2%
10 years
+15.3%
15 years
+15.7%
20 years
+11.2%
30 years
+10.3%
40 years
+11.5%
50 years
+11.9%
Over roughly the past 100 years, the average is about 10% a year. The 20- to 50-year numbers sit close to that average. The 15-year number and everything shorter sit well above it.
What a five-point gap adds up to
A few points a year sounds small, but compounding makes it large. Here is an illustration (our arithmetic, not the article's). At 10% a year, $1 grows to about $4.20 over 15 years. At 15.7%, it grows to about $8.90. So the past 15 years produced more than twice the wealth an "average" 15-year period would have.
Why it should eventually reverse
Carlson's starting point is 2: the tendency of unusually high or low results to drift back toward the long-run average. He doesn't spell out the mechanism. The usual reasoning is that long stretches of strong returns tend to push stock prices up faster than company earnings. That makes stocks more expensive relative to what they earn, which leaves less room for future gains.
He adds a warning, though. Mean reversion "can take longer than you think." He points to the people who have been "screaming about high valuations since the mid-2010s." They were right that prices were high by historical standards, and wrong for more than a decade about what came next.
The wave pattern
Carlson's main exhibit is a chart of rolling 15-year annual returns over the past century. Each point on it is the annualized return of one overlapping 15-year window. He describes the pattern as a wave: it swings from strong long-term returns to weak ones and back, and each swing takes years to play out. Fifteen-year returns have peaked during big bull markets and bottomed out after long bear markets.
Could it go higher?
The obvious question is how long the current run lasts. "The only honest answer is nobody knows," Carlson writes. He then gives historical precedent for it going further. He says it "wouldn't shock" him if the AI boom pushed returns to the heights of the dot-com era or the years after World War II.
For comparison, he lists the S&P 500's yearly returns from 1995 to 1999, the tail end of a two-decade bull market: +37.2%, +22.7%, +33.1%, +28.3%, +20.9%. And from 2019 on: +31.2%, +18.0%, +28.5%, −18.0%, +26.1%, +24.9%, +17.8%, and +12.8% so far in 2026.
By our arithmetic, the late-1990s run multiplied money about 3.5 times in five years. The 2019–2026 run has multiplied it about 3.4 times in roughly seven and three-quarter years, including the 2022 drop. That is a strong run, but slower than 1995–99. Carlson calls the match "not a perfect one-for-one" and raises the possibility of a "3," a late-stage surge in prices driven by enthusiasm more than fundamentals.
How much the history can tell us
Carlson is open about the weakness in his own evidence. A century of data holds only about three huge bull markets, counting the current one, and three "bone-crushing" 4. Six cycles is a tiny sample. Future cycles could come faster, or returns could be more uneven. "These things aren't written in stone," he writes. So the wave in the chart describes what has happened. It isn't a law that predicts what will happen next.
He also points out that forecasts have failed recently. For well over a decade, investment professionals predicted below-average returns. The opposite happened.
What to do about it
Carlson's advice doesn't depend on timing the cycle. He argues for building lower expected returns into your financial plan even if the bull market has years left to run. A conservative assumption creates a 5, a buffer between what you plan for and what you need. If returns disappoint, you're prepared. If they stay strong, you get a pleasant surprise. He calls it a win-win.
One illustration of what that means in practice (ours, not his): a saver who plans around 6–7% a year instead of the recent 15% will save more each month or plan to retire later. If the high returns continue, that saver ends up with extra money. If they don't, the plan still works.
What's left open
The article doesn't say which expected return to use, how valuations stand today, or how other asset classes and non-US stocks might behave. It offers no forecast on purpose. Its argument is about attitude: recent returns are unusually high, history says such stretches end, and nobody can say when this one will.
Remember
Over 15 years, $1 grows to about $8.90 at 15.7% a year, versus about $4.20 at 10%.
Valuation warnings since the mid-2010s were early by a decade. Mean reversion has no reliable timetable.
A century holds only about six major market cycles, too few to treat the wave pattern as a rule.
European Commission chart: China's share of global chipmaking kept rising through successive US export bans.1 / 2
Since 2020, US administrations of both parties have blocked sales of chips and chipmaking equipment to China. Investment writer Joachim Klement looks at a 2026 1 study (Bonnet et al.) on what the bans achieved. His answer: they didn't slow China down. They mostly moved US companies' profits to companies in other countries.
What the data show
US exports to China fell by 22% to 36% after the controls began. The article doesn't explain why the figure is a range.
China's share of the global chip industry rose by 18% from 2017 to 2023. The article doesn't say whether that means percentage points or growth on its earlier share, but China's share clearly went up.
The technology still got through. Eleven months after the 2022 restrictions, Huawei launched a phone with the kind of advanced chip they were meant to block. Klement links those restrictions to the 2. The key export rules actually came from the US Commerce Department at about the same time.
Who sold to China instead
China bought less from the US but made more chips, so the equipment had to come from somewhere. In the study's estimates, the EU, Japan and Singapore significantly increased their exports of chips and chipmaking equipment to China after US sanctions. South Korea and Malaysia also exported more, but the increase wasn't 3. Only Taiwan's exports to China fell alongside America's.
This is 4: when one supplier is banned, buyers go to the next one. Here is an analogy. A town's biggest hardware store refuses to sell tools to one builder, so the builder shops in the next town. The house still gets built. The first store just loses the sale.
"As a European," Klement writes, "I would like to thank the US government for supporting our local semiconductor industry."
Why it matters
For investors, export controls mean US firms lose revenue in a huge market while foreign competitors gain it. If the target isn't slowed much, that cost buys little.
Caveats
The post is short and built around two charts. It doesn't describe the study's method. It also can't show what would have happened without the bans: China might have grown even faster. And it doesn't say whether the substitution continued after the Netherlands and Japan added their own limits on tool sales in 2023.
The finding
Since 2020, US administrations of both parties have blocked sales of chips and chipmaking equipment to China. Joachim Klement, an investment strategist who writes Klement on Investing, points to a 2026 1 study by Bonnet and co-authors that asks what those bans actually did. He sums up the answer as "Of course not": the bans did not slow China's rise as a chip supplier. In his reading, they mainly sent profits that US companies would have earned to companies in other countries.
The numbers
US exports fell. Since the controls began, US chip exports to China have dropped by 22% to 36%. The article doesn't say why the figure is a range. It may reflect different estimates or different product groups.
China's chip industry grew anyway. China's share of the global semiconductor industry rose by 18% between 2017 and 2023. The article doesn't say whether that means 18 percentage points or 18% growth on its earlier share. These are very different amounts, so treat the size with care. The direction is clear either way.
Advanced chips still arrived. The main goal was to keep China away from leading-edge technology. Klement notes that 11 months after the 2022 controls took effect, Huawei released a phone with exactly that technology. He ties the 2022 restrictions to the 2. The best-known October 2022 export rules actually came from the US Commerce Department, at about the same time as that Act. Either way, the timeline holds.
Who filled the gap
China bought fewer chips and machines from the US but made more chips. So someone else must have supplied it. The study's second chart estimates how other economies' exports to China changed in response to US sanctions:
EU, Japan and Singapore: exports of semiconductors and chipmaking equipment to China rose, and the increase was 3.
South Korea and Malaysia: exports also rose, but the increase was too small to rule out chance.
Taiwan: the only one whose exports to China fell in step with the US.
Economists call this pattern 4. When one supplier is banned, buyers move to the next-best supplier. A ban takes the seller out of the deal but doesn't stop the deal from happening.
An analogy (Klement's argument, not his words): suppose a town's biggest hardware store refuses to sell power tools to one builder. The builder drives to the next town and keeps building. The house still goes up. The first store simply loses the sale.
Klement ends with a joke: "As a European, I would like to thank the US government for supporting our local semiconductor industry."
Why it matters for investors
Export controls carry a cost that rarely makes the headlines. US chip and equipment makers lose revenue from one of the world's biggest markets, and competitors in Europe and Asia pick it up. If the ban doesn't actually slow the target, that lost revenue buys little strategic benefit. For a shareholder, the policy works like a transfer from US firms to foreign rivals.
The Taiwan result is also worth noticing. Taiwan's exports fell along with America's, which is consistent with Taiwan following US rules closely. The article doesn't analyse why.
Caveats and open questions
No 5. China's share rising doesn't show the bans had zero effect. China might have grown even faster without them. The article argues the bans failed, but it doesn't show what would have happened otherwise.
Thin detail. This is a short post built around two charts. It doesn't explain the study's method, which products count as "semiconductors and equipment", or how the 18% figure is measured.
Remember
US chip exports to China fell 22–36%, yet China's share of global chipmaking still rose.
The EU, Japan and Singapore significantly increased chip-related exports to China; only Taiwan's fell alongside America's.
Export controls that allies don't match can shift revenue to foreign rivals without stopping the target.
MBA purchase applications index, seasonally adjusted: weekly (blue) and four-week average (red), showing depressed buyer demand.1 / 4
Mortgage rates jumped in mid-September, and housing demand weakened with them. Bill McBride of Calculated Risk tracks two weekly data series, and both pointed the same way for the week ending September 18, 2026.
Applications fell as rates passed 7%
The 1, a lender trade group, said the average 30-year fixed rate rose to 7.12%, the highest since May 2024. Its overall index of mortgage applications fell 1.5% from the week before, after adjusting for normal seasonal patterns.
Purchase applications fell 1% on that adjusted basis and were 11% below the same week a year earlier.
Refinance applications fell 3% for the week and were 62% lower than a year earlier. Refinancing is now at its slowest pace since February 2025.
The raw numbers rose 9% for the week, but that's misleading. The week before included Labor Day, which always drags activity down.
Borrowers responded to the higher fixed rates. The share choosing 2, whose rate resets after a set period, rose to 9.8%. A 3, which is fixed for five years and then adjusts every year, cost more than a full percentage point less than a 30-year fixed loan.
More homes are for sale
4, which tracks home listings, counted 3.2% more single-family homes for sale than a year earlier, up from a 1.5% gain the week before. Supply is still 6.7% below the same week in 2019, but that gap shrank from 8.5% a week earlier.
McBride says slowing 5 growth has been one of the main housing stories of 2026. Now that rates are higher, listings seem to be picking up a little.
Prices are flat
Altos's median list price was down 1% from a year earlier. McBride notes it has barely changed in four years apart from the usual seasonal swings.
The takeaway
McBride's reading: supply is rising slightly while demand is weak. With 30-year rates above 7%, he expects sales of existing homes to slow and prices to come under pressure.
One caveat: this is a single week of data, and it's compared against a week distorted by a holiday. These series are noisy, which is why McBride's chart also shows a four-week average. One week tells you the direction, not that a trend is locked in.
For the week ending September 18, 2026, two of the weekly housing series Bill McBride follows at Calculated Risk moved in the same direction. Higher mortgage rates cut into buyer demand, and the number of homes for sale crept up. McBride's conclusion is that weak demand plus rising supply puts pressure on home sales and prices.
Rates jump to their highest since May 2024
The 1, a trade group for mortgage lenders, runs a Weekly Mortgage Applications Survey. It reported that the average 30-year fixed rate rose to 7.12%, the highest since May 2024. MBA chief economist Mike Fratantoni said rates "vaulted higher." The article doesn't say what caused the jump.
What the application numbers show
The MBA publishes several indexes. The 2 measures all mortgage applications. The Purchase Index counts applications to buy a home. The Refinance Index counts applications to replace an existing loan. For the week:
The adjusted and unadjusted columns point in opposite directions, and the reason is the calendar. The week before included Labor Day, when fewer people apply for loans. So the raw count bounced 9% just because this week had no holiday. Seasonal adjustment corrects for predictable patterns like that. On the adjusted basis, both purchase and refinance applications fell. Fratantoni said refinancing is now at its slowest pace since February 2025.
The 62% annual drop in refinancing shows how sensitive refinancing is to rates. A refinance only pays off if the new rate is meaningfully lower than the old one. When rates rise, the pool of borrowers who would gain shrinks quickly. McBride's long-run chart shows the refinance index is very low compared with its history back to 1990.
Purchase demand is less sensitive, since people still have to move. But it was still 11% below a year earlier, and McBride calls purchase activity "depressed."
Borrowers shift to adjustable loans
Higher fixed rates pushed more borrowers toward 4. An ARM charges a lower starting rate that resets later based on market rates. The most common version is the 5: the rate is fixed for five years, then adjusts once a year. The MBA said 5/1 ARM rates were more than a full percentage point below 30-year fixed rates, and the ARM share of applications rose to 9.8%.
Here's an illustration of the trade-off, using our own numbers rather than the article's. On a $400,000 loan, a one-point lower rate saves roughly $250–$300 a month at first. In return, the borrower takes on the risk that rates are higher when the loan resets in year six. ARMs usually gain market share when fixed rates are high.
Inventory: more listings than last year, still fewer than 2019
6 tracks listings of homes for sale. It counted 3.2% more active single-family listings than in the same week of 2025, up from a 1.5% gain the week before.
Comparing with 2019 matters because that was the last normal year before the pandemic. Inventory is still 6.7% below 2019, but the gap shrank from 8.5% a week earlier. One common explanation for the low supply, which comes from general knowledge rather than the article, is "lock-in": owners with mortgages from the low-rate years don't want to sell and give up those loans.
McBride says the slowdown in 7 growth has been a key story of 2026. Listings had been growing more slowly than before. Now, with higher rates, they appear to be "picking up a little." The article doesn't explain why higher rates would add listings. Possible reasons include homes sitting unsold longer, which raises the count of active listings, or sellers giving up on waiting. We can't confirm either from this data.
Prices: flat for four years
Altos's 7-day median list price was down 1% year over year. McBride points out that, apart from the usual seasonal swings, the median list price has been "mostly unchanged for the last 4 years." Since inflation has kept rising over that period, flat list prices mean homes have actually gotten slightly cheaper after inflation. Keep in mind this is the asking price, not the sale price, and a median can shift when the mix of homes listed changes.
McBride's read, and what to keep in mind
McBride's summary: "Inventory has picked up slightly and demand is weak. With 30-year mortgage rates above 7%, existing home sales will likely slow and house prices will be under pressure."
The logic holds up: more sellers competing for fewer buyers usually means slower sales and softer prices. But there are limits:
One noisy week. Weekly application data swing a lot, and this week's comparison is distorted by a holiday. That's why McBride's chart includes a four-week average.
"Under pressure" isn't "falling." Inventory is still below 2019, which cushions prices. The forecast describes pressure, not a size or a timeline.
Rates can reverse. If rates fall back, refinancing would likely rebound quickly. Refinancing reacts much faster than purchases.
For readers making decisions, the practical signal is that buyers have a bit more choice and negotiating room than a year ago. In exchange, they face the highest borrowing costs in more than two years.
Remember
Refinancing is the most rate-sensitive part of the market: it's down 62% from a year ago, while purchase applications are down 11%.
A 9% raw jump in applications came from a Labor Day comparison. On a seasonally adjusted basis, applications fell.
Median asking prices have stayed flat for four years, so homes have gotten slightly cheaper after inflation.
On January 8, President Trump posted that the GSEs would buy about $200 billion of mortgage bonds. The goal was to push mortgage rates down. Markets reacted right away, before any purchases had actually been made.
Summary statistics from Fannie Mae and Freddie Mac's August monthly volume summaries.1 / 2
Fannie Mae and Freddie Mac have published their August volume summaries. Housing economist Tom Lawler, writing on Calculated Risk, says they show the two companies have bought only a small part of the mortgage bonds the White House promised in January.
Why their buying matters
Fannie and Freddie are 1 that have been under federal control since 2008. They package home loans into 2, bonds paid from pools of mortgages. Each also holds a 3 of loans and MBS. On January 8, President Trump posted that the GSEs would buy about $200 billion of MBS. The aim was to lower mortgage rates: more demand for MBS pushes their yields down and narrows their 4 over Treasury yields, and mortgage rates follow.
The numbers
January–April: combined MIPs rose $45.0 billion. Holdings of "5" (bonds guaranteed by Fannie, Freddie or Ginnie Mae) rose $50.5 billion.
August: MIPs slipped slightly and MBS holdings rose slightly.
Agency MBS holdings are up about $39 billion for the year, roughly a fifth of the $200 billion figure. Lawler says the decline since spring surprised many analysts.
The spread went back up
MBS/Treasury spreads tightened sharply to historically low levels after the January post. That didn't last. Spreads are now well above where they were before the announcement. The article doesn't give the spread figures or say exactly why they widened.
Rate risk is high
Each GSE reports how much its market value would drop if rates jumped instantly by 0.5 percentage points. Mortgage holdings lose value when rates rise. Fannie's figure eased slightly in August from a very high level. Freddie's rose again from an even higher one.
Lawler's verdict
Lawler argues that buying fewer bonds than the President suggested was a "good" call, because MBS have done worse than Treasuries since January. He argues that letting their exposure to rising rates grow was a "bad" call, given how rates have moved. The article doesn't explain why the GSEs pulled back. The lesson so far is that the announcement moved mortgage spreads only briefly, because the buying didn't follow at the pace announced.
Fannie Mae and Freddie Mac have published their monthly volume summaries for August. Housing economist Tom Lawler, writing on Bill McBride's Calculated Risk, reads them as showing the two companies have bought far fewer mortgage bonds than the White House signalled in January. He also says they are carrying more interest-rate risk than they should.
The setup
Fannie Mae and Freddie Mac are 1. They buy mortgages from lenders and package them into 2, bonds paid from pools of home loans and guaranteed by the issuer. Both have been run under federal 3 since 2008. Each also keeps a 4, a stock of whole loans and MBS it holds itself. Bonds issued by Fannie, Freddie or Ginnie Mae are called "5."
On January 8, President Trump posted that the GSEs would buy about $200 billion of mortgage bonds. The reasoning is plain supply and demand. Mortgage rates track MBS yields, and MBS yields sit at a 6 above Treasury yields of similar maturity. If a large buyer adds demand for MBS, their prices rise, their yields fall and the spread narrows. Lenders can then offer cheaper loans with Treasury yields unchanged.
What the numbers show
Lawler splits the year into two halves:
January–April: combined MIPs rose $45.0 billion. Combined Agency MBS holdings rose $50.5 billion.
August alone: MIPs dipped slightly and Agency MBS holdings edged up slightly.
That leaves Agency MBS holdings up about $39.0 billion for the year, roughly a fifth of the $200 billion figure. Lenders say "a far cry" from it. The buying happened early and then reversed. Lawler says the decline in recent months surprised quite a few market analysts, who had expected purchases to continue or speed up.
The spread round-trip
The market moved before the buying did. Lawler says MBS/Treasury spreads narrowed sharply after the January post, reaching historically very tight levels. The narrowing was short-lived. Spreads are now well above where they stood before the announcement. Borrowers who expected a lasting cut in mortgage rates from this policy have so far not got one. The article does not give spread levels in 7 or explain why spreads widened again. Slower buying is one obvious possibility, but Lawler doesn't make that link explicitly.
Interest-rate risk
The volume summaries also report how much each company's market value would change if interest rates jumped instantly by 50 basis points (0.5 percentage points). This figure matters because mortgage holdings lose value when rates rise. They also tend to "extend": borrowers stop refinancing, so the bonds stay outstanding longer at below-market rates.
Fannie Mae's sensitivity fell slightly from July to August, but from what Lawler calls a very high level.
Freddie Mac's sensitivity rose again, from an even higher level.
The article doesn't give the dollar or percentage figures. Those are in the summary tables shown with the post.
Lawler's verdict
Lawler calls the GSEs' choice not to ramp up purchases as much as the President suggested a "good" decision. MBS have underperformed Treasuries since January, so heavier buying would have meant paying high prices for bonds that then lost relative value. He calls their choice to let exposure to rising rates grow a "bad" one, given what has happened to rates overall. The implication is that rates moved against that exposure, though he doesn't give the numbers.
What stays unclear
The article is a short data note. It doesn't say why the GSEs slowed or reversed their buying: portfolio caps, guidance from their regulator, or their own reading of the market. It doesn't say whether the January post was ever formalized as policy. It also doesn't say how the rise in rate risk breaks down between the size of the portfolios and their hedging. The lesson for now is that an announcement can move mortgage spreads for a while, but the effect faded when the purchases didn't follow at the pace announced.
Remember
The GSEs bought MBS heavily from January to April, then trimmed their holdings from May to August.
Mortgage spreads tightened on the announcement alone, then widened past where they started.
Freddie Mac's sensitivity to a sudden rise in rates keeps growing from an already elevated level.
R Quinn, a retiree who writes for HumbleDollar, says his Medicare drug plan will cost a lot more next year. For 2027, the monthly 1 premium for him and his wife Connie goes from $72.30 to $130.00. Part D is Medicare's prescription drug coverage, run by private insurers. That is an increase of about 80%. Their 2, the amount each of them pays before coverage starts, goes from $615 to $700, the legal maximum.
Neither figure includes 3, the Income-Related Monthly Adjustment Amount that higher-income enrollees pay on top. (Quinn spells it "IRMMA".)
Why it's happening
The cause goes back to the 4 of 2022. The law capped what enrollees pay out of pocket for drugs and moved more of the cost of very expensive patients onto insurers. Insurers' costs went up, and premiums were set to follow.
To soften the jump, the government paid temporary premium subsidies. Quinn says officials have now called those subsidies "unnecessary handouts to insurers" and ended them for 2027.
Quinn's argument
Quinn rejects the word "handout." His point is that the subsidy helped retirees pay their premiums. Ending it doesn't make the insurance any cheaper. It moves the cost onto enrollees. He illustrates it this way:
Coverage really costs $100.
The government pays $40 and the retiree pays $60.
The government calls its $40 a handout and cuts it to $20.
The insurer still has to cover $100, so the retiree now pays $80.
He puts the number of people in the retiree's position at about 65 million. That is roughly the whole Medicare population. Not all of them buy the standalone drug plans the subsidy mainly supported.
What it costs in dollars
The post doesn't say whether $130 is per person or for the couple. Assuming it's per person, the premium alone rises by about $692 a year each. Add $85 more of deductible each, and the couple pays roughly $1,550 more in 2027.
Quinn says he can manage. His wider point is that Part D premiums don't depend on income, so a jump like this is a real burden for retirees on tight budgets. He also calls it one more retirement cost that is close to impossible to plan for.
What the post leaves out
This is a short forum post about one plan. It gives no national averages, and it doesn't separate the subsidy's end from other reasons insurers raise prices. It also doesn't say whether switching plans would help. Plans differ a lot from county to county, and Medicare's 5 each fall is when people can compare them and switch.
R Quinn, a retired benefits professional who writes for HumbleDollar, says the premium on his Medicare drug plan will rise from $72.30 to $130.00 a month in 2027, an increase of about 80%. The plan covers him and his wife Connie. Their 1, the amount each of them pays before coverage starts, rises from $615 to $700, the most the law allows.
Neither number includes 2, the Income-Related Monthly Adjustment Amount, a surcharge Medicare adds for higher-income enrollees. (Quinn spells it "IRMMA".) So for higher earners the real increase is larger still.
How 3 is paid for
Part D is Medicare's prescription drug benefit. Private insurers run it, either as standalone drug plans or bundled into 4 plans. Enrollees pay a premium and cost-sharing, insurers bid on what it will cost to cover them, and the federal government pays most of the rest. A premium is therefore the leftover share of a larger cost after the government has paid its part. It is not the full price of coverage.
The 5 of 2022 changed how that cost is split. It capped enrollees' yearly out-of-pocket drug spending (about $2,000 starting in 2025). It also made insurers carry a much bigger share of the bills for the most expensive patients, a share Medicare itself had mostly paid before. That is good for patients with high drug costs. It also gave insurers a higher bill to pass on through premiums.
The subsidy that's ending
To keep premiums from spiking right after the redesign, the government paid premium subsidies, Quinn writes. In general terms, Medicare ran a 6 starting in 2025. It paid standalone drug plans a fixed amount per member each month and limited how much premiums could rise. It was scaled back in 2026.
Quinn says officials have now decided that "the prior subsidies [were] unnecessary handouts to insurers" and are ending them for 2027. He notes the same "slashing handouts" language was used when payments to Medicare Advantage plans were cut.
Quinn's case
Quinn says he won't get into the politics. He argues the "handout" label misunderstands how insurance works. His example:
Coverage has a real cost of $100.
Party A, the government, pays $40. Person B, the retiree, pays $60.
Party A calls its $40 a handout and cuts it to $20.
The cost of claims hasn't changed, and the insurer still has to cover it. Person B now pays $80.
Taking away a subsidy doesn't make coverage cheaper. It shifts the bill. Quinn says there are about 65 million "Persons B." That roughly matches the whole Medicare population. The group directly affected is smaller: the subsidy mainly went to standalone drug plans, and many people get drug coverage through Medicare Advantage instead.
The other side's argument, which the post mentions only to dismiss, is that a flat per-member payment can soften price competition and prop up insurers' margins. In that case not all of the subsidy reaches enrollees. Quinn's example assumes the $100 is fixed and that every dollar of subsidy lowers the premium one-for-one. The real pass-through is probably partial and differs from plan to plan. The post offers no evidence either way.
The math for one couple
The post doesn't say whether $130 is the premium for each of them or for both. On the more likely reading, per person, here is the arithmetic (my calculation, not Quinn's):
2026
2027
Yearly change
Premium (per person, monthly)
$72.30
$130.00
+$692
Deductible (per person, yearly)
$615
$700
+$85
Couple, total
≈ +$1,555
For a retiree living mainly on Social Security, that can be a large share of the yearly cost-of-living raise.
Quinn says he can manage. His wider complaint is about who pays. Part D premiums don't depend on income, except for the IRMAA surcharge at the top, so a flat increase takes a bigger bite from modest budgets. He also calls it another retirement cost "virtually [impossible] to plan for." The underlying point holds: retirees can predict their income well, but some health-care costs are set by policy decisions made year to year.
What the post doesn't settle
This is a short forum post about one household's plan, not an analysis. It doesn't give:
National averages. One plan's 80% jump may or may not be typical.
How much is due to the subsidy. Higher drug costs and insurers' bids also drive premiums, and the post doesn't separate those from the policy change.
Alternatives. Part D plans vary widely by county. During Medicare's 7 each autumn, people can compare plans and switch, including to Medicare Advantage plans with drug coverage, where premiums work differently. Quinn doesn't say whether he looked.
The practical takeaway for anyone on Medicare, or planning a retirement budget, is not to assume this year's drug-plan premium will roughly hold next year. Check the plan's annual notice of changes each fall and compare plans before you renew.
Remember
A Part D premium is what's left of the cost after federal payments, so a smaller subsidy can raise it sharply.
Part D premiums barely depend on income, so a flat increase takes a bigger share of small budgets.
Drug-plan prices change every year; compare plans during each autumn's Medicare open enrollment.
Allied controls. In 2023, the Netherlands and Japan announced their own limits on selling advanced chipmaking tools to China. The article doesn't say whether the substitution it describes happened before or after those rules, or which kinds of equipment it involved. That matters for whether the leak is still open.
Advanced chips versus volume. A larger market share can come mostly from older, cheaper chips. The bans were mainly aimed at the cutting edge. The Huawei phone shows that line was crossed too, though the article doesn't measure China's progress at the frontier.