Today's stories are about timing: Canada moving away from US trade, retirees leaving work at market highs, and investors who piled into AI or recent winners.
Picked from 53 new articles across 16 sources · arrow keys for other days
Today in 30 seconds
30s left
Canada's share of trade with the US is at a 30-year low. Exports elsewhere rose over 40%, but the US still buys about eight times what the EU does. story 1 ↓
A 2012 University of Missouri study found people tend to retire at market peaks. That can make their savings run out sooner. story 2 ↓
Early 2026's 25 best large-cap stocks fell an average of 19.1% in one week. Yields on AI-linked debt passed 15%. story 3 ↓
A HumbleDollar regular switches into Fidelity's top risk-adjusted funds two or three times a year. His only evidence is a three-year backtest. story 4 ↓
Jason Furman's new site, Econvitals, puts key US economic indicators on one dashboard, with optional email briefings.
1/4Apricitas Economics· Joseph Politano· Oct 25
Canada's trade with the US falls to its lowest share in 30 years
Since 2025, Trump's tariffs, consumer boycotts and an Ottawa push for new markets have shrunk the US share of Canadian trade to a 30-year low. Much of the growth comes from high gold and energy prices.
Why it matters · It shows what happens in practice when an economy tries to break away from its closest trading partner: who pays for the tariffs, what can be replaced, and how long it takes.
Know this first
Context from the editor, not the article · 25 sec
1 · Canada's US dependence
For decades about three-quarters of Canada's exports went to the US. Factories on both sides of the border share supply chains, especially in cars, and most big Canadian cities sit close to the US border.
2 · What USMCA does
The US–Mexico–Canada Agreement replaced NAFTA during Trump's first term. Goods that meet its rules on where parts come from can cross the border tariff-free, and the 2025 tariffs largely kept that exemption.
3 · Sectoral versus country tariffs
Country tariffs hit everything a given nation sells. Sectoral tariffs hit an industry such as steel, autos or lumber, whatever country it comes from. Canada is exposed to both kinds.
2/4A Wealth of Common Sense· Ben Carlson· Oct 26
Retiring after a big bull market can raise your risk, not lower it
Ben Carlson argues that the booming markets pushing people into early retirement also expose them to sequence-of-returns risk: an early crash can do lasting damage. His fix is a stress-tested, flexible plan.
Why it matters · If high stock and home prices are making you think about retiring early, the timing of your first few years of withdrawals can matter as much as your average returns.
Know this first
Context from the editor, not the article · 27 sec
1 · Bull and bear markets
A bull market is a long stretch of rising prices. A bear market is a fall of 20% or more from a peak. US stocks fell about half in 2000–02 and close to 60% in 2007–09.
2 · Living off a portfolio
Retirees usually fund spending by selling investments every year. A common rule of thumb, the 4% rule, says to withdraw about 4% of your starting balance and raise that amount with inflation each year.
3 · Annuities
An annuity is an insurance contract. You hand over a lump sum and get guaranteed income, often for life. Your spending is then protected from market swings, but you give up flexibility and some upside.
3/4A Wealth of Common Sense· nelson· Oct 21
AI stocks sell off as investors move to consumer staples
In mid-October, investors sold AI-linked stocks and bought dull defensive ones. The Animal Spirits podcast's show notes trace the shift: tech posted its worst week against consumer staples in 24 years, and debt costs for AI borrowers climbed.
Why it matters · If your index fund is heavy in one theme, a week like this shows how much of your return rides on it, and why diversification and staying put matter.
Know this first
Context from the editor, not the article · 27 sec
1 · Equal-weight versus cap-weight
The usual S&P 500 and Nasdaq 100 weight companies by market value, so a few giants dominate them. Equal-weight versions give every company the same share, which shows how the typical stock is doing.
2 · What a neocloud is
A neocloud is a newer company, such as CoreWeave, that rents out GPU computing power for AI work. Many of them borrow heavily to buy chips and build data centers, so their bond yields show how risky lenders think they are.
3 · Staples versus tech
Consumer staples companies sell everyday goods like food and soap. Their sales hold up in bad times. When investors pick them over tech, they are usually cutting risk.
4/4HumbleDollar· Fund Daddy· Oct 25
A retail investor's case for rotating into recent winning funds
A long-time investor argues for moving money into fund categories that did well over the past three to six months, chosen by risk-adjusted return. His evidence is a short backtest that is biased in his favor.
Why it matters · Performance-chasing rules like this are popular because they look great in backtests. Knowing why a backtest can flatter a strategy protects your retirement money better than any screener can.
Know this first
Context from the editor, not the article · 31 sec
1 · The 'lost decade' for stocks
From 2000 to 2009 the S&P 500, an index of about 500 large US companies, ended roughly flat to slightly negative even with dividends included. The dot-com crash and the 2008 financial crisis came within the same ten years.
2 · Momentum, the academic version
Researchers have long found that assets which rose over the past 3–12 months tend to keep rising for a while. This is the "momentum" effect. It is real but noisy, it can crash suddenly, and trading costs eat into it.
3 · What studies say about fund-chasing
S&P's SPIVA reports find that most actively managed funds trail their index over 10+ years, and top performers rarely stay on top. Morningstar finds that investors' actual returns often lag their funds' returns because they buy after gains.
US share of Canadian trade, now at its lowest in over 30 years after dropping since 2025.1 / 4
Canada sends a smaller share of its trade to the United States than at any time in more than 30 years. Joseph Politano of Apricitas Economics traces this to three forces since 2025: Donald Trump's tariffs and annexation threats, Canadian consumer boycotts, and a deliberate government effort to find other buyers.
How far it has gone
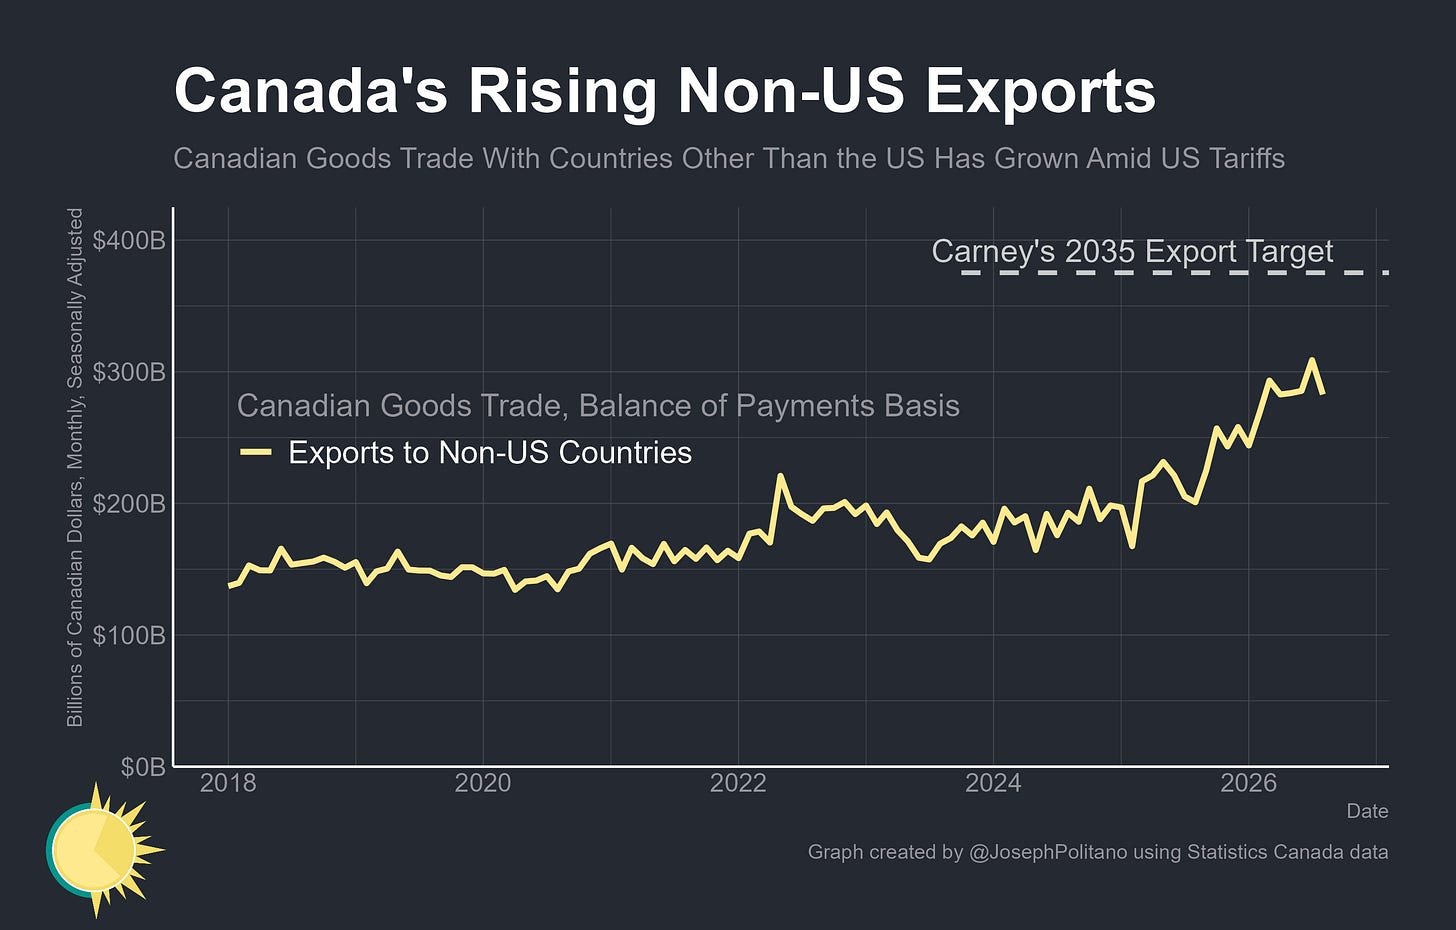
In 2025 Prime Minister Mark Carney set a goal of doubling non-US exports within a decade. Exports to countries other than the US have risen more than 40% in the last twelve months, which puts him roughly halfway there. Even so, the US is still Canada's biggest customer by far, about eight times the size of the European Union, which ranks second.
Most Canadian goods still reach the US tariff-free. They qualify either through blanket exemptions for energy, tech and agriculture or under 1, the North American free-trade deal. The real damage comes from US tariffs on whole industries, which apply to every country. Autos, forestry and paper, and metals make up a large share of Canadian manufacturing, and three of the four sectors with the steepest falls in exports to the US are among them.
Boycotts are visible on the import side. Canadian spending on trips to the US is down 24% from 2024, and spending on other foreign destinations is up by the same 24%. Purchases of American consumer goods have fallen by $2 billion.
Where the new sales come from
Much of the non-US growth comes from commodities. Metal and mineral exports are up 125% since 2024, and non-US energy exports are up 80%. A large part of that is gold shipped to vaults in Britain, which has made the UK Canada's second-largest export market. Politano says these gains should be partly discounted, because they mostly reflect higher prices and goods passing through rather than more Canadian production. Excluding Britain, exports to China are up 52%, to the EU 42%, and to everywhere else 18%. Consumer goods, food and aircraft have all grown too.
The costs
According to the 2's business survey, firms cutting operations outnumber those expanding by nearly 2 to 1, and about 13% are reducing investment in Canada or moving it abroad. A new round of tariffs on $20 billion of goods landed partway through this quarter's survey. Firms that answered afterwards expected export growth nearly 4 points lower and inflation half a point higher than firms that answered before, and 25% cut their investment plans. Spending on pipelines, ports and power lines is up 42% since 2024, but falling investment in factories and mines offsets it.
Still, GDP has grown 1.4% in 2026 after stalling in 2025. Politano argues that most of a tariff's cost falls on the country imposing it, and that Canada's diversification gives it more leverage as the USMCA renegotiation approaches.
Canada's economy is pulling away from America's. The share of Canadian trade going to or coming from the US is now at its lowest level in more than 30 years, and both export and import shares have dropped sharply since 2025. Joseph Politano of Apricitas Economics recently visited Windsor and Toronto on a study trip organized by Germany's Friedrich Ebert Foundation. He attributes the shift to three forces: Donald Trump's trade war, Canadian consumer boycotts, and a formal government push to sell more to the rest of the world.
The starting point
Early in his second term Trump hit Canada with major tariffs. He paired them with repeated talk of annexation and what Politano calls clandestine meetings with separatist groups. Ottawa's response was to stop treating the US as a reliable partner. In 2025 Prime Minister Mark Carney set a goal of doubling non-US exports over ten years, saying that "many of our former strengths based on close ties to America have become our vulnerabilities."
On paper, progress has been quick. Non-US exports rose more than 40% in the past twelve months, roughly half of Carney's target. The US is still Canada's largest trading partner by a wide margin, about eight times larger than the second-place EU.
Why decoupling is hard
Politano points to geography and scale. Canada's whole economy is about the size of New York's or Texas's. Most big Canadian cities are closer to American cities than to each other, and old roads, rail lines and pipelines run north–south. As a result, almost every major province trades more with the US than with the rest of Canada. Canada's growth has also trailed America's since COVID. Much of the recent non-US export gain comes from higher energy and gold prices, which Politano calls a lucky break the government didn't control and probably can't count on again. Any further decoupling, he argues, means trading short-term growth for long-term security.
How the tariffs actually bite
Most Canadian goods still enter the US tariff-free. Some fall under blanket sector exemptions for energy, tech and agriculture. Others meet the rules of 1, the US–Mexico–Canada Agreement that replaced NAFTA, and are exempt as Canadian goods. Politano argues the bigger problem is 2, which the US applies to an industry no matter which country it comes from. Motor vehicles, forestry and paper, and metal and mineral products are all covered. These industries make up a large part of Canadian manufacturing and are the most tightly linked to US supply chains. Three of them rank among the four sectors with the biggest declines in exports to the US.
On imports, Canadian purchases of American consumer goods have fallen by $2 billion, before adjusting for inflation. Politano reads that as the combined effect of boycotts and Canada's retaliatory tariffs. Car and parts imports have dropped too, partly because some Canadian factories have been cut out of cross-border production. He finds the drop in industrial machinery imports the most worrying. It reflects weaker domestic investment at the moment Canadian factories most need to retool.
The boycott shows up most plainly in travel. Canadian personal spending on US trips is down 24% from 2024, and spending on other foreign trips is up by the same 24%. Similar shifts are happening in cars, alcohol, groceries and electronics. Public sentiment backs this up. In a 3 survey, 46% of Canadians think the worst effects of the trade war are still ahead, against 27% who think they are past.
Where the new exports go
Commodities lead. Since 2024, metal and mineral exports to non-US buyers are up 125% and non-US energy exports are up 80%, both records. A large share of the metals figure is gold shipped to vaults in the UK. Canada has an unusually strong mining and refining industry and has gained from the rise in gold demand since 2024. That flow has pushed Britain past China and the EU to become Canada's second-largest export market. Politano cautions that much of the gold gain is price inflation and 4, meaning gold passing through rather than new Canadian output.
Leaving Britain out, non-US exports are still at a record: China up 52%, the EU up 42%, other countries up 18%. Outside resources, overseas sales of metal ores are up 40%, consumer goods 15%, food 14% and aircraft and parts 11%. Energy, ores and minerals have more than made up for falling farm sales to China. According to Politano, China has been looking for other fossil-fuel suppliers as energy prices climbed during the American war with Iran. Farm exports are still recovering from China's retaliation against Canada's tariff on Chinese electric vehicles, imposed during the Biden years, though a deal this year has reversed some of the losses. Canada later replaced its 100% EV tariff with a quota of 49,000 vehicles. Fewer than 16,000 have been used, so the change has mattered less than expected. Import diversification overall has been slower and broad-based, because Canada was always less dependent on US imports than on US buyers.
The cost to business
The Bank of Canada's quarterly business outlook survey shows the adjustment under way. More than 20% of firms have restructured supply chains or plan to, and another 10% are diversifying export markets. The costs are also clear. Firms shrinking Canadian operations outnumber those expanding by nearly 2 to 1, and almost 13% are cutting investment in Canada or moving it abroad.
This quarter's survey happened to straddle a new escalation. Trump put tariffs on another $20 billion of Canadian goods and threatened to double vehicle tariffs at the start of 2027. Comparing firms that answered before the executive orders with those that answered after works as a natural experiment. The new measures cut expected export growth by nearly 4 percentage points, raised inflation expectations by half a point, and led 25% of firms to lower their domestic investment plans.
The government's answer is infrastructure. A new 5 fast-tracks pipelines, ports and power lines. Its first "national interest" project is the 6, which will carry more Alberta oil to west-coast ports. Real investment in transport and utility infrastructure is at records, up 42% from 2024. Investment in factories, mines and plants has fallen enough under Carney to leave total industrial investment flat.
Where this leaves things
The economy is recovering. GDP stagnated in 2025 and has grown 1.4% in 2026, with real manufacturing output up 3.5%, construction 1.8% and energy 1.3%. Politano argues that most of a tariff's cost falls on the country imposing it. In this case that cost is even higher, because many Canadian exports are inputs for American factories and the US actually ran a manufacturing surplus with Canada. Trump has eased Canadian tariffs several times for political reasons, while Carney's popularity has risen.
Questions remain. The non-US surge depends heavily on commodity prices. The factory side of the economy is still shrinking. The USMCA renegotiation, delayed repeatedly, is likely to come during Trump's last two years. Politano's bet is that a less dependent Canada will go into those talks with more leverage. How well that holds up depends on whether Canada can rebuild manufacturing as well as pipelines.
Remember
Most Canadian goods still enter the US tariff-free. US tariffs on whole industries like autos, lumber and metals do most of the damage.
Gold shipments to UK vaults and high energy prices inflate the export boom. Exports to China, the EU and others grew too.
Infrastructure investment is up 42% since 2024, but falling factory and mine investment leaves total industrial investment flat.
Chart Carlson cites, apparently Bloomberg's, showing early retirements rising this decade.
Ben Carlson, a financial adviser who writes the blog A Wealth of Common Sense, argues that the conditions making people feel most ready to retire may be the very ones that put them at risk.
The setup
Retirement is a decision you get to make once, with no practice run. Right now it looks like a great time. Stocks have boomed, house prices are up sharply, and returns on 1 (investments that can lose value, such as stocks and property) have beaten their averages. A Bloomberg chart Carlson cites shows a rise in early retirements this decade.
That is the trouble. Carlson quotes Morningstar's Christine Benz on a 2012 University of Missouri study, which found that workers tend to retire when the market is cresting. Benz says that, counterintuitively, this makes a portfolio less durable, unless the retiree moves most of their money into an 2, an insurance contract that pays guaranteed income.
Why the timing matters
High prices are often followed by a 3, a fall of 20% or more, or by years of weak returns. That raises 4: losses early in retirement do lasting damage because you sell investments while they are down to cover living costs.
An illustrative example (not from the article): two retirees each start with $1 million and withdraw $50,000 a year. Both get a 20% loss and a 25% gain, in opposite orders. With no withdrawals, both would still have $1 million. With withdrawals, the one who suffers the loss first ends with $887,500 and the other with $910,000. Same returns, different outcome, and the gap compounds over a retirement that can last 20 to 30 years.
A worst-case retiree
Carlson knows a couple who retired in March 2000, at the dot-com peak. Stocks fell by about half, recovered, and then dropped nearly 60% in the 2007–09 financial crisis. The market went essentially nowhere for their first decade of retirement. They survived through diversification, keeping enough cash to avoid selling at the bottom, 5, and flexibility. Most of all, they had a plan built for bad scenarios.
The takeaway
Carlson doesn't predict a crash. His advice is to stress-test your plan against a bad first decade and have contingencies ready. The post points to a podcast with Benz on 6, which means keeping a few years of spending in safer assets, and on a "4 year spending rule" that the article itself doesn't explain.
Ben Carlson, a financial adviser who writes the blog A Wealth of Common Sense, asks a question that good times tend to bury: what if right now, with confidence high, is actually a bad moment to retire?
Why retirement is hard to get right
Carlson starts with a simple observation. You get endless practice at small money decisions like spending, saving and investing. You get a few attempts at big ones, such as buying a home or picking a career. Retirement you get exactly once. You can't rehearse it, and the outcomes you fear most are the ones you can't control: higher inflation than planned, lower returns than planned, a crash just after you stop working, or simply living longer than your money lasts.
The current backdrop
By Carlson's account, conditions now look excellent. Stocks have boomed, house prices are up a lot, and returns across 1 (stocks, property and other investments that can lose value) have beaten their long-run averages in this cycle. Anyone who held those assets is probably ahead of plan. He points to a Bloomberg chart showing a jump in early retirements this decade.
That fits a familiar pattern. Nobody wants to retire into a 2, a fall of 20% or more from a peak. Plenty of people are happy to retire into a 3, a long run of rising prices.
The study: people retire near market tops
Carlson quotes Christine Benz, Morningstar's director of personal finance, on a 2012 University of Missouri study. It found that workers often retire when the market is cresting. Benz says this "somewhat counterintuitively" makes a portfolio less durable, unless the retiree moves most of their money out of the market and into an 4. An annuity is an insurance contract that turns a lump sum into guaranteed income.
The reasoning goes like this. High portfolio values make people feel ready to stop working. But high prices are often followed by a bear market or a stretch of weak returns. So the moment that feels safest to retire may come right before the years that hurt retirees most.
How 5 works
This is sequence-of-returns risk: bad returns early in retirement do more lasting damage than the same bad returns later, because you are selling investments while they are down to pay for living costs. Shares sold near the bottom aren't there to recover.
Here is an illustrative example (not from the article). Two retirees each start with $1,000,000 and withdraw $50,000 at the start of each year. Both get the same two annual returns, a 20% loss and a 25% gain, but in opposite order.
Crash first: $1,000,000 − $50,000 = $950,000, down 20% → $760,000. Withdraw $50,000 → $710,000, up 25% → $887,500.
Gain first: $950,000, up 25% → $1,187,500. Withdraw $50,000 → $1,137,500, down 20% → $910,000.
Without withdrawals, both would end at exactly $1,000,000, because the order of returns doesn't matter if you never sell. Withdrawals make it matter. After only two years the crash-first retiree is $22,500 behind, and that gap keeps compounding over a retirement Carlson says can last 20 to 30 years or more.
A real case: retiring in March 2000
Carlson describes a couple he knows who retired in March 2000, at the top of the dot-com bubble. Stocks then fell by about half in one of the longest bear markets on record. Prices recovered a few years later. Then the 2007–09 Great Financial Crisis, the global banking collapse, sent stocks down nearly 60%. Over the couple's first decade of retirement, the stock market went essentially nowhere.
They came through it. Carlson credits four things:
Diversification: they didn't hold only stocks.
Cash management: they kept cash on hand so they didn't have to sell stocks at the bottom.
Intelligent 6: periodically bringing the stock and bond mix back to its targets.
Flexibility: presumably adjusting spending when markets were down, though he doesn't spell out how.
Above all, he says, they had a plan they could stick to, one that had already allowed for a wide range of outcomes, including very bad ones.
What Carlson recommends
He doesn't claim this is one of the worst times to retire, and he doesn't predict a crash. His point is narrower. Risk assets are up a lot, more people are retiring than ever, and confidence is understandably at record highs, just like portfolio values. That is exactly when it pays to stress-test a plan, meaning to check whether it survives a bad first decade like 2000–2009, and to have backups ready.
What the article leaves open
The post is short and serves partly as a lead-in to a podcast episode with Benz. That episode covers withdrawal strategies, "7" (keeping a few years of spending in cash and bonds so stocks never have to be sold in a downturn), a "10 year retirement plan" and a "4 year spending rule." The article doesn't explain the last two. It also doesn't give the University of Missouri study's numbers or how large the durability penalty is, and it doesn't weigh the costs of the annuity route, such as fees, lost flexibility and inflation risk on fixed payments. Readers who want specific withdrawal rules will need the linked material.
Remember
Average returns don't decide the outcome on their own: withdrawals make the order of returns matter.
People tend to retire near market peaks, just before the stretch that can hurt them most.
Keeping cash to avoid selling in a downturn, plus flexible spending, helped one couple survive the flat 2000–2009 decade.
The October 21 episode of Animal Spirits, a weekly markets podcast from Ritholtz Wealth Management, is titled "It's a Bloodbath." The published page is only show notes: a list of headlines and a few posts with charts. The notes still show one clear story. In mid-October 2026, investors pulled back hard from AI-linked stocks.
How big the move was
The notes cite several statistics that point the same way:
Staples beat tech. Consumer staples companies make everyday goods like food and soap. A staples fund (1) had its best week against a tech fund (2) in 24 years, according to analyst Mike Zaccardi.
The typical tech stock fell too. The 3 tracks the biggest companies on the Nasdaq exchange and leans heavily toward tech. Its 4 version gives every company the same share. That version trailed the equal-weight S&P 500 by nearly 4.5 percentage points in five sessions, the widest weekly gap since November 2020, per Bloomberg data. So the selling went well beyond a few mega-caps.
Former leaders fell hardest. The 25 best performers of early 2026 in the 5, an index of the largest US companies, dropped an average of 19.1% in one week, according to research firm Bespoke. Even the best of them, Iridium, lost 7.8%.
Strain in AI debt
Some headlines on the list are about debt, not stock prices. CoreWeave is a 6: it rents out GPU computing power for AI and borrows heavily to build it. Its bond yields reportedly climbed above 15%, a level lenders usually demand only from borrowers they doubt. Another headline says weak links are starting to show in AI borrowing. Small investors bought anyway: Robinhood users made record net purchases of CoreWeave stock over five days after it fell.
Rates aren't following inflation
Bloomberg's Joe Weisenthal pointed out that inflation came in hot two reports in a row, yet interest rates kept falling. He argued that the whole market now runs on the AI trade, and that worries about Anthropic's revenue mattered more than government data. A headline on the list adds that high rates aren't slowing AI spending, which makes the Federal Reserve's job harder.
For perspective
Another headline says 92% of today's S&P 500 companies have lost at least half their value at some point. Even companies that end up winning go through crashes.
The notes don't say what caused the selloff or what the hosts concluded. That discussion is in the audio.
The October 21 episode of Animal Spirits is titled "It's a Bloodbath." It's a weekly markets podcast hosted by Michael Batnick and Ben Carlson of Ritholtz Wealth Management. The published page is just show notes: a list of headlines and a few posts with charts. The discussion itself is in the audio. The notes still sketch one clear story. In mid-October 2026, investors pulled back hard from the AI trade, and the damage went well beyond one or two stocks.
Signs that money left AI
The notes cite several market statistics, each from a different market watcher:
Tech against staples.1 is a fund that tracks large tech stocks. 2 tracks consumer staples, the makers of food, household goods and other things people buy in any economy. Analyst Mike Zaccardi noted that staples had their best week against tech in 24 years.
The typical Nasdaq stock. The 3 holds the biggest non-financial companies on the Nasdaq exchange and is tilted toward tech. Its 4 version gives every member the same share. Bloomberg data shared by Jessica Menton showed it trailing the equal-weight S&P 500 by nearly 4.5 percentage points over five sessions. That was its widest weekly gap since November 2020. Equal weighting matters here: it shows the selling reached the ordinary tech stock, not only a few giants.
Former leaders hit hardest. Research firm Bespoke tracked the 25 best-performing stocks in the 5, an index of the largest US companies, over the first half of 2026. Last week they fell an average of 19.1%. The best of them, satellite operator Iridium, still lost 7.8%. The stocks that had gained most from the theme gave back the most.
The credit side
Several headlines on the list are about debt, not stock prices. One says weak links are starting to show in AI borrowing. Another says CoreWeave's "big dream crashes into reality as yields top 15%." CoreWeave is a 6: it rents out GPU computing power for AI and pays for chips and data centers with heavy borrowing. A bond yield above 15% means lenders want equity-like returns before they will hold its debt. Markets usually price borrowers they doubt this way. The notes don't give the specific bonds or how fast the yields rose.
Small investors moved the other way. Luke Kawa of UBS posted that Robinhood customers made record net purchases of CoreWeave stock over five days after it fell.
Rates and the AI trade
Bloomberg's Joe Weisenthal posted that inflation had come in hot two reports in a row, yet interest rates kept falling. He argued that the whole market is "about the AI trade." In his view, worries about Anthropic's revenue numbers mattered more than "some random government datapoint." A New York Times headline on the list adds a second angle: high interest rates aren't slowing the AI spending boom, and that is a problem for the Federal Reserve. Taken together, the two suggest that AI investment is driving markets, and maybe the economy, so strongly that the usual link between inflation and rates has weakened. The notes give no data to test this.
A long-run reminder
One headline offers perspective: 92% of today's S&P 500 companies have lost at least half their value at some point. The notes don't include the data behind it. The point is a familiar one: even companies that end up winning go through crashes. That doesn't mean every fallen stock comes back.
Other items
The rest of the list covers several unrelated topics:
Elon Musk said he will give one SpaceX share to every child in America next year, "the first of many." The notes give no details on how this would work.
JPMorgan Chase is blocking outside AI agents from logging directly into customer accounts.
A property-tax revolt is questioning whether people really own their homes.
One post shows that a United Airlines frequent flyer now has to spend $32,000 to earn 1,000 of a certain kind of credit, up from $10,000–15,000 between 2014 and 2022. The post doesn't name the program.
Another post jokes about the "NYC problem": someone in their mid-30s with a $4 million net worth that grows "only" $300–400k a year.
What the notes leave out
The notes don't explain what set off the selloff, apart from Weisenthal's mention of jitters over Anthropic's revenue. They don't say whether the move is a correction or a turning point, or what the hosts concluded. The charts on the page have no captions. For the analysis, you have to listen to the episode.
Remember
When equal-weight indexes fall too, the selling has spread beyond a few giants.
Bond yields above 15% for an AI borrower show lenders are worried even where stock buyers aren't.
Nearly every large company has lost half its value at some point; deep drawdowns are normal.
A contributor who posts as "Fund Daddy" on HumbleDollar's reader forum has laid out the method he says got him through the 2000s. Every few months, he moves money into the fund categories that have been doing best. He says he has never sold investment advice.
The rule
He began in 1995 with two Vanguard index funds. When stocks fell in 2000 he changed course. His rule is to favor categories that did well over the past three to six months, such as US large-cap growth, value, small caps or international stocks, and pick funds inside them with strong risk-adjusted returns. He ranks candidates in Fidelity's free fund screener using three numbers, in this order:
1: return above a risk-free rate like Treasury bills, divided by volatility. It measures how much return you got for each unit of risk.
2: how widely returns swing.
3: price change plus dividends.
He reviews his holdings two or three times a year and suggests starting with about 30% of a portfolio.
The evidence offered
For an all-stock portfolio, he picked five funds through the screener. He then ran a three-year 4 on testfol.io, a free tool that replays past returns. He says the five funds beat the 5 on return, volatility and Sharpe ratio. In his test the index swung about 50% more and had close to twice the worst peak-to-trough loss. For a cautious portfolio he kept only funds with a standard deviation under 6. He reports 15.16% a year, 3% volatility, a 2.2% maximum loss and a Sharpe of 3.3. He adds that readers should check these numbers themselves.
Why to be skeptical
The test is set up to look good. The funds were picked because they did well recently, then tested over that same recent stretch. That is 6: the result was partly built into the selection. A fair test would apply the rule at each past review date, add trading costs and taxes, and go back further than three years, preferably through 2008.
A Sharpe ratio of 3.3 is also far above the roughly 0.4–1 that broad stock indexes have shown over long periods. Numbers that smooth usually mean something unusual. It could be a narrow strategy, a short sample, or holdings whose prices are marked only occasionally. The post doesn't say what these funds hold.
The broader evidence goes against chasing funds. Momentum exists as a market effect, but most top-performing funds don't stay on top, and investors who buy after strong runs tend to earn less than the funds themselves. The author's fair points are that buy-and-hold has risks of its own and that doing this rarely keeps costs low. What he hasn't shown is that his rule beats an index fund going forward.
A contributor who posts as "Fund Daddy" on HumbleDollar's reader forum has written up the investing method he says served him better than buy-and-hold. Every few months, he moves money toward fund categories that have recently done well, choosing funds by risk-adjusted return. He opens by saying he has never sold investment advice or made money from it, and that he has helped "hundreds of investors" informally.
The post is short and personal, part philosophy and part how-to. It is worth reading closely because the rule it describes is one of the most common ideas in retail investing, and the evidence it offers has a classic flaw.
The problem he is reacting to
The author agrees that two or three index funds are "still good advice for many people." His objection is that buy-and-hold is a decision too, with risks of its own. His main example is 2000–2010. In that decade the 1, the standard index of about 500 large US companies, went nowhere after the dot-com bust and the 2008 crisis. Someone who retired in 2000 with an all-index portfolio spent ten years with no real growth while taking money out.
He started in 1995 with two Vanguard index funds, inspired by Burton Malkiel's A Random Walk Down Wall Street. That book is a founding text of index investing. It argues that prices are hard to predict, so low-cost diversification wins. When markets fell in 2000, he went looking for alternatives.
The mechanism
His rule: "invest in the categories performing well over the past three to six months and select funds with attractive risk-adjusted returns." In practice, if US large-cap growth is leading he leans into it. When leadership shifts, he spreads into value stocks, small companies or international markets. He started with five funds and still compares them on three measures:
2 (TR): price change plus reinvested dividends.
3 (SD): how widely returns swing around their average. This is the usual stand-in for risk.
4: return above a risk-free rate (such as Treasury bills), divided by standard deviation. It answers the question "how much extra return per unit of risk?"
A simple illustration with made-up numbers: Fund A returns 12% with 15% SD, and Fund B returns 9% with 5% SD. With a 4% risk-free rate, A's Sharpe is (12−4)/15 ≈ 0.53 and B's is (9−4)/5 = 1.0. The author ranks by Sharpe first, so he would prefer B even though it earned less.
His tool is Fidelity's free mutual fund screener. Sharpe ratio is his first filter, then standard deviation, then total return. He says practice lets him find candidates in minutes. He reviews his holdings two or three times a year, which keeps trading and effort low, and suggests newcomers try it with about 30% of their portfolio.
The results he reports
For a young investor wanting an all-stock portfolio, he ran the screener and named five funds. He calls them "screening examples, not automatic buy recommendations." He then ran a three-year 5 on testfol.io, a free website that replays how a portfolio would have performed on past data. According to him, the five funds beat the S&P 500 on total return, standard deviation and Sharpe ratio. The index had close to 50% more volatility and nearly twice the 6, meaning the largest drop from a peak to a later low. He adds that most of the same funds would have shown up if he had run the screen six months earlier.
For a conservative portfolio, the kind he says he holds, he kept only funds with SD below 6 and named three. Over the past three years he reports an annualized return of 15.16%, standard deviation of 3%, maximum drawdown of 2.2% and a Sharpe ratio of 3.3. He notes these "should be independently verified."
Where the evidence is weak
Look-ahead bias. The funds were chosen for their strong recent figures, then backtested over a window that overlaps the period used to choose them. A strategy tested this way will almost always look excellent, because the winners were picked after the fact. A fair test of his rule would rerun the screen at every past review date using only the data available then. It would hold whatever came up, include trading costs and taxes, and cover a much longer span. The years 2000–2010 would be the obvious choice, since that decade is his reason for adopting the method. The post doesn't do this. The six-month remark is a small step in that direction, not a substitute.
Three years is short. One three-year window may cover only one market regime. Sharpe ratios estimated over short periods are very imprecise.
The conservative numbers are unusual. A Sharpe of 3.3 is several times the roughly 0.4–1 that broad stock indexes have shown over long periods. Returns that high with 3% volatility usually come from something narrow: a specialized strategy, an unusually calm stretch, or assets that are repriced infrequently, which makes reported swings look smaller than the real risk. The post doesn't explain what these funds hold or why their returns were so steady, so readers can't judge which applies.
The wider evidence. Academic research does find a 7 effect: assets that rose over the past 3–12 months tend to keep rising for a while. But it is noisy and prone to sharp reversals. At the level of fund picking, the record is discouraging. S&P's SPIVA scorecards show that most active funds trail their benchmarks over long periods and that top performers rarely stay on top. Morningstar's "Mind the Gap" studies find that investors earn less than the funds they own, largely because they buy after strong runs and sell after weak ones.
What's fair in the argument
The author is right that buy-and-hold carries sequence risk. A bad decade just before or after retirement does real damage. He is also right that a rules-based review a few times a year is more disciplined than reacting to headlines. Limiting the experiment to 30% of a portfolio caps the damage if the rule fails.
Still open: how his actual portfolio did across 2000–2025, net of costs and taxes, compared with a simple index mix. That record, if it exists, would carry more weight than a three-year backtest of funds picked today. Without it, the post shows how to run a screener but doesn't show that screening beats indexing.
Remember
If you pick funds for their recent results and then backtest them over that same period, they will look good almost by construction.
Sharpe ratios several times above a stock index's long-run level need an explanation before you trust them.
To test a rotation rule fairly, apply it at each past review date and include costs, taxes and a full market cycle.