Today: where market power blunts rate cuts, Social Security's 2032 deadline, a mortgage market frozen at 7.3%, Europeans who won't buy stocks, and an unnecessary car repair.
Picked from 65 new articles across 16 sources · arrow keys for other days
Today in 30 seconds
30s left
Across 14 million new cards, lenders passed on 20% less of a 2008 rate surprise in segments where their share was high. story 1 ↓
Social Security faces a 22% benefit cut around 2032; closing the $29 trillion gap would take a 17.3% payroll tax. story 2 ↓
Home-purchase mortgage applications are down 19% with rates at 7.3%; refinancing is down 60% from a year ago, and adjustable-rate loans are gaining favor. story 3 ↓
A hypothetical €50,000 lottery win moved only 8.4 to 12.8 percentage points of non-stockholders into stocks across six eurozone countries. story 4 ↓
A dealer's $1,000 car repair quote, up from $600 six months earlier, vanished when an independent shop found no wear at all. story 5 ↓
1/5Liberty Street Economics (NY Fed)· Kyle Herkenhoff and Juan M. Morelli· Nov 4
Card lenders share fewer rate cuts where they dominate a market segment
Economists studying 14 million new credit cards found that when funding costs fall, lenders cut offered rates less in segments where they hold large market shares, so similar borrowers can get different rates.
Why it matters · Card rates reflect more than your credit risk: competition within your narrow borrower segment also shapes the price, and with it how much a Fed cut reaches a new offer.
Know this first
Context from the editor, not the article · 31 sec
1 · How card rates are built
Most US credit cards carry variable rates: a benchmark that moves with the Federal Reserve's policy rate, plus a spread the lender chooses when opening the account. That spread covers default risk and costs, and includes the lender's profit margin.
2 · What pass-through measures
Pass-through is the share of a change in a lender's costs that reaches the customer's price. In a highly competitive market, rivals tend to force cost savings through to customers. A lender facing less competition may be able to keep more.
3 · Why correlation falls short
2/5Conversable Economist· conversableeconomist· Nov 4
Social Security faces a 22% benefit cut around 2032 without reform
Social Security's promises exceed projected revenue by about $29 trillion over 75 years. Drawing on a lecture by Mark Duggan, economist Timothy Taylor weighs the fixes and argues for a smaller public benefit plus private accounts.
Why it matters · The choice among higher taxes, later retirement and smaller benefits affects how much you should save, when you can retire and how much of your income to count on from Social Security.
Know this first
Context from the editor, not the article · 27 sec
1 · How the funding works
Social Security is largely pay-as-you-go: today's workers fund today's retirees. Past surpluses went into a trust fund holding Treasury bonds. Once reserves run out, the program can pay only what incoming revenue covers.
2 · The payroll tax and cap
The program's main funding is a 12.4% tax on wages, split between worker and employer. It applies only up to an annual earnings cap, $184,500 in 2026. Higher earnings escape the tax and do not raise benefits.
3 · How benefits are set
A formula converts a worker's highest 35 years of earnings into a monthly benefit, payable in full at the full retirement age. Payments then rise each year through a cost-of-living adjustment tied to inflation.
3/5Calculated Risk· CalculatedRisk by Bill McBride· Nov 4
Mortgage applications for home purchases are down 19% with rates at 7.3%
Mortgage applications fell 1.2% in late October even as 30-year rates eased to 7.3%. With housing inventory back at 2019 levels, analyst Bill McBride expects slower home sales and pressure on prices.
Why it matters · Applications show buyer demand before sales close, so this data offers an early read on where home sales and prices may head if you plan to buy, sell or refinance.
Know this first
Context from the editor, not the article · 29 sec
1 · What applications measure
Lenders receive mortgage applications weeks before a home sale closes, so application counts offer an early, if noisy, signal of demand. Not every application becomes a loan, and weekly figures can swing for minor reasons.
2 · Purchase versus refinance
Purchase loans finance a home sale, so they track buyer demand. Refinance loans replace an existing mortgage, and they usually make sense only when current rates sit below the rate the owner already pays, making them highly rate-sensitive.
3 · Fixed and adjustable loans
A fixed-rate mortgage keeps one interest rate for its full term, commonly 30 years. An adjustable-rate mortgage typically starts lower for a set period, then resets periodically with market rates, so the borrower takes on future payment risk.
4/5Klement on Investing· Joachim Klement· Nov 4
Even a €50,000 lottery win wouldn't get most Europeans into stocks
Researchers asked eurozone households how they would use a hypothetical lottery win of up to €50,000. Some non-investors would buy stocks, but more than 60% of households would still own none.
Why it matters · If extra money barely changes who invests, low European stock ownership probably isn't just about affordability, which matters for anyone judging policies or habits meant to widen investing.
Know this first
Context from the editor, not the article · 19 sec
1 · The stock participation puzzle
Stocks have historically paid more than safe assets over long periods, so standard theory suggests most households should own at least a little. Many don't, even in rich countries. Economists call this gap the stock market participation puzzle.
2 · Two ways to measure investing
Researchers separate whether a household owns any stocks from how much of its financial wealth is in them. A windfall could change either one, so the study looks at non-owners and existing owners separately.
mutual funds
Pooled investment vehicles that combine many people's money and buy a portfolio of assets such as shares or bonds.
Share of eurozone households invested in stocks and mutual funds, from Christelis et al. (2025).
5/5HumbleDollar· Andrew Clements· Nov 4
A second opinion erased a $1,000 car repair the dealer recommended
HumbleDollar writer Andrew Clements nearly paid his Toyota dealer $1,000 to replace suspension parts. An independent shop inspected the minivan, found no wear and said the work wasn't needed. It's one anecdote, but a useful one.
Why it matters · Car repairs are a common purchase where the seller both diagnoses the problem and profits from the fix, so a cheap independent check can protect a sizable sum.
Know this first
Context from the editor, not the article · 18 sec
1 · What sway bar links do
A sway bar connects a car's left and right suspension to limit body lean in turns. End links attach the bar to the suspension. Worn links typically cause clunking over bumps or looser handling.
2 · Why repairs are hard to judge
Economists call car repair a credence good: buyers often can't tell whether the work was needed, even afterward. The party recommending the repair usually also earns money from doing it, so buyers rely on trust.
Image: HumbleDollar
Andrew Clements, writing on the personal-finance site HumbleDollar, came close to paying $1,000 for a repair that a second shop told him he didn't need.
Lenders with large shares might charge more because of market power, or because their borrowers differ in ways researchers cannot see. Economists therefore look for a surprise event and compare responses to it, which helps rule out rival explanations.
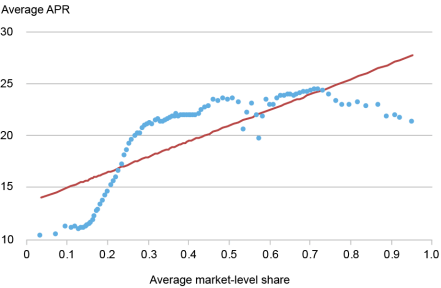
Matched account groups show higher average APRs where lenders hold larger shares; correlation is 54 percent.1 / 2
Two borrowers with similar credit scores and incomes can be offered noticeably different rates by the same credit card lender. In a recent paper, summarized on the New York Fed's Liberty Street Economics blog, economists Kyle Herkenhoff and Juan Morelli point to one reason: the lender's share of each borrower's market segment.
The problem
High card rates and wide rate gaps are consistent with 1, the ability to price above what competition would allow. But riskier borrowers also pay more, and banks' costs differ, so high rates alone prove little.
The authors start from the fact that lenders target specific kinds of borrowers. They divide the industry into 960 national markets by credit-score group, card and product type, how the customer was acquired, and ZIP-code income. A lender operates in about 200 of them in a typical week, and can be large in one and small in another. Its share is its revenue divided by the market's total.
The first clue
Using confidential data from the 2, a federal bank regulator, they group closely matched new accounts. Each group's average 3, the yearly cost of borrowing, correlates 54 percent with the average share of its lenders. The authors say the link survives controls for default risk and lending costs, but still call it descriptive, since large-share markets could differ in unseen ways.
The sharper test
So they compare a lender with itself, using about 14 million new cards. They look at new accounts because that is when the lender chooses its rate; afterward, most APRs largely follow a contractual benchmark.
Their main event is January 2008, when the 4, the Fed's overnight policy rate, fell unexpectedly by 25 5 (0.25 percentage point). That surprise lowered lenders' funding costs. The authors compare cards issued just before and after it, removing changes common to all of a lender's markets and adjusting for borrower and card differences.
The authors' hypothetical shows the logic: a lender might cut new-card rates by 15 basis points where its share is high and 20 where it is low. That gap measures how much less of the saving it passes along, known as 6.
The result
Two weeks after the surprise, pass-through was 20 percent lower in a lender's high-share markets, meaning the top 30 percent of shares. By the authors' translation, at a 10 percent average adjusted APR, that means a cut 2 percentage points smaller per 1 point move in the 7, the return on a virtually default-free investment.
The caveats
The effect stays sizable across the rest of 2008. It is smaller, though still statistically significant, across rate moves through 2019. So the 20 percent figure comes from an unusually clear crisis-era event, and the data stop in 2019. The study also covers only new cards, not existing balances.
Why can two borrowers with similar credit scores and incomes get noticeably different credit card offers, even from the same lender? Kyle Herkenhoff of the University of Minnesota and Juan Morelli of the New York Fed argue that part of the answer is the lender's position in each borrower's corner of the market. In a recent paper, summarized on the New York Fed's Liberty Street Economics blog, they study roughly 14 million newly issued cards. When a lender's funding costs fell, it passed less of the decline into new offers where its market share was large.
Why high rates alone prove little
High card rates, a concentrated industry and wide differences in rates are all consistent with 1, the ability to price above what competition would allow. But as the authors note, none of these facts on its own shows how lenders actually set prices. Riskier borrowers pay more because they default more, and banks differ in their costs. A convincing test has to separate those forces from a lender's competitive position.
Defining the markets
The authors start from the point that card lenders do not compete in one national market. Industry reports, regulatory guidance and academic research document segmentation by credit risk, income, card features and the channel through which a customer is acquired. A prime borrower applying online for a general-purpose card that isn't 2 (issued jointly with a retailer or airline, for instance) is in a different market from a subprime borrower accepting a preapproved co-branded offer.
Using those practices, the authors define 960 nationwide markets by combining four credit-score groups, card and product type, acquisition channel, and income groups based on the borrower's ZIP code. On average, a lender operates in about 200 of them in a given week. Its share in each is its revenue divided by total revenue in that market. Because one lender can be large in one segment and small in another, the same institution can be compared with itself.
The first look: a correlation
The data come partly from confidential account-level records collected by the 3, the federal regulator of national banks. These report the 4, the yearly cost of borrowing, along with borrower and card details for new accounts. The authors form groups of closely matched accounts and compare each group's average APR with the average share of the lenders issuing those cards. The correlation is 54 percent: higher shares go with higher APRs.
In a companion paper, they report that this link holds after accounting for borrower traits such as default risk and bank traits such as lending costs. They also look inside each group, where score, income and card type are fixed by construction, and find that APR gaps widen as gaps in lenders' market positions widen.
The authors call these patterns suggestive but descriptive. Large-share markets could differ in ways the data don't capture, and those differences could affect rates too.
The sharper test: a surprise in funding costs
So they examine how the same lender reacts to the same shock across its different markets. Two design choices matter.
First, they study accounts at origination, the moment a card is opened. After that, most variable-rate APRs follow a contractual benchmark, so changes are partly mechanical. At origination, the lender actually chooses the rate, including its spread over that benchmark.
Second, they use unexpected moves in the 5, the return on a virtually default-free investment, which shift lenders' cost of funds. Their baseline event is January 2008, when the 6, the Fed's overnight policy rate, fell unexpectedly by 25 7 (a basis point is 0.01 percentage point). It was one of the largest surprises of its kind. Comparable Federal Reserve data extend the analysis to further events through 2019.
They compare cards issued shortly before and after each surprise. They strip out APR changes common to all of a lender's markets and adjust for credit score, income, card type and other observed differences. The result, which they call the adjusted APR, isolates how one lender treats its high-share markets relative to its low-share ones, around the same surprise.
The authors' hypothetical shows the logic. Suppose the risk-free rate falls 25 basis points. Full 8 would cut new-card APRs by 25 basis points everywhere. If the lender instead cuts 15 basis points in its high-share market and 20 in its low-share market, that 5-point gap measures how much less it passes through where it is bigger. Those numbers illustrate the method and are not estimates.
What they found
"High share" here means the top 30 percent of the market-share distribution. Two weeks after the January 2008 9 event, pass-through was 20 percent lower in a lender's high-share markets than in its low-share markets.
The authors translate this as follows: at an average adjusted APR of 10 percent, the lender cuts the rate 2 percentage points less in the high-share market per 1 percentage point change in the risk-free rate. As this digest's own arithmetic, scaling that to a 25-basis-point move gives a gap of about 0.5 percentage point, or roughly $25 a year on a $5,000 revolving balance.
The result is not confined to one date. It remains sizable across the large surprises in the rest of 2008. Including all qualifying increases and decreases from 2008 through 2019, the estimate is smaller but still statistically significant. The post gives no figure for either of these wider samples.
Caveats and open questions
The headline event is unusual. January 2008 fell early in a financial crisis, and the wider sample's smaller estimate suggests the 20 percent figure sits at the high end.
The data are not recent. The events analyzed end in 2019, so the post doesn't show whether the pattern holds at today's rates or among today's lenders.
Only new cards are covered. The test says nothing about how issuers reprice existing balances beyond the contractual benchmark.
Markets are the researchers' construct. The 960 segments are guided by industry practice, but real competitive boundaries may differ. The post doesn't report how results change under other definitions.
Unobserved differences could remain. Comparing a lender with itself removes anything common to that lender, yet its markets might differ in, say, how rate-sensitive their borrowers are. That sensitivity may itself be part of what market power means, and this post can't fully separate the two.
Rate rises aren't reported separately. The wider sample pools increases and decreases, so the post doesn't say whether high-share lenders also raise rates by less.
Remember
Competition isn't national: one lender can dominate one borrower segment and be a minor player in another.
Comparing one lender with itself removes lender-wide explanations, such as its overall funding costs, from the rate gap.
The 20 percent gap comes from a single 2008 event; the estimate through 2019 is smaller but still significant.
Social Security's annual balance over time: deficits before 1983, trust-fund surpluses, then drawdown and projected deficits.1 / 2
Social Security's promised payments exceed its projected revenues by about $29 trillion over the next 75 years, according to its 1, the specialists who forecast the program's finances. Under current law, that means a cut of about 22% to all benefits starting around 2032.
Economist Timothy Taylor argues on his Conversable Economist blog that politicians shouldn't get away with simply promising no cuts. They should have to name the tax increases or benefit cuts they would accept. He draws on a July talk by economist Mark Duggan, the 2 at the 3, a private research organization.
How the program got here
Social Security also faced a shortfall in the early 1980s. The biggest step in the 1983 rescue was gradually raising the 4, when a worker qualifies for full benefits, from 65 to 67. Anyone 46 or older in 1983 was untouched. The surpluses that followed built a 5, a reserve that is now being drawn down.
Little has been done since. Small changes decades ago would have compounded into a lasting fix. Taylor's summary: "the broad bipartisan compromise was one of neglect."
The options
If current recipients are protected, Taylor sees these ways to fill the gap:
General tax revenue. Federal debt relative to GDP is already nearing historic highs. This would also break the contributory principle, which ties benefits to payroll taxes paid in.
Indirect benefit cuts. The retirement age could rise another year or two, or the benefit formula or inflation adjustment could be changed. Duggan notes that US public pensions tend to be higher than those in other countries.
Why it keeps coming back
Duggan says the program wasn't built to withstand falling fertility and immigration, longer lives, wider earnings inequality and a shrinking labor share of income. Together, these mean fewer workers per retiree, more years of benefits and less taxable pay.
Taylor expects politicians to appoint a commission, then fall back on general revenue. He would rather exempt everyone 46 or older and phase in a new system for everyone else: a low universal public benefit to prevent elderly poverty, with private retirement accounts on top. That is his opinion rather than a costed plan, and he doesn't say how the transition would be paid for.
Social Security's promised payments exceed its projected revenues by about $29 trillion over the next 75 years, according to the program's 1, the specialists who forecast its finances. If the law doesn't change, all benefits fall by about 22% starting around 2032. For illustration, a $2,000 monthly check would become $1,560.
Timothy Taylor, the economist behind the Conversable Economist blog, argues that this should be the question put to every politician. A general promise not to cut benefits shouldn't suffice, he writes. Candidates should have to name the actual combination of tax increases and benefit cuts they would support.
His post builds on "Social Security Reform in an Era of Fiscal Deficits," a talk by economist Mark Duggan. Duggan gave it last July as the 18th annual 2 at the 3, a private economics research organization.
The last rescue, and the neglect that followed
Taylor graduated from college in 1982, when the program was also short of money, with promised payments exceeding incoming revenue. The 1983 reforms set the path his working life would follow. He would pay in to support people already retired or near retirement. He would also help build a 4, a reserve meant to help finance benefits for people retiring from the early 2000s. And around the time he reached retirement age, the money would run short again.
The 1983 package had three main parts:
A later retirement age. Duggan calls this the single biggest step. It gradually raised the 5, when a worker qualifies for full benefits, from 65 to 67.
Faster tax increases. Some payroll tax increases already on the schedule took effect sooner.
Taxes on benefits. Recipients with high incomes began paying tax on their Social Security income.
The retirement-age change phased in so slowly that it had zero effect on anyone aged 46 or older in 1983. That made it politically easier to pass, and its savings arrived decades later.
Duggan's first chart shows the whole cycle: annual deficits before 1983, surpluses as the trust fund grew, deficits as it has been drawn down, and the larger deficits still ahead.
Duggan's frustration is that none of this was hidden. Relatively small changes made decades ago would by now have compounded into enough savings to preserve the program for decades. The retirement age could have been nudged up further, for example. Taylor's verdict: "the broad bipartisan compromise was one of neglect."
The options
Taylor takes as a baseline that people already receiving benefits shouldn't see them reduced. The question is then how to fill the gap, and each route has a cost.
General tax revenue. Congress could simply cover the shortfall from the wider federal budget. Taylor sees two problems. US government debt relative to GDP is already spiking toward historic highs, so there is no revenue to spare. And it would change what Social Security is. Today it is a 6, in which benefits are based on payroll taxes paid in. Part of it would become an ordinary budget program.
Indirect benefit cuts. An outright cut looks politically unlikely, but several changes have the same effect:
Raising the full retirement age by another year or two, which means a smaller monthly check for someone who claims at the same age as before.
Adjusting the formula that turns a worker's highest 35 years of earnings into a benefit.
Tweaking the annual inflation adjustment, which would compound over a long retirement.
Duggan also points out that US public pension payments tend to be higher than those in other countries, which he presents as context for this debate.
A higher payroll tax rate. The 12.4% rate has not risen since 1990. Half is charged directly to the worker. The other half is charged through the employer, and Taylor treats it as falling indirectly on the worker too. The actuaries estimate that raising the rate to 17.3% would keep the program solvent until 2100. That is a 4.9-point increase, or roughly 40% more than today's rate. For illustration, on a $60,000 salary the combined annual tax would go from $7,440 to $10,380.
Removing the earnings cap. Duggan calls this perhaps the most widely discussed change, and Medicare's cap was removed the same way in 1994. If the extra tax didn't also raise benefits, it would close a "substantial fraction" of the gap. But it would push 7, the tax on each additional dollar earned, "well beyond 60 percent" for many high earners in high-tax states such as California and New York. Duggan warns that this could reduce how much those people work, which would also shrink other revenue such as income tax receipts.
Why a one-time fix may not last
Taylor says it isn't hard to sit at a desk and assemble a plan from these pieces. Duggan's deeper point is that the program's structure wasn't designed for the forces now acting on it. He lists five, describing them as "a perfect storm." The article names these without explaining them, but the mechanics are straightforward:
Declining fertility and declining immigration mean fewer workers paying in per retiree.
Rising life expectancy means benefits are paid for more years.
Rising earnings inequality puts more income above the cap, out of reach of the tax.
A declining 8, meaning workers get a smaller slice of national income, shrinks the wages being taxed even when the economy grows.
Taylor's prediction and proposal
Taylor expects politicians to appoint a commission first and, if that fails, to turn to general tax revenue. He fears the chance to redesign the program will be lost along the way.
His case for redesign is that the economy of 1935, when Social Security was enacted, no longer exists. Private pensions were rare then, and 401(k)s and IRAs did not exist. He suggests copying the 1983 approach by making no changes for anyone 46 or older. For everyone else, the US would phase in a two-layer system over several decades: a universal but low public benefit to keep any elderly person out of dire poverty, with private retirement accounts on top.
This is Taylor's opinion, not a costed plan or Duggan's stated proposal. The post doesn't say how the transition would be paid for, a well-known difficulty with such shifts, since younger workers would still be funding current retirees while also saving for themselves. It also doesn't show how much of the gap most options would close, or say whether the $29 trillion is adjusted to today's dollars.
Remember
The 1983 fix worked partly because its biggest change arrived slowly, sparing everyone 46 or older and saving money decades later.
Waiting raises the price: small changes made decades ago would have compounded, while today's fixes must be much larger.
A one-time fix leaves the underlying pressures in place: fewer workers per retiree, longer lives and a shrinking share of income subject to the tax.
MBA seasonally adjusted purchase index, with weekly readings in blue and four-week average in red, showing depressed activity.1 / 2
Mortgage applications fell 1.2% in the week ending October 30, 2026, according to the 1 (MBA), a lender trade group that surveys application volume weekly. The annual comparison is starker: applications to buy a home were 19% below the same week last year, and applications to refinance were 60% lower.
Lower rates, little response
The drop came as borrowing got slightly cheaper. Mike Fratantoni, the MBA's chief economist, said mortgage rates drifted to their lowest level since September after the Federal Reserve decided in October to hold off on further rate hikes. The average 30-year rate fell to 7.3%.
Activity still didn't pick up. The seasonally adjusted 2, which tracks home-buying applications after correcting for normal calendar patterns, fell 2% on the week. The 3, which tracks applications to replace an existing mortgage, rose just 0.1%.
Refinancing generally pays only when the new rate is meaningfully below the one a homeowner already has, and 7.3% fails that test for anyone holding a cheaper loan. Bill McBride, author of the CalculatedRisk newsletter, describes the index as historically very low in data going back to 1990.
A turn toward adjustable rates
Fratantoni says more borrowers are choosing 4 (ARMs), whose rates typically start lower and later reset, in order to cut their initial payments. The ARM share of applications is at its highest since September 2025.
To illustrate, using a hypothetical ARM rate since the article gives none: a $400,000, 30-year loan costs about $2,742 a month at 7.3% and about $2,476 at 6.3%. That $266 monthly saving comes with risk, because the payment can rise when the rate resets. A growing ARM share suggests buyers are taking on future risk to make today's payment affordable.
Why prices could feel it
McBride combines this weak demand with a supply point he made earlier in the week: single-family inventory is back to 2019 levels. High rates limit what buyers can pay, while more listings give the remaining buyers more choice. He expects 5, meaning sales of previously owned homes, to slow over the coming months, with house prices under pressure.
That is a forecast, and he puts no number on it. Applications are also an imperfect gauge, since they miss cash buyers and don't all become completed sales. The article doesn't give the ARM share, last year's mortgage rates or recent price data, so it shows the direction of the pressure, not its size.
Mortgage applications fell 1.2% in the week ending October 30, 2026, according to the 1 (MBA), a lender trade group that publishes a weekly survey of application volume. One week's move says little. The comparison with a year ago says more: applications to buy a home were down 19%, and applications to refinance were down 60%.
Bill McBride, who writes the CalculatedRisk newsletter, pairs those figures with a supply point he made earlier in the week: single-family housing inventory is back to 2019 levels. More homes for sale and fewer willing borrowers is the core of his view on where the market is heading.
The week's numbers
The MBA reports several indexes, each tracking a different slice of application volume:
Measure
Week over week
Year over year
2, seasonally adjusted
-1.2%
not given
Market Composite Index, unadjusted
-2%
not given
3
+0.1%
-60%
4, seasonally adjusted
-2%
not given
Purchase Index, unadjusted
-4%
-19%
The Market Composite Index combines all mortgage applications. The Purchase Index covers loans to buy homes, and the Refinance Index covers loans that replace existing mortgages.
The adjusted and unadjusted figures answer different questions. "5" means the number has been corrected for normal calendar patterns, such as home buying typically slowing as the year ends. That makes it the better guide to week-to-week change. The purchase index's unadjusted drop of 4% shrinks to 2% after adjustment, which suggests part of the decline was the kind of seasonal slowdown expected at this time of year.
The 19% annual figure is unadjusted, which is reasonable because the same week a year earlier falls at roughly the same point in the seasonal cycle.
Slightly cheaper money didn't help
The notable part is the timing. Mike Fratantoni, the MBA's chief economist, said mortgage rates drifted to their lowest level since September after the Federal Reserve decided at its October meeting to hold off on further rate hikes. The average 30-year rate fell to 7.3%. Even so, he called activity "quite slow," with purchase volume down and refinance volume "effectively flat at a very low level."
Refinancing shows why a small dip doesn't do much. A homeowner generally gains from refinancing only if the new rate is meaningfully below the existing one, and a modest drop to 7.3% leaves that test unmet for anyone who already holds a cheaper loan. McBride describes the refinance index as historically very low, based on data going back to 1990, and says it has fallen recently as mortgage rates rose.
Borrowers look to adjustable rates
Fratantoni also pointed to a shift in what borrowers are choosing. The share of applications for 6 (ARMs), whose rates are typically lower at first and then reset periodically, is at its highest since September 2025. He says borrowers are using them to lower their initial payments.
Here is an illustrative calculation; the article gives no ARM rates, and the 6.3% below is hypothetical. On a $400,000 loan paid off over 30 years, a 7.3% rate means a principal and interest payment of about $2,742 a month. At 6.3%, it would be about $2,476, or roughly $266 less.
That saving comes with a trade-off. If the rate resets higher once the initial period ends, the payment can rise. A fixed-rate borrower faces no such risk, and can refinance if rates later fall. A rising ARM share is therefore a sign of affordability strain: buyers are accepting future rate risk to make today's payment work.
McBride's read
McBride concludes that with 30-year rates at 7.3%, 7, meaning sales of previously owned homes, will likely slow over the coming months, and house prices will be under pressure. The logic runs from both sides of the market. High rates shrink what a buyer can afford to pay each month, which reduces demand, while inventory at 2019 levels gives the remaining buyers more choices and less urgency.
This is a forecast rather than a measured outcome, and McBride attaches no number or timeline beyond "the coming months."
What the data leaves open
Application counts are a partial measure. They capture people who applied with a lender, not completed purchases, and they miss cash buyers entirely. The article's charts use a four-week average alongside the weekly series because the weekly data is noisy.
The article also doesn't provide the current ARM share, the size of the increase in inventory, what mortgage rates were a year ago, or any recent house price data. Without those, it shows the direction of the pressure but not its size. The latest rate dip is also only a single week's move, too early to show whether borrowers will respond if rates keep falling.
Remember
Annual comparisons reveal more than weekly moves: a 0.1% weekly refinance gain sits beside a 60% yearly decline.
A small rate dip rarely revives refinancing, because owners only benefit when new rates beat their existing loan.
Lower initial ARM payments trade today's affordability for the risk of higher payments after the rate resets.
Would a lottery win turn continental Europeans into stock investors? Mostly not, according to a study by Christelis and co-authors (2025), summarised by investment writer Joachim Klement. Even after a hypothetical €50,000 prize, more than 60% of eurozone households say they would own no stocks at all.
The question
Klement starts from a common complaint: continental Europe lacks the 1 of the Anglo-Saxon world. But low ownership could simply mean people lack spare money. A windfall helps test that, by asking whether choices change when money is added.
The test
The researchers used the 2, a household survey run by the European Central Bank. It covers 2,000 households each in Germany, France, Italy and Spain, plus 1,000 each in the Netherlands and Belgium. Respondents said what they would do with a lottery win of €5,000 to €50,000.
Klement explains why this setup should favour stocks:
3: people treat money in separate mental categories, and they tend to invest windfalls more aggressively than earned income.
Capacity for risk: people with more money tend to invest more in stocks because they can afford to lose more.
The results
Both effects show up, but they are small.
Among non-stockholders, a €50,000 win raises participation by 8.4 to 12.8 4.
Among existing stockholders, the average share of money in stocks hardly changes.
Across households, more than 60% would still not invest in stocks.
To illustrate: of 1,000 households with no stocks, about 84 to 128 would buy in after a €50,000 win. At least 870 would stay out.
Klement concludes that it takes a lot more than a windfall to get Europeans into stocks.
The caveats
These are stated intentions, not the actions of real winners, and people may behave differently once the money is real. Klement also notes that €50,000 isn't life-changing, so a much larger sum might have a stronger effect.
The article doesn't say whether stocks held through pensions count as ownership. That matters because the Netherlands relies heavily on 5 that invest in markets, while the other large economies here lean more on public pensions. It also gives no comparable US or UK figures to measure the gap against.
Nor does it explain the resistance. The wider research points to low trust in markets, limited financial knowledge, the effort of getting started and the security of state pensions, but this write-up doesn't test any of them. What it does suggest is narrower: for most of these households, a shortage of spare money doesn't seem to be the whole barrier.
Would a lottery win turn continental Europeans into stock investors? Mostly not, according to a study by Christelis and co-authors (2025), summarised by investment writer Joachim Klement. Even after a hypothetical €50,000 prize, more than 60% of eurozone households say they would hold no stocks at all.
The question behind the study
Klement starts from a familiar complaint: continental Europe has no 1, at least nothing close to what he sees in the Anglo-Saxon world. The hard part is explaining why. Low ownership could reflect a lack of spare money, or something more durable, such as attitudes and preferences. Looking at who owns stocks today can't easily separate the two, because wealth and attitudes tend to travel together.
A windfall offers a way to test this: give people more money and see whether their choices change. Real lottery winners are scarce, so these researchers asked a hypothetical question instead.
How the test worked
The data come from the 2, a regular household survey run by the European Central Bank. It covers 2,000 households each in Germany, France, Italy and Spain, plus 1,000 each in the Netherlands and Belgium, or 10,000 in total. Respondents were asked what they would do with a lottery win of between €5,000 and €50,000.
Klement points to two established findings from behavioural finance that make this a favourable setup for stocks:
3. People sort money into separate mental categories, and they tend to invest windfalls more aggressively than money they earned.
Capacity for risk. People with more money tend to invest more in stocks because they can afford to lose more.
Both forces should push a lottery winner toward the stock market. So if a windfall can't shift behaviour much, that says something about how strong the resistance is.
What the numbers show
Both effects appear in the data, but they are small. Klement reports three results:
Non-stockholders: after a €50,000 win, their participation rate rises by 8.4 to 12.8 4. The article doesn't say what produces this range, though it mentions both a stocks-only measure and a stocks-plus-mutual-funds measure, which may be the reason.
Existing stockholders: the average share of money they put in stocks hardly changes. A windfall doesn't make them noticeably bolder.
All households: more than 60% would still not invest in stocks at all.
An illustration of the scale: take 1,000 households that own no stocks. Offer each a €50,000 prize, and roughly 84 to 128 of them would buy in. The other 870 or more would stay out, despite receiving a sum larger than many households hold in savings.
Klement concludes that it takes a lot more than a windfall to get Europeans into stocks.
Why this should be read with care
The largest result rests on what people say they would do, not on what actual winners did. Stated intentions can differ from behaviour once real money arrives, and the article doesn't address how large that gap might be here.
Klement also notes that this isn't life-changing money. A household offered far more might behave differently, so the finding doesn't show that money is irrelevant at every scale.
The measure of ownership matters too. The article doesn't say whether stocks held indirectly through pensions count. That could be significant, because retirement systems differ widely. Public 5 are central in countries like Germany, France, Italy and Spain, while the Netherlands relies heavily on 6 that invest in markets. A Dutch worker may have considerable stock exposure without ever choosing a share or a fund. For the same reason, any comparison with the US or UK needs matching definitions, and the article gives no figures for those countries.
What remains open
The article shows that resistance survives a windfall, but not what causes it. Economists' usual candidates, which come from the wider literature and not from this write-up, include low trust in financial markets, limited financial knowledge, the effort of getting started, and the security of generous state pensions. Which of them matters most in Europe is left unanswered here.
That gap has practical stakes. The European Commission is promoting a 7, a plan that includes channelling more household savings into markets. These survey results suggest that simply leaving people with more money to invest would do little by itself. The article doesn't test what would work instead.
Remember
Windfalls change whether some households invest, but barely change how much existing stockholders allocate to stocks.
Survey answers about imaginary prizes measure intentions, so real lottery winners could behave differently.
Cross-country ownership comparisons depend on whether stocks held through pensions are counted.
For years, Clements took his Toyota Sienna minivan to the dealership and liked his 1, the staff member who manages a customer's visits and presents recommended work. About a year ago, the dealership recommended replacing the 2, the small connecting parts between the suspension and a bar that limits body lean in turns. The quote was about $600. Six months later the same recommendation returned at about $1,000, a 67% increase. The article doesn't say why the price rose.
His first instinct was to pay. Few owners can inspect their own suspension, and car repair is what economists call a 3: the buyer often can't verify the need for the work, even after it's done. The expert who makes the diagnosis usually also sells the cure.
What the second shop found
Clements and his spouse read up on the symptoms of worn links, weren't convinced, and postponed the work. At the next six-month service, he went to Boca Auto Fix, a family-run independent shop he had used for his sister's car.
The shop's preliminary estimate for the links was about $400, subject to inspection and 60% below the dealer's latest figure. After the diagnostic check, staff reported no wear and said replacement wasn't necessary. They also ranked the other work the van needed by what deserved priority and what could wait.
What this does and doesn't show
Clements draws a lesson about trust: a pleasant waiting room matters less than honest advice. He is careful on the key point, saying he can't explain why the two shops disagreed.
That caution is warranted. This is one car and one disagreement, with no third inspection to settle who was right. It doesn't show that dealers oversell or that independents are more honest. The new shop also had its own reason to impress a returning customer, and the $1,000 may be postponed rather than saved, since parts wear over time. The article gives no figure for the other work he did approve.
The practical habit holds up better than any verdict on the shops. When a non-urgent repair is expensive and you can't judge it yourself, get a second inspection and a second price. Clements's two quotes for the same job differed by $600, before anyone questioned whether the job was needed. For anything affecting safety, ask how soon it must be fixed before deciding to wait.
Andrew Clements, writing on the personal-finance site HumbleDollar, describes nearly paying $1,000 for a suspension repair on his Toyota Sienna minivan. An independent shop then inspected the same parts and told him to leave them alone. The story is a single personal anecdote, not a study, but it illustrates a common money problem clearly.
The problem: buying advice from the seller
Clements used his dealership for maintenance for years. He liked his 1, the staff member who manages a customer's visits and presents recommended work. She kept him informed, and he assumed the dealer knew exactly what a Toyota needed.
About a year ago, the dealership recommended replacing the 2. A sway bar ties a car's left and right suspension together to limit body lean in turns, and the end links attach the bar to the suspension. The quote was about $600. Six months later, the recommendation came back at about $1,000, a 67% increase. The article doesn't explain the rise.
His first instinct was to approve it. As he puts it, most people aren't mechanics and depend on someone else's expertise, and a recommendation carries weight when it concerns the car you drive every day.
Economists have a name for this situation. A 3, a term popularized by economists Michael Darby and Edi Karni in 1973, is something whose quality or necessity the buyer can't easily verify, even after purchase. If new end links go on and the van drives the same, the owner can't tell whether they were needed. And the party making the diagnosis generally earns money from the fix. That doesn't mean anyone is dishonest. It means the buyer has little way to check, so a price comparison alone doesn't solve the problem.
What Clements did
He took two steps before spending anything.
He checked the symptoms. He and his spouse researched what worn end links typically produce and weren't convinced the van needed the work yet, so they postponed it.
He got another professional's assessment. At the next six-month service he went to Boca Auto Fix, a family-run independent shop owned by Alissa and Doug DeLucca, which he had used for his sister's car.
When booking, he mentioned the dealer's recommendations. Karina, the shop's 4, a staff member who explains findings and estimates to customers, prepared estimates in advance. The figure for the end links was about $400, subject to inspection and 60% below the dealer's latest quote.
Nico, the shop's mechanic, then ran a diagnostic assessment. Karina called to go through the results, separating what deserved priority from what could wait. The shop found other work worth doing, and Clements doesn't say what it was or what it cost. On the end links, it reported no wear and tear, and said replacement wasn't necessary.
The numbers
Source
End-link recommendation
Approximate price
Dealer, about a year ago
Replace
$600
Dealer, six months later
Replace
$1,000
Independent, before inspection
Estimate only
$400
Independent, after inspection
No replacement needed
$0
Two separate gaps sit in that table. One is price: $600 between the two quotes for the same job. The other is need: whether the job should happen at all. Shopping around addresses only the first. An inspection by someone else addresses both.
Is a second look worth paying for?
The article doesn't report a fee for the diagnostic assessment, so here is an illustration with invented numbers. Suppose a second inspection costs $100 and you think there's a one-in-five chance it will cancel a $1,000 repair. The expected saving from cancellation alone is $200, already double the cost. If the second shop also does the work for less when it is needed, the case gets stronger. For a $150 repair, the same arithmetic yields $30 of expected saving against a $100 fee, and you're better off just paying. The check earns its cost on large, non-urgent jobs that you can't assess yourself.
Clements's conclusion, and its limits
Clements argues that trust is the real asset in a service business, drawing on years of running a company with his twin brother. Customers remember how they're treated, he says, then return and tell their friends. He cites Alissa remembering him and the deaths of his sister and brother, Karina's preparation, and the team's willingness to say what the car didn't need. His closing point is that a pleasant waiting area makes a visit comfortable, but honest advice decides the next one.
The evidence supports less than the warmth of the story suggests, for several reasons.
The disagreement is unresolved. Clements himself says he can't explain why the shops reached different conclusions. There was no third inspection, and technicians can reasonably judge borderline wear differently.
It's a sample of one. Nothing here shows that dealers oversell in general or that independents are more honest in general.
The second shop had incentives too. It was courting a returning customer, and it did recommend other work. Passing on a $400 job can build trust that pays off later.
The saving may be a deferral. Parts wear with use. The $1,000 is off the list for now, and the article doesn't say whether the links will need replacing eventually.
His reviews and impressions aren't audits. Glowing online reviews and a kind greeting raised his confidence, but neither measures diagnostic accuracy. The test here was the inspection result, which remains one opinion against another.
One further caution comes from general good sense rather than the article: postponing suits work that isn't urgent. For anything that affects braking, steering or safety, the right first question is how soon it must be fixed, and a second opinion should come quickly rather than at the next scheduled service.
What survives is modest and useful. When a large recommendation arrives from someone who also sells the fix, treat it as one informed opinion. Ask what symptom or measurement supports it, and pay for another look when the sum justifies it.
Remember
Separate two questions on any big repair quote: is this price fair, and is this job needed at all?
A second inspection pays for itself most clearly on large, non-urgent repairs you can't assess yourself.
A cancelled repair may only be postponed, so count it as a deferred cost until the part proves otherwise.
A higher payroll tax. The 12.4% rate, split between worker and employer, hasn't risen since 1990. The actuaries estimate that 17.3% would keep the program solvent until 2100.
No earnings cap. Taxing all wages would close a "substantial fraction" of the gap. But Duggan warns it would push 6, the tax on each extra dollar earned, "well beyond 60 percent" for many high earners in states like California. That could reduce how much they work and shrink other tax revenue.