Old data pays off today: a 1999 Hubble spectrum, 1926 nerve recordings and 100,000 radiocarbon dates. Plus an Alzheimer's mechanism and an AI-found 3D tile.
Picked from 23 new articles across 10 sources · arrow keys for other days
Today in 30 seconds
30s left
Unexplained lines in a 1999 Hubble spectrum are niobium, never seen in a white dwarf before. They hint at a planet forming from a dead star's debris. story 1 ↓
A Cell study finds APOE4 makes the brain's blood-vessel support cells form scar tissue via TGF-beta, leading to fibronectin and amyloid buildup. story 2 ↓
Matteo Carandini re-processes Adrian and Zotterman's 1926 recordings, which first showed neurons signal in spikes. Firing-rate neuroscience rests on that finding. story 3 ↓
Chair44 is a 3D shape that fills space only in a non-repeating pattern. AI helped find it, and mathematicians have since checked it with their own proofs. story 4 ↓
More than 100,000 radiocarbon-dated hearths and bones put North America's population peak near A.D. 1150, about 350 years before Europeans arrived. story 5 ↓
This year's Nobel science prizes went to optogenetics, to cosmic neutrinos caught in Antarctic ice and to mirror-image molecules.
1/5Universe Today· Matthew Williams· Oct 12
Hubble archive hints at a planet born from a dead star's debris
Astronomers re-analysed old Hubble data on the white dwarf HS 0209+0832 and found niobium falling onto it. They argue it comes from a Jupiter-sized planet that formed from the dying star's own ejected material.
Why it matters · If it holds up, planet formation isn't a one-time event at a star's birth. Dead stars could start a second round, which would change how we count and model planetary systems.
Know this first
Context from the editor, not the article · 29 sec
1 · How Sun-like stars die
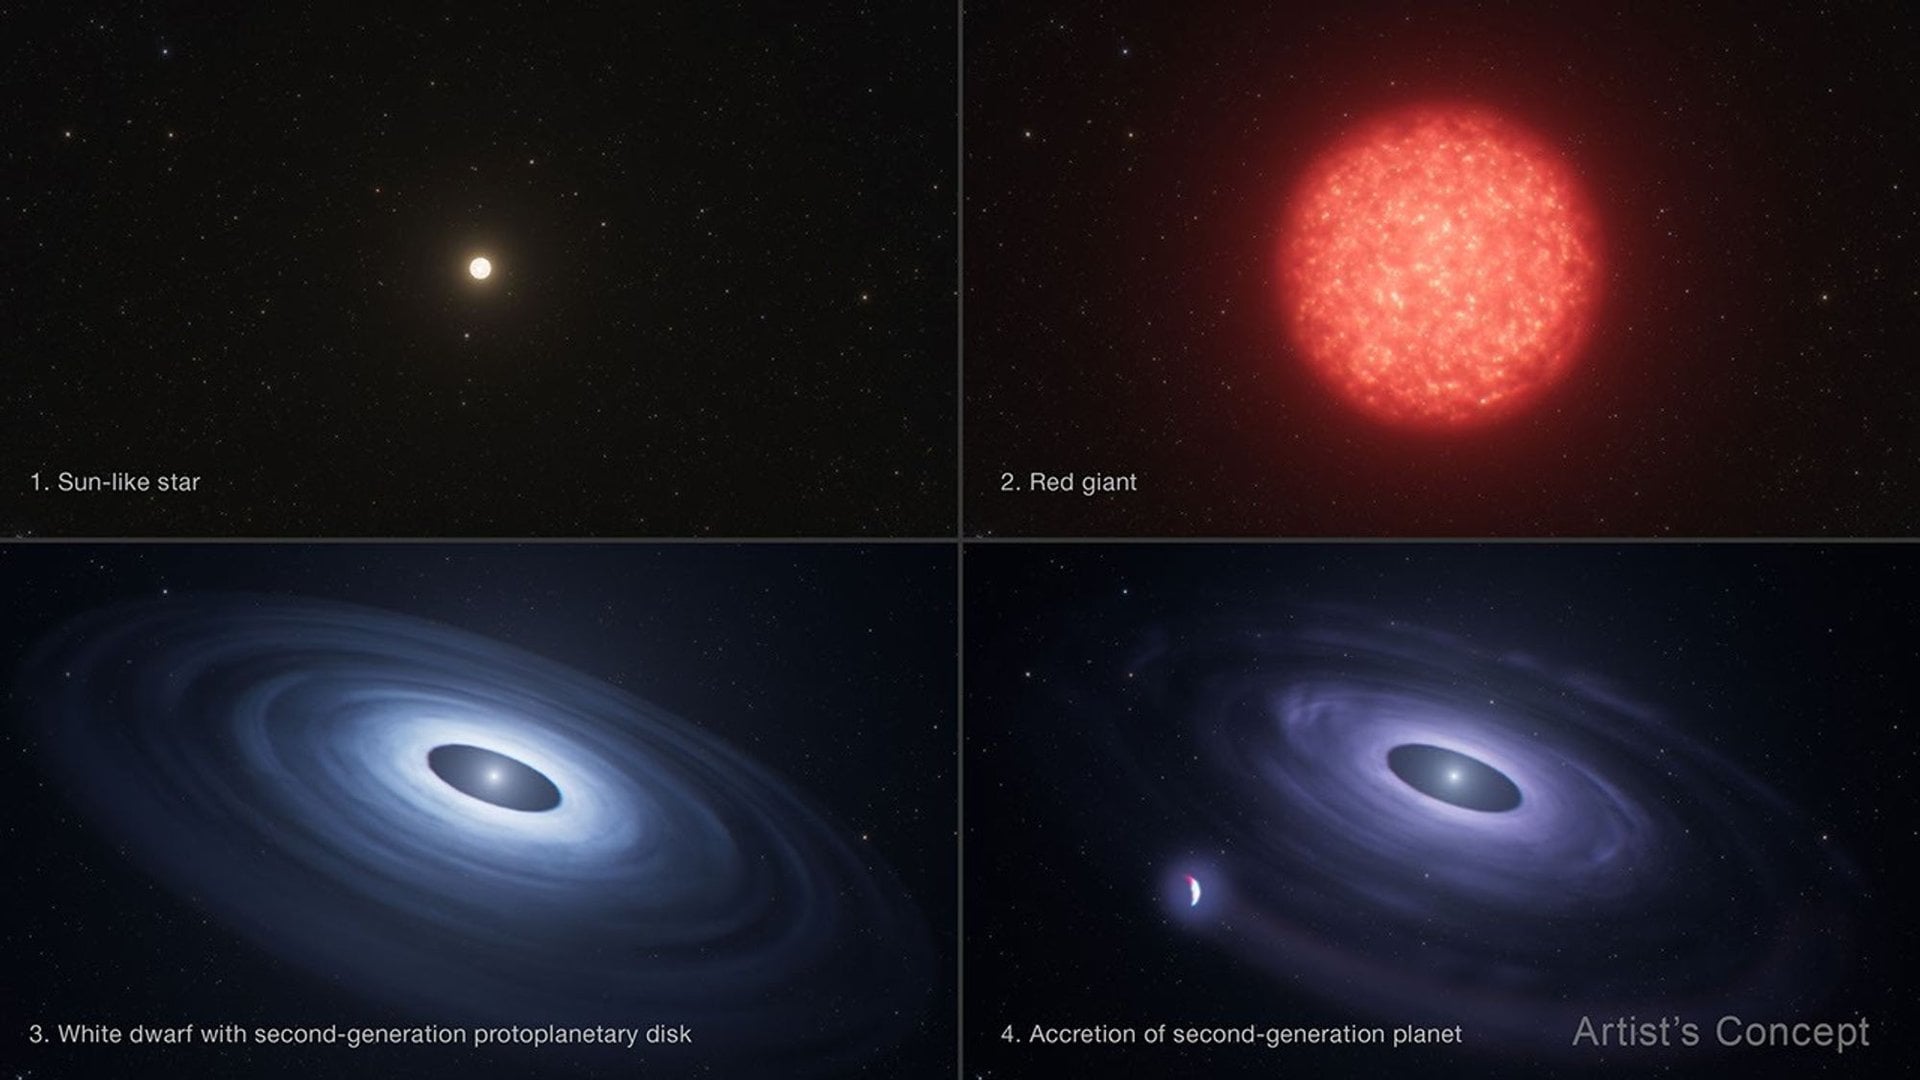
A star like the Sun swells into a red giant, gently sheds its outer layers into space, and leaves behind a white dwarf: a hot, Earth-sized core that slowly cools over billions of years. It does not explode as a supernova.
2 · Polluted white dwarfs
A white dwarf's gravity is so strong that heavy elements sink out of sight within days to millions of years. Any metals seen in its atmosphere must have arrived recently, usually as debris from asteroids or planets.
3 · Where heavy elements come from
Fusion in stellar cores builds elements only up to iron. Heavier ones, such as niobium, form when atomic nuclei capture neutrons. That happens in dying giant stars, in supernovae, and in neutron-star collisions.
2/5Science News· RJ Mackenzie· Oct 12
Alzheimer's gene APOE4 may turn blood-vessel support cells into scar tissue
Researchers at Mount Sinai report that APOE4, the biggest common genetic risk for Alzheimer's, pushes cells that wrap the brain's small blood vessels to become scar-forming cells. In lab models, this scarring helped amyloid build up.
Why it matters · It suggests the brain's blood vessels may help start Alzheimer's rather than only being damaged by it, and it points to steps in the process that drugs could block.
Know this first
Context from the editor, not the article · 29 sec
1 · What APOE4 is
The APOE gene makes a protein that carries fats through the blood. It comes in three common forms (alleles). APOE4 raises Alzheimer's risk the most, and two copies raise it most of all. Still, many carriers never develop the disease.
2 · Amyloid and its clearance
Clumps of the protein amyloid-beta, called plaques, are a hallmark of Alzheimer's and among its earliest signs. The brain normally clears amyloid partly through its blood vessels, so changes to vessel walls could affect how much builds up.
3 · Resilient carriers, 2024
A 2024 study of more than 3,500 people found that some carriers of two APOE4 copies who stayed free of Alzheimer's had a mutation that lowered fibronectin, a sticky wound-healing protein, in their blood vessels.
3/5The Transmitter· Matteo Carandini· Oct 12
A century ago, two scientists found that neurons talk in spikes
In 1926, Edgar Adrian and Yngve Zotterman recorded a single nerve fibre and found that it signals by changing how often it fires identical spikes, not how big they are. This became known as the neural code.
Why it matters · Nearly every modern finding about what neurons encode, from place cells to dopamine signals, rests on measuring firing rate, a quantity nobody knew existed before 1926.
Know this first
Context from the editor, not the article · 26 sec
1 · What a spike is
A neuron signals by firing brief electrical pulses called action potentials, or spikes. Each lasts a few milliseconds and travels down the axon, the long fibre that carries the neuron's output to other cells.
2 · All-or-none response
Before 1926, researchers knew a nerve responds fully or not at all once a stimulus passes a threshold. They had seen this only by shocking whole nerves, which made thousands of fibres fire together.
3 · Muscle spindles
Muscle spindles are stretch sensors embedded in muscles. When a muscle lengthens, they send signals up sensory fibres in the nerve, telling the nervous system how stretched the muscle is.
4/5Scientific American· Oct 12
A 3D shape that fills space only without repeating has been found
A non-mathematician used AI models to find and argue for Chair44, a chair-shaped 3D block that fills space only in patterns that never repeat. Mathematicians have now written their own proofs supporting the claim.
Why it matters · It settles a long-open question in tiling theory and is an early real case of AI-driven mathematics that humans then had to check and rewrite.
Know this first
Context from the editor, not the article · 31 sec
1 · Periodic vs aperiodic tilings
A tiling covers a surface or space with no gaps or overlaps. Bathroom tiles are periodic: shift the whole pattern by one step and it matches itself. An aperiodic tiling has no such shift anywhere.
2 · The 2023 'hat' einstein
For decades, getting aperiodic tilings took sets of two or more shapes, Penrose's pair being the famous example. In 2023 the 'hat' became the first single flat shape that can tile the plane only aperiodically. Such a shape is nicknamed an 'einstein', German for 'one stone'.
3 · Building tilings from supertiles
A common way to force aperiodicity is substitution: groups of tiles join into a larger copy of the same shape, called a supertile. Those join into larger ones again, with no end. The structure is like nested Russian dolls.
5/5Live Science· Kristina Killgrove · Oct 12
Radiocarbon dates suggest North America's population peaked around A.D. 1150
Archaeologists used more than 100,000 radiocarbon dates to track population in what is now the U.S. and Canada. Numbers peaked around A.D. 1150, centuries before Columbus, and were about 2 to 4 million by 1492.
Why it matters · The study shows how researchers can count people who left no census: they treat the waste of daily life as data. The approach is now replacing guesses that once ranged a hundredfold.
Know this first
Context from the editor, not the article · 27 sec
1 · The 'Great Dying'
After 1492, epidemic disease, warfare and enslavement killed a large share of the Americas' Indigenous people within decades. How large that share was depends on how many people lived there beforehand, which is still disputed.
2 · How radiocarbon dating works
Living things take in carbon-14, which decays at a known rate after death. Measuring what is left in charcoal, bone or seeds gives an age. The result is a probable range of dates, not a single year.
3 · Carrying capacity
Carrying capacity is the largest population a landscape can support with a given way of life. Early estimates of the Indigenous population assumed every suitable landscape was filled to that limit.
Artist's concept: a Sun-like star becomes a red giant, then a white dwarf whose ejected material builds a new planet.1 / 2
An international team led by astronomers at the University of Warwick reports possible evidence for a 1: one that formed from material a dying star threw off, not from the gas and dust left over at the star's birth. The paper appeared on 5 October in Nature Astronomy. The planet itself has not been seen. Its existence is inferred, and it remains a candidate until confirmed.
A 27-year-old puzzle
The star is HS 0209+0832, a 2 (the dense leftover core of a Sun-like star) with about 1% of the Sun's radius and 60% of its mass. When the Hubble Space Telescope observed it in 1999, its 3, the light broken into wavelengths, showed about 100 absorption lines nobody could identify. Re-examining the data with an updated database of atomic lines, lead author Williams and colleagues matched many of them to 4. No white dwarf has shown niobium before.
Why niobium points to a planet
A white dwarf's gravity pulls heavy elements below the visible surface quickly, so metals seen at the surface must be falling onto the star right now. Niobium is heavier than iron, which means ordinary fusion in a star's core can't make it. It forms in the extreme conditions inside dying stars. Co-author Nicholas Stone of the University of Wisconsin–Madison calls it "a signpost of these 'death' throes."
The team argues that the amount of niobium is too large to come from small debris. In their picture, the star's expelled outer layers, already enriched in heavy elements, partly gathered into a gas giant, and that planet is now being stripped and fed back onto the star. One correction to the source article: Universe Today says the star "went supernova." Sun-like stars that become white dwarfs don't explode. They shed their layers more gently, and giant stars at that stage are a known source of niobium.
The proposed planet
The team cross-checked the result with archival data from the retired 5 and used four months of observations from the 6. From these data they estimate a Jupiter-sized planet orbiting about 6 million km from the white dwarf, roughly a tenth of Mercury's distance from the Sun. The young, hot star would be boiling off the planet's atmosphere into a comet-like tail that slowly rains onto the star.
The team plans several more years of observations to test the idea and to learn how common such planets might be. The article doesn't say what observation would confirm the planet.
A team led by astronomers at the University of Warwick's Centre for Exoplanets and Habitability reports what may be the first evidence of a 1. That means a world formed from material a dying star expelled, not from the disc of gas and dust around a newborn star. The result was published on 5 October in Nature Astronomy, with co-authors from the Instituto de Astrofísica de Canarias, MIT, the Harvard & Smithsonian Center for Astrophysics, the Space Telescope Science Institute and other institutions. No one has seen the planet directly. It is inferred from the chemistry of its star and stays a candidate until confirmed.
The usual story, and the alternative
Planets are normally thought to form once. A young star is surrounded by an 2, a flattened ring of leftover gas and dust that spirals inward, and dust grains in that disc clump into planets. Earth formed this way about 4.5 billion years ago. When a Sun-like star nears the end of its life, it swells into a red giant, sheds its outer layers, and leaves a 3: a small, dense, very hot core. Astronomers have long wondered whether some of the shed material could settle into a fresh disc around the white dwarf and build new planets. That is hard to test, because the resulting planets would be faint, close to their stars, and easy to confuse with old planets that survived the star's death.
Re-reading a 1999 4
The star in question, HS 0209+0832, is a white dwarf with about 1% of the Sun's radius but about 60% of its mass. Hubble observed it in 1999 and recorded its spectrum, the starlight spread out by wavelength, in which each element absorbs light at its own characteristic wavelengths. About 100 of those absorption lines matched nothing known at the time.
Lead author Williams and colleagues went back to the archive with an updated database of atomic lines. Many of the mystery lines fit 5 (Nb), a metal used on Earth in steel alloys and superconducting magnets. "What Hubble is showing us in this white dwarf system is something we haven't seen before: a high abundance of the element niobium," Williams said, adding that she didn't recognise its signature when she first found it. Niobium had never been reported in any white dwarf. The team checked the Hubble result against archival data from the 6, a NASA ultraviolet observatory that is now retired.
How a chemical signature points to a planet
The reasoning has three steps.
First, the niobium is arriving now. A white dwarf's surface gravity is extreme, so elements heavier than hydrogen and helium sink out of view on timescales that are short by astronomical standards. Any metal visible at the surface is being supplied continuously. Astronomers already use these "polluted" white dwarfs to measure the make-up of asteroids and planetary fragments being shredded and swallowed.
Second, niobium is a product of dying stars. Fusion in stellar cores builds elements up to iron and stops there. Heavier nuclei form when existing nuclei absorb free neutrons. As co-author Nicholas Stone, a theorist at the University of Wisconsin–Madison, puts it, these elements "can only be synthesized in the exotic conditions that briefly emerge inside dying stars. The presence of niobium is a signpost of these 'death' throes."
Third, there is a lot of it. The team argues that the quantity is too large to come from a few rocky fragments. It points instead to a massive body rich in the dying star's freshly made material. Their proposed sequence: the star expels its enriched outer layers, part of that material gathers into a gas giant, and the rest disperses.
One error in the source article needs correcting. Universe Today writes that such a planet "could have formed only after its star went supernova." Stars that leave white dwarfs don't explode as supernovae. They lose their envelopes relatively gently during the late giant phase. Giant stars at that stage are a well-established site of slow neutron capture, a main source of niobium in the universe, so the team's scenario needs no explosion.
The candidate planet
The team also used four months of observations from the 7, which watches for the small dips in brightness caused by planets passing in front of their stars. The article doesn't say what TESS saw, or failed to see, or how it constrained the planet. From the combined data the team estimates a gas giant roughly the size of Jupiter orbiting about 6 million km from the white dwarf. For comparison, Mercury orbits the Sun at about 58 million km.
At that distance, and with a young white dwarf that is still extremely hot, the planet would be losing its atmosphere fast to intense radiation. The team suggests the escaping gas forms a comet-like tail. Some of that material falls into orbit around the star and eventually lands on it, which would explain the niobium Hubble detected. As an analogy: the star would be tasting its own planet as it slowly evaporates.
What's solid and what isn't
The well-supported part is the chemistry: niobium is in the star's atmosphere, and it must be arriving continuously. The planet is an interpretation of that chemistry, and the article gives no direct detection, mass measurement or orbital period. Several questions are open:
Could something else deliver the niobium? The article doesn't say how the team ruled out alternatives, such as a smaller enriched body or leftover material from the star's ejected shell.
Second generation versus survivor. A Jupiter-like planet from the star's original system could, in principle, migrate inward after the star died. The case for "second generation" rests on how much freshly made niobium there is. The article doesn't spell out that argument in detail.
Confirmation. The team plans to observe the system for several more years to learn about such planets, how common they are and how they evolve. The article doesn't say which measurement would settle the question.
Williams is optimistic about the planet's future: "If the second-generation planet is there, I think it is likely to survive. Eventually the white dwarf will cool and then maintain a consistent temperature, with the planet in its stable 8 for millions of years." For a gas giant, "habitable zone" only means the range of distances where temperatures would allow liquid water. It doesn't mean the planet could support life.
Williams argues the bigger point is conceptual: the white dwarf stage may not be "a kind of epilogue" but the start of "a potentially much longer tale." Whether HS 0209+0832 proves that depends on follow-up observations.
Remember
The niobium detection is the solid result. The planet is still an inference from the star's chemistry.
White dwarf gravity hides heavy elements quickly, so visible metals must be falling onto the star right now.
Old archive data, re-read with better atomic databases, can still produce discoveries 27 years later.
1 is the strongest common genetic risk factor for Alzheimer's disease. Six in 10 people with the disease carry it, yet many carriers never get dementia. How the variant makes the brain vulnerable is still unclear. A study published September 24 in Cell proposes one route: APOE4 pushes the cells that support the brain's small blood vessels to become scar-producing cells, and that scarring may help 2, the protein whose plaques mark Alzheimer's, build up.
Where the lead came from
APOE is the gene for a protein that carries fats in the blood. APOE4 is one of its three common forms. A 2024 study of more than 3,500 people found that some carriers of two APOE4 copies who stayed free of Alzheimer's had a mutation that sharply lowered 3 in their blood vessels. Fibronectin is a sticky wound-healing protein, and those researchers suggested too much of it might hamper the brain's clearing of amyloid.
Joel Blanchard of Mount Sinai in New York and his team asked whether vessel changes might help cause Alzheimer's, rather than only being damaged by it, as the field usually assumes.
What they found
The team combined three existing brain-wide datasets into an atlas of gene activity covering 66,000 blood-vessel cells from 220 people. People with two APOE4 copies had fewer 4, star-shaped cells that wrap and stabilize small vessels. They had more 5, scar-forming cells that usually appear after injury and pump out fibronectin.
A one-time snapshot can't show that one cell type turns into the other, so the researchers grew 3-D human brain tissue from stem cells. In tissue with two APOE4 copies, pericytes began taking on myofibroblast traits. When the cells were kept from making fibronectin, amyloid buildup dropped.
They also found a likely trigger: 6, an immune signaling molecule involved in scarring. Blocking it in the tissue models and in aged mice restored how many vessels were wrapped by pericytes.
Caveats
The proposed causal chain was shown in lab tissue and mice. In humans, the evidence comes from comparing brains, which shows associations. The article gives no figures for how much amyloid fell. Abdel Ali Belaidi of Australia's Florey Institute, who wasn't involved, finds the TGF-beta result promising but warns that the molecule does so many jobs in the body that a drug targeting it would be hard to make safe.
APOE4 also affects inflammation and interacts with tau, another Alzheimer's protein. How the vessel scarring fits with those effects is still an open question.
1 is the strongest common genetic risk factor for Alzheimer's disease. Joel Blanchard, a neuroscientist at the Icahn School of Medicine at Mount Sinai in New York City, puts it this way: in a room of 10 people with Alzheimer's, six would carry it. But having the variant doesn't mean getting the disease. Many carriers never develop dementia, and researchers still can't say exactly how the gene makes the brain more vulnerable. A study by Blanchard and colleagues, published September 24 in Cell, suggests one route. APOE4 appears to push the support cells around the brain's small blood vessels to become scar-producing cells, and that scarring may help 2 build up.
The background
APOE is the gene for a protein that carries fats in the bloodstream. It comes in three common forms, or 3, and APOE4 is the one tied most strongly to Alzheimer's. The puzzle is how a gene for a fat-carrying protein connects to a disease defined by plaques of amyloid-beta, a protein whose buildup is one of the first signs of Alzheimer's in the brain.
The lead for this study came from people who should have been at high risk but weren't. In 2024, a study of more than 3,500 people included some who carried two copies of APOE4 and had not developed Alzheimer's. Their DNA turned out to have a mutation that left their blood vessels with much less 4. Fibronectin is a sticky protein that acts like cellular superglue during wound healing. Those researchers proposed that too much of it could make it harder for the brain to clear amyloid-beta.
That made blood vessels a suspect. Blanchard says the field mostly assumes that Alzheimer's damages the vessels as it progresses. His team wanted to test the reverse: whether changes in the vessels come first and help the disease along.
Step one: a cell-level map of brain vessels
The team built an atlas of 5, meaning which genes each cell is actively reading and turning into proteins, for the brain's blood vessels, one cell at a time. They didn't collect new tissue. Instead they combined data from three existing brain-wide maps, which gave them 66,000 vascular cells from 220 people. They then compared people with two copies of APOE4 against people with lower-risk APOE variants.
Two differences stood out. APOE4 carriers had fewer 6, star-shaped cells that wrap around small blood vessels and keep them stable. They also had more 7, cells that normally appear after tissue injury, lay down scar tissue and produce large amounts of fibronectin.
One way to read this, as an analogy: the vessels lose their maintenance crew and gain a crew that patches everything with glue. That's useful after a wound. Kept up over time, it could change how the vessel walls work, including how they help clear waste like amyloid.
Step two: testing cause in grown tissue
A snapshot from donated brains has a limit. It shows fewer pericytes and more myofibroblasts, but it can't show that one cell type is turning into the other. To test that, the researchers grew 3-D models of human brain tissue from stem cells. In models carrying two copies of APOE4, pericytes began taking on the features of scar-producing myofibroblasts.
This ties back to the resilient carriers. If APOE4 turns pericytes into fibronectin-producing myofibroblasts, then a mutation that lowers fibronectin would blunt that effect. The team tested the fibronectin link directly. When they stopped cells in their models from making fibronectin, amyloid buildup fell.
Step three: a trigger
The team also looked for what flips the switch. In the APOE4 models, signaling through 8, an immune signaling molecule known for its role in wound healing and scarring, helped push pericytes toward the scar-producing state. Blocking TGF-beta signaling in the cell models and in aged mice restored the share of blood vessels wrapped by pericytes.
Put together, the proposed chain is: APOE4 → more TGF-beta signaling → pericytes turn into myofibroblasts → more fibronectin → more amyloid buildup. The article gives no effect sizes for the drop in amyloid or for the recovery of pericyte coverage, so it's not possible to say from it how large these effects are.
Caveats
Abdel Ali Belaidi, a neuroscientist at the Florey Institute of Neuroscience and Mental Health in Australia who was not part of the study, calls the TGF-beta results "particularly interesting" because blocking the molecule reversed some of APOE4's effects on pericytes. But he notes that TGF-beta does many jobs throughout the body, which makes it hard to target safely with a drug. Shutting it down broadly would likely cause side effects well outside the brain.
The evidence has limits too. The human data come from comparing brains at one point in time, and those comparisons show associations. The causal steps were shown in stem-cell tissue models and mice, not in people. The article also doesn't say whether the vessel changes appear before amyloid builds up in living human brains, which is the core of the "vessels first" idea.
The vessels are also just one of several ways APOE4 has been linked to Alzheimer's. Other work shows the variant changes inflammation and interacts with tau, another protein tied to the disease. How these effects combine to make APOE4 such a strong risk factor is still unknown. "As a field, we're all progressing toward an answer," Blanchard says.
Remember
The proposed chain runs from APOE4 to TGF-beta signaling, then pericytes turning into scar cells, more fibronectin and more amyloid.
The human evidence comes from comparing brains. The causal steps were shown only in stem-cell-grown tissue and mice.
TGF-beta has too many roles in the body to be blocked safely as it is, so a drug is not close.
Edgar Adrian in his Cambridge laboratory around 1920, a few years before the spike-train recordings.1 / 4
This year marks 100 years since Edgar Adrian and Yngve Zotterman published two 1926 papers showing that a neuron signals by firing trains of identical electrical pulses, called 1. In an essay for The Transmitter, the neuroscientist Matteo Carandini calls this the discovery of the neural code. He argues that neuroscience should celebrate it the way biology celebrates the genetic code. This is a history piece, not new research.
What was missing
Adrian already knew nerves respond "2": a stimulus above a threshold produces a full response, and a stronger one produces nothing extra. But spikes had been seen only by shocking whole nerves so that thousands of fibres fired at once. Nobody knew whether single fibres fire spikes during normal activity, or that spikes might carry information.
The obstacle was size. Measured outside a fibre, a spike is about a thousand times smaller than the tens of millivolts measured inside. Vacuum-valve amplifiers, borrowed from radio, made it detectable. At first Adrian's recordings looked like noise. Then he noticed the signals appeared only when the muscle was stretched. He was hearing sensory fibres from 3, the muscle's stretch sensors.
One fibre, one message
Zotterman, a 27-year-old trainee skilled at dissection, cut away muscle until only one spindle was left. The signal changed: every pulse had the same shape, the pulses were regular, and they came faster as the muscle stretched. A neuron encodes a quantity by changing how often it fires, not how big each spike is. Adrian compared it to Morse code, or to "a stream of bullets from a machine gun." He won a Nobel Prize six years later.
Reading the old traces
The original figures are hard to read today. Time runs right to left, and the recording device was a 4: a mercury-filled glass tube whose slow movements smeared each spike out in time. Carandini flipped the axis and applied 5, a mathematical step that undoes known blurring. In his version, single-fibre spikes stand out clearly.
The first firing-rate graph
The 1926 work also showed 6: under steady stretch, firing slows over time. Adrian's plot of firing rate against time was the first graph of a neuron's firing rate against anything. Neuroscientists now call this kind of plot a 7 (peri-stimulus time histogram). The same kind of plot later revealed orientation-tuned cells in visual cortex, place cells, dopamine reward signals and grid cells.
Carandini expects scientists in 2126 to marvel at how little we know now. He hopes they will have found another organising principle as widespread as the spike code.
This year marks 100 years since two 1926 papers by Edgar Douglas Adrian and Yngve Zotterman showed that neurons communicate through trains of identical 1. Carandini argues that this was the discovery of the neural code. Writing in The Transmitter, the neuroscientist Matteo Carandini argues that the field should celebrate the anniversary the way biologists celebrate the genetic code. To show what the two men actually saw, he has also re-processed their original recordings so that modern eyes can read them.
This is a history essay, not new research. Its value lies in explaining how a basic fact of neuroscience came to be known, and why it was so hard to see.
What was known, and what wasn't
Adrian and his mentor Keith Lucas had already shown that nerves respond in an "2" way. A current applied to a motor nerve made the attached muscle contract only if the current passed a threshold. Above that threshold, a stronger current produced no stronger effect. The property seemed to belong to the nerve itself and to apply to all nerves.
Today we call that all-or-none event the action potential, or spike. In the early 1920s, though, spikes had been seen only by applying strong currents to whole nerves. That made many axons fire at once, so their combined signal was big enough for instruments to pick up. Nobody knew whether single axons fire spikes during normal activity. Nor did anyone know that spikes have a fixed shape, that they come in sequences, or that those sequences carry information.
The amplification problem
The obstacle was size. Measured inside a cell, a spike is tens of millivolts. Measured from outside the fibre, it is about a thousand times smaller, roughly tens of microvolts. The fix came from radio: the 3 (vacuum tube). Groups at Harvard and Washington University had begun using valve amplifiers on nerve signals.
When Adrian first tried one, he was discouraged. The fluctuations in his motor-nerve recording looked random, like noise or equipment artifacts. Then he noticed they appeared only when the muscle was stretched. In his words, "The explanation suddenly dawned on me": he was recording sensory impulses travelling up the nerve from the 4, the muscle's stretch sensors. These were the first recorded spike trains. But they mixed many fibres together, and Adrian suspected that with more work he could isolate one.
Isolating one fibre
Zotterman made that possible. He was 27 and had arrived in Cambridge two months earlier, drawn by the all-or-none work, and he was skilled at dissection. While they recorded from the nerve, he cut away more and more of the muscle until only one spindle was left. The signal changed at once. Every fluctuation now had the same shape, they came at regular intervals, and they came faster when the muscle was stretched.
That was the result. A single neuron reports a quantity, here muscle stretch, through spikes. When the quantity changes, the neuron changes the frequency of its spikes, not their size. Adrian compared it to "a succession of dots in the Morse Code," and to "a stream of bullets from a machine gun," not "a continuous stream of water from a hose." The papers were recognised as transformative straight away, and Adrian won a Nobel Prize six years later.
Why the original figures look baffling
Carandini points out that the published traces are almost unreadable today. One reason is that time runs right to left. The bigger reason is the recording device, a 5. This is a fine glass pipette filled with mercury. Voltage moves the mercury slightly, and the movement was magnified under a microscope, projected and filmed. Adrian chose it because it was robust and survived the amplifier's occasional wild artifacts. But the mercury is slow to settle after each movement, so the signal is smeared out in time.
Recovering the true signal requires 6, a mathematical step that undoes a known blurring. Carandini compares it to how modern researchers infer spikes from slow calcium-indicator signals. In 1926, deconvolution could be done with a mechanical device, but more often it was left to the imagination of the experimenters and their readers.
Carandini flipped the time axis and deconvolved the traces himself. The spikes become recognisable, though still somewhat blurred: they appear to last tens of milliseconds, when real spikes last a few. The contrast between the many-fibre recording and the single-fibre recording becomes stark. "With this more modern visualization, we can now imagine their excitement!" he writes.
The first firing-rate plot
The same 1926 work reported the first property of what neurons encode. Under steady stretch, firing slowed over time, which Adrian called "7." To show it, he plotted the nerve's firing rate against time, before, during and after the stretch.
Carandini calls this a watershed. It is the first graph of a neuron's firing rate against anything. Today such plots are routine. This kind is called a 8, or peri-stimulus time histogram: firing rate plotted against time relative to a stimulus. Plots like it document a century of landmark findings:
center-surround receptive fields in the retina, where a cell responds to light in a central spot and is suppressed by light around it;
orientation selectivity in visual cortex, where cells prefer edges at a particular angle;
place fields in the hippocampus, where cells fire at particular locations;
dopamine signals that track expected reward;
grid cells in the entorhinal cortex, which fire in a repeating lattice across space.
Before 1926, such a plot was impossible, because the quantity on its y-axis was not known to exist.
What the essay leaves open
Carandini notes that the genetic code was worked out about 300 metres away in Cambridge, yet neuroscientists take their own code for granted "as if it was always known." He jokingly asks readers which of the discoveries listed above has yet to win a Nobel, and does not give the answer.
His closing point is a forecast, not a finding. Scientists in 2126 will be struck by how little was understood in 2026, just as we are struck by 1926. He hopes they will have found "another form of neural code": an organising principle so widespread across the brain that it will be hard to imagine a time before it was known. The essay does not say what that principle might be.
Remember
Neurons encode intensity through how often they fire spikes; each spike has the same size and shape.
The key step was dissection, not just amplification: cutting the muscle down to one spindle isolated a single fibre.
Firing rate, the y-axis of countless later discoveries, was not known to exist before 1926.
Eight Chair44 tiles fitting together, shown apart and assembled, into a larger chair (Superchair44).
Researchers have announced a three-dimensional "1": a single solid shape that can fill all of space with no gaps or overlaps, but only in a pattern that never repeats. The shape is called Chair44. It was announced in a 2, a paper not yet peer reviewed, by Ioannis Tsiokos. He runs Automorph, which he calls an AI research lab, and he is not a mathematician.
Why it's a big deal
In 2023 the "hat" became the first single flat tile that can cover a plane only aperiodically, meaning without any repeating pattern. Its finders nicknamed such shapes einsteins, from the German ein Stein, "one stone." A 3D example already existed, the 3. But it is only weakly aperiodic. Its tilings never repeat by a simple shift, yet they still keep a twisting, corkscrew-like symmetry. Craig Kaplan, one of the hat's co-discoverers, says the biprism "obeys the letter of the law of aperiodicity but not the spirit." Chair44 is claimed to be strongly aperiodic, with no infinite symmetry of any kind. Kaplan calls this the answer to "a nagging open problem in tiling theory."
How it works
Picture a 2×2×2 block of eight small cubes and remove one. That leaves a seven-cube "chair." Eight chairs can be put together into a chair twice as large, and eight of those make a larger one again, forever. If the pieces are made to lock together only in certain ways, every tiling is forced into this nested structure, and the nesting rules out repetition. The article gives no exact geometry for those "key locks," and a plain seven-cube chair can also tile in other ways. So the precise form of Chair44 isn't spelled out here.
The AI question
Tsiokos says he used OpenAI's ChatGPT-6 Astra to search for the shape and check it, and Anthropic's Claude Fable 5.1 to write the paper. Chaim Goodman-Strauss, another hat co-author, has studied this "L" shape for more than 30 years. He criticized the paper's "irrelevant puff," which he called a hallmark of LLM-written research. He is one of at least two researchers who have since written their own proofs that Chair44 is an 4. Felix Flicker, a physicist at the University of Bristol, wrote another, describing it as the first human-readable proof a referee could check. Even he used Claude for coding.
Flicker calls it "a new important result" but worries mathematicians may end up "sifting through AI slop." Goodman-Strauss expects more papers like this one and says the field must decide how such results should be communicated.
A single three-dimensional shape that fills all of space without gaps or overlaps, but only in patterns that never repeat, has been announced. That makes it a 3D "1." The shape is called Chair44. It was reported in a 2, a paper not yet peer reviewed, by Ioannis Tsiokos. He directs Automorph, which he calls an AI research lab, and he describes himself as "not a mathematician." He is the only human author. The result has also brought out a sharp argument about how AI-produced mathematics should be presented and checked.
The problem: one shape, no repeats
A tiling covers a plane or a space with copies of shapes. Most familiar tilings are periodic. Slide a tiled floor one tile over and the pattern matches itself. An aperiodic tiling has no such slide anywhere. For decades, forcing aperiodicity took a set of shapes, Roger Penrose's pair being the best known. Whether one shape could do it alone was a long-standing question.
The answer for flat surfaces came in 2023. David Smith, an amateur, found a hat-shaped tile. With Joseph Samuel Myers, Craig Kaplan and Chaim Goodman-Strauss, he proved in a paper later published in Combinatorial Theory that the hat is an 3: a single tile that can cover the plane but never periodically. Such shapes are nicknamed "einsteins," from the German ein Stein, "one stone." Hats group into larger hat-like clusters, and those group into larger ones again. However far the tiling extends, the arrangement keeps changing. The find was popular enough that researchers held a two-day "Hatfest" at the University of Oxford.
Why 3D wasn't already solved
In three dimensions there was already a candidate, the 4, a convex polyhedron known for decades. Kaplan says it "obeys the letter of the law of aperiodicity but not the spirit." In standard terms it is weakly aperiodic. No tiling with it repeats by a pure shift, but the tilings still have a 5, a rotation combined with a slide along an axis, that carries the pattern onto itself forever. A strongly aperiodic tile allows no infinite symmetry of that kind at all. Finding a strong 3D example had been open for decades. Chair44 is claimed to close it. Kaplan says he is "pleased that we have the solution to what was, until recently, a nagging open problem."
How the chair works
Tsiokos describes the idea with cubes. Take a 2×2×2 block of eight small cubes and remove one. The seven-cube solid left over is a "chair." Chairs can be put together into a bigger chair of the same shape, that bigger chair into a bigger one, and so on without end.
The article's description of this step is inconsistent. One passage says four chairs make a bigger one. The figure caption and Goodman-Strauss both say eight. Volume settles it. A chair twice as large in every direction has 2³ = 8 times the volume, 56 small cubes instead of 7, so it takes eight copies. Each level is called a 6.
Repeating this building step does not by itself guarantee a non-repeating result. Goodman-Strauss, who has studied this shape for more than 30 years under the name "the L," notes that it "can also do all kinds of other crazy stuff." It can be packed in many other ways, including periodic ones. Aperiodicity needs every possible tiling to be forced into the nested-supertile structure. Tsiokos describes this as needing "some sort of key locks between the chairs so that they form bigger and bigger chairs." When the hierarchy is forced, every tile sits inside a supertile, which sits inside a bigger one, without end. Goodman-Strauss says each tile then sits in a supertile arranged in its own configuration, which rules out the global repetition a periodic pattern needs.
The article does not say what the locks look like on the actual tile, or what the "44" in the name refers to. Readers can't rebuild the exact shape from this account.
How it was found, and the reaction
Tsiokos says he used OpenAI's ChatGPT-6 Astra to search for a 3D monotile and to check that Chair44 met the einstein criteria. He used Anthropic's Claude Fable 5.1 to write the paper. "There was a lot of human work that went into what went into Astra," he says.
Mathematicians gave it a mixed reception, mostly because of the AI's role. Goodman-Strauss wrote a reply preprint saying Tsiokos's paper shows "hallmarks of an LLM-driven research paper," including "so much irrelevant puff to push through." He is one of at least two researchers who have since written their own proofs that Chair44 is an aperiodic monotile.
Felix Flicker, a theoretical physicist at the University of Bristol and a Hatfest organizer, wrote another. He describes it as "the first human-written, human-readable, and therefore referee-able and defensible proof" that Chair44 is strongly aperiodic. His paper says he also used Claude for coding and discussion. The independent proofs support the claim, but as far as the article reports, none has yet been through peer review.
What the result does and doesn't show
The mathematical claim now has backing from specialists who did not rely on the original paper's reasoning. That is a stronger position than a single AI-written preprint. The harder questions are about how the work gets done. Flicker calls it "a new important result" but warns that "our jobs get reduced to sifting through AI slop in search of nuggets of gold." He places it in a summer in which, he says, AI models have repeatedly cracked long-standing open problems, including one of the seven 7. The article gives no detail on those claims.
Goodman-Strauss takes a more measured view. He expects Chair44 to be "the first example of something that we're going to be encountering a lot of." He suggests mathematicians revisit hard questions they set aside, since 8 (large language models, the technology behind chatbots) may now help as tools, though not as a substitute for human reasoning. The unsettled part, he says, is "what's expected in terms of communication": who must write a proof that people can read and check before a result counts as known.
Remember
Strong aperiodicity rules out every infinite symmetry, not just simple shifts; the older 3D biprism failed that test.
Chair44 builds on a seven-cube 'chair' that nests into ever-larger copies of itself, eight per level.
The AI-written original is backed up by independent human-written proofs, but none had been peer reviewed when the article ran.
Summed radiocarbon dates from Kelly's 2025 study, peaking around A.D. 1150: the key evidence for the early peak.1 / 2
Estimates of how many people lived in the Americas when Columbus landed in 1492 run from 1 million to 112 million. For one region, that range is now narrowing. Experts told Live Science that what is now the U.S. and Canada held 2 million to 4 million people before contact. Two studies also agree that North America's population peaked around A.D. 1150, centuries before Europeans arrived.
Why it's hard
Nobody counted. Within decades, the "1" had shattered Indigenous societies. That is the name for the combined toll of epidemic disease, warfare and enslavement. In 1983, anthropologist Henry Dobyns estimated 112 million people for the whole hemisphere. He assumed every landscape was filled to its 2, the most people it could support, and that epidemics reached everyone. Fieldwork later showed settlement was patchy, so his figure was far too high.
Regional counts followed, built from pottery fragments, stone tools, houses and skeletons. A 2019 study pooled 82 published studies and reached 60.5 million for the hemisphere. It put North America at 3 million to 6 million, less than a third of Dobyns' figure.
Counting campfires
Archaeologist Robert Kelly of the University of Wyoming argues for a measure that works everywhere: everyone built fires. Charcoal, bone and plant remains can be radiocarbon-dated. North American dates are gathered in the 3. Researchers add up thousands of these date ranges into one curve. More people leave more datable debris, so the curve's rises and falls track population.
In 2009, geographer Matthew Peros and colleagues used about 25,000 dates. They found growth starting around 50 B.C. and a peak around 1150, followed by decline. The decline was possibly caused by diseases such as tuberculosis spreading in denser settlements. Kelly's 2025 study in the journal 4 used more than 100,000 dates. It found the same peak, plus a slight recovery just before 1500.
Turning a curve into a number
The curve shows change over time, not headcounts. Peros's team anchored it by assuming about 1,000 people arrived 15,000 years ago and grew at a steady average rate. That gave about 2.5 million people in 1150 and 1.8 million in 1492. If people arrived earlier, as footprints at 5, New Mexico, dated to about 23,000 years ago suggest is possible, or in larger numbers, the totals would rise.
Kelly argues that timing mattered. Around A.D. 1000, 6, near St. Louis, held nearly 20,000 people. "It could have been a very different history," he said.
The method so far covers only North America. Anthropologist George Milner expects a full estimate for the Americas eventually, but probably not in his lifetime.
The news
How many people lived in the Americas when Columbus landed on Oct. 12, 1492? Published estimates run from 1 million to 112 million. "We don't have good quantitative estimates," Penn State anthropologist George Milner told Live Science. "The numbers are all over the place."
For one region, the spread is now narrowing. For what is now the U.S. and Canada, experts told Live Science that the population before 1492 was between 2 million and 4 million. The bigger surprise is the timing. Two studies, one from 2009 and one from 2025, agree that North America's population peaked around A.D. 1150. That is roughly 350 years before Europeans arrived, and numbers had been falling since.
Why the number is hard to pin down
Nobody counted. Within a few decades of contact, the "1" had wrecked the societies that could have been counted. That was anthropologist Eric Wolf's name for the combined toll of epidemic disease, warfare and enslavement. Any estimate therefore has to work backward from indirect evidence, and its answer depends on the assumptions behind it.
The highest well-known figure came from anthropologist Henry Dobyns in 1983: about 112 million people, including 18 million in North America. He started from 2, meaning how many people each type of landscape could support. Then he used records of 16th-century epidemics to work backward. "In essence, Dobyns filled up the landscape to its maximum carrying capacity, so that all environmentally similar places were occupied by the same number of people," Milner said. Dobyns also assumed epidemics reached everyone, which only makes sense if the land really was full. Fieldwork in the 1970s and 1980s showed the Americas were settled unevenly, so both assumptions overshot.
Regional counts
Researchers then built estimates region by region. They used the density of pottery fragments, counts of stone tools and flakes, the number and size of houses, and death patterns in skeletons. A 2019 study pooled 129 estimates from 82 published studies across seven regions: the Caribbean, Mexico, Central America, Inca territory, Amazonia, North America, and the rest of the Americas. It reached 60.5 million for the whole hemisphere. The largest populations were the Aztecs in Mexico and the Inca along South America's west coast. North America got only 3 million to 6 million, less than a third of Dobyns' figure.
Milner and geographer George Chaplin took a closer look at eastern North America in 2010. They combined historically recorded group sizes with the sizes of archaeological settlements and estimated about 1.6 million people for the eastern U.S. and southeastern Canada. For all of North America in the early 1500s, their best estimate was 3.8 million, within a range of 2.8 million to 5.7 million.
Counting with charcoal
Pottery and house counts differ from place to place. Robert Kelly, an archaeologist at the University of Wyoming, argues for a measure that works everywhere: "Everyone had to build fires for heat and for cooking." Charcoal from hearths, along with animal bone and plant remains, can be radiocarbon-dated. North American dates are collected in the 3.
The method treats dates as a stand-in for people. Each dated sample gives a range of probable ages. Researchers add all those ranges together into one curve showing how common dated material is at each point in time. The logic is that more people burn more fires and leave more datable debris. So the curve's ups and downs should track population, even though its height is not a headcount.
Matthew Peros, a geographer at Bishop's University in Quebec, did this with co-authors in 2009, when CARD held about 25,000 dates. The curve rose sharply around 50 B.C. and peaked around A.D. 1150. "I had assumed it would be more like 1500 just following the arrival of the Europeans," Peros said. One possible reason for the decline after 1150 is that people gathered into denser settlements, where diseases such as tuberculosis killed more of them. Kelly and colleagues repeated the analysis in a 2025 study in the journal 4, by which time CARD held more than 100,000 dates. They found the same peak, plus a slight recovery just before 1500. "The Indigenous population did not simply increase to a peak at 1500 CE and then decline," they wrote.
From a curve to a number
To get actual numbers, the curve needs an anchor. Peros's team assumed a starting group of about 1,000 people, a few extended families, entering North America about 15,000 years ago. They combined that with an average yearly growth rate and the curve's shape. The result was a maximum of about 2.5 million in 1150, falling to about 1.8 million by 1492.
A rough calculation (illustrative, not the study's actual method) shows how much depends on these inputs. Growing from 1,000 people to 2.5 million is about 11 doublings. Spread over roughly 13,850 years, that works out to an average growth rate of about 0.056% a year. Change the start date or the size of the founding group, and the endpoint changes too. The authors note that an earlier arrival would push the totals higher, and so would a larger founding group. Footprints at 5, New Mexico, dated to about 23,000 years ago, suggest an earlier arrival is possible.
What it would have meant
Kelly argues that the timing could have changed history. Around A.D. 1000, 6, near modern St. Louis, covered 6 square miles (16 square kilometers) and held nearly 20,000 people. "They could have fielded thousands of warriors," he said. "It could have been a very different history."
Caveats and open questions
The radiocarbon approach shows changes over time better than it gives totals. The totals depend on the founder and growth assumptions above. The article doesn't discuss the method's known biases, so these come from general knowledge. Older material survives less well, which can make recent periods look busier. Archaeologists also date some sites and periods more than others. Uneven stretches in the 7 used to convert carbon-14 into calendar years can also create bumps in the summed curve. The larger 2025 dataset makes the A.D. 1150 peak more robust, but does not remove these problems.
The method so far covers only North America. Milner expects a full hemisphere estimate eventually, but probably not in his lifetime: "It's time-consuming, laborious and not especially flashy work." He argues that long population records help environmental planning in a world whose population has more than doubled in his lifetime. Peros puts it more simply: "North America was not an empty continent when the Europeans arrived."
Remember
Radiocarbon dates work as a population stand-in: more people burned more fires and left more datable debris.
The curve shows when population rose and fell; turning it into headcounts depends on assumed founder numbers and growth rates.
Hemisphere-wide estimates still differ widely; only North America has been studied this closely.