Mars Still Stirs, an Ice Age Stalls · Morning Gist
Sunday, October 255 stories · 16 min
Mars Still Stirs, an Ice Age Stalls
A restless Mars, an ice age that may have quietly begun before emissions broke the cycle, and Swift's farewell after 22 years of chasing cosmic flashes.
Picked from 20 new articles across 10 sources · arrow keys for other days
Today in 30 seconds
30s left
A modeling study says Mars's 1,000-mile cloud over Arsia Mons may form from vapor freezing without dust, a process never observed before. story 1 ↓
A 2021 marsquake traced to sideways fault slip 20–40 km below Valles Marineris suggests Mars's crust is still releasing stress. story 2 ↓
The last fragment of North America's ice sheet, on Baffin Island, grew until 1960, suggesting the next ice age began 2,000 years ago. story 3 ↓
NASA's Swift has ended science after nearly 22 years. Its orbit fell below 275 km, and nothing in orbit fully replaces it. story 4 ↓
Of 151 white dwarfs within 65 light-years, three would look pink and two yellow, so a star's color doesn't always reveal its temperature. story 5 ↓
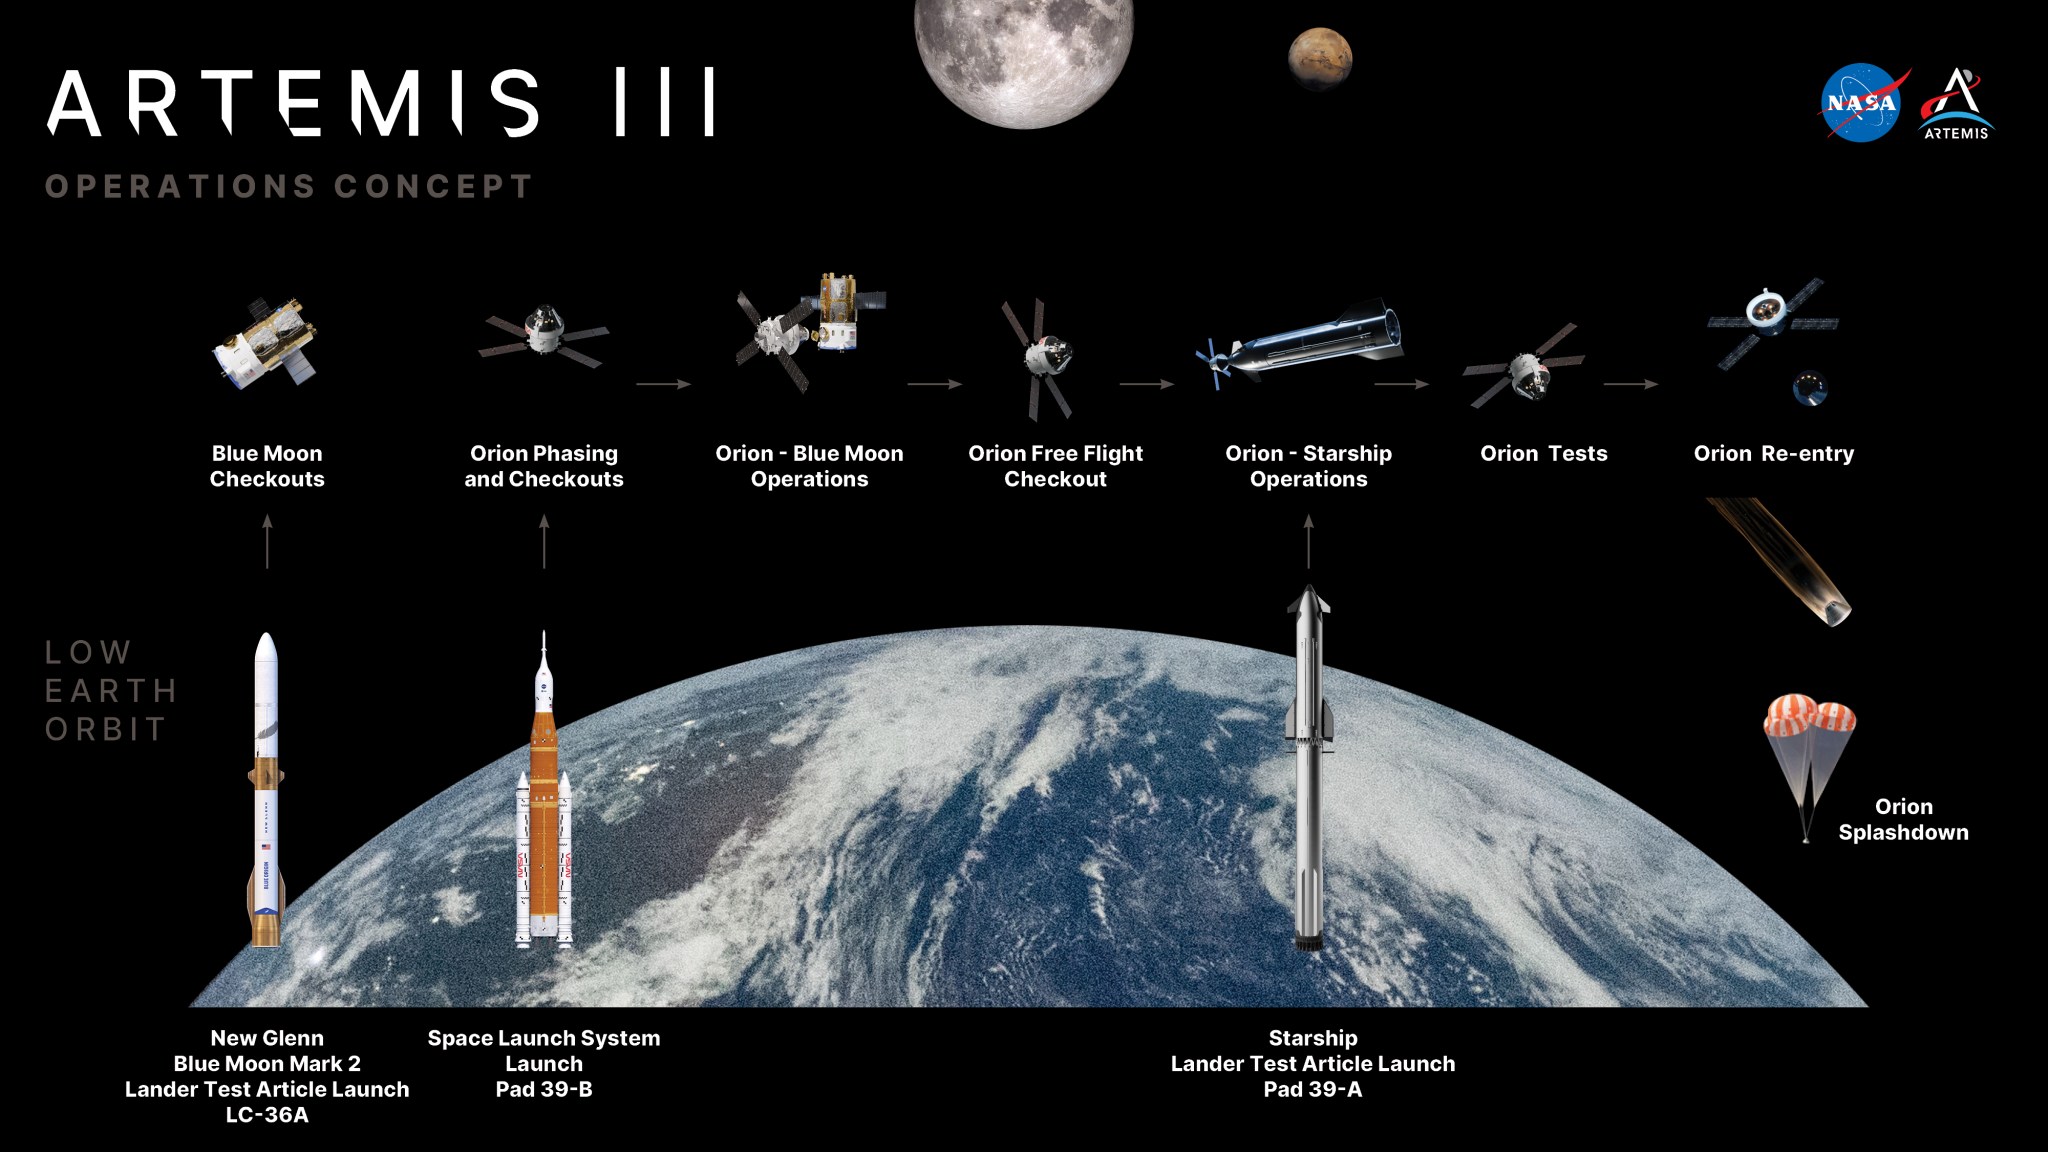
Artemis III, planned for 2027, will no longer land on the Moon. Instead, its crew will test lander operations in low Earth orbit.
1/5Ars Technica Science·
Tereza Ondráčková, wired.com
· Oct 24
Giant Mars cloud may form from vapor freezing without dust
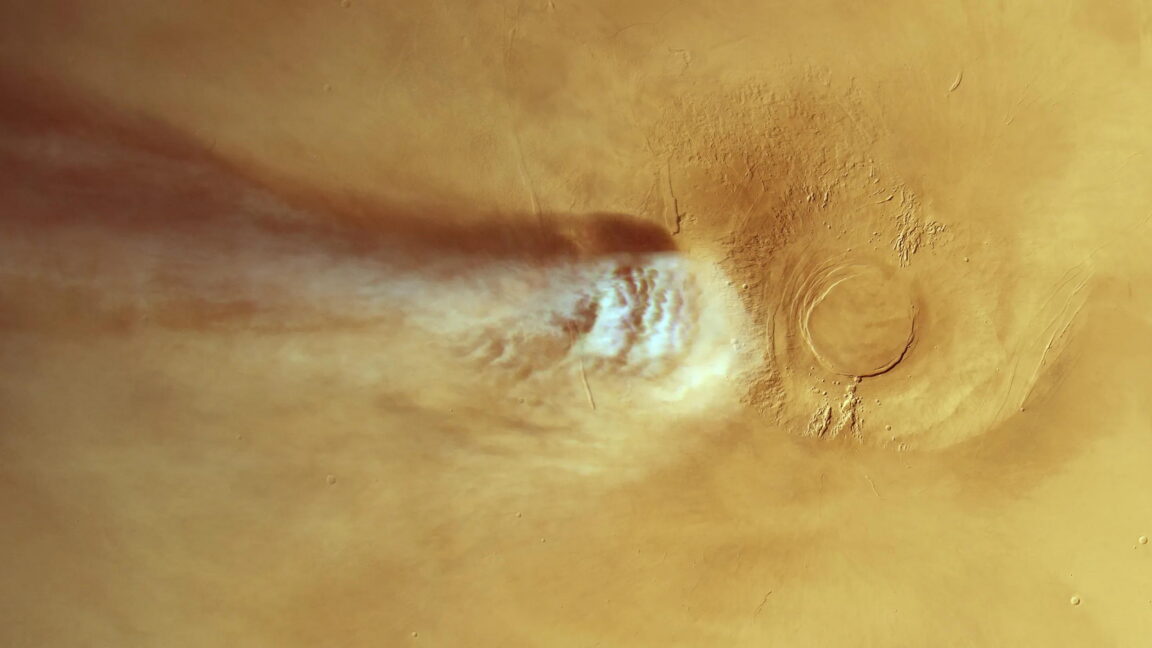
A modeling study suggests a huge, recurring cloud over the Martian volcano Arsia Mons forms when water vapor freezes straight into ice with no dust to help. This process has been predicted but never observed in nature.
Why it matters · If confirmed, Mars would be the first place we've seen a textbook cloud-forming process that theory predicts for Venus and Earth's upper atmosphere but nobody has ever caught happening.
Know this first
Context from the editor, not the article · 31 sec
1 · How clouds usually form
On Earth, water vapor almost always condenses or freezes onto tiny particles such as dust, salt or soot. These seeds give molecules a surface to gather on, so clouds can form at modest humidity.
2 · The Arsia Mons cloud
Mars's Arsia Mons Elongated Cloud (AMEC) is a thin plume of water ice that forms most mornings during one season. It stretches up to about 1,800 km from the volcano and disappears within a few hours. ESA's Mars Express orbiter has photographed it repeatedly.
3 · Arsia Mons itself
Arsia Mons is one of the giant shield volcanoes in Mars's Tharsis region. It rises roughly 20 km (about 65,000 feet), more than twice the height of Everest, high enough to push winds far up into the thin atmosphere.
2/5Universe Today· Matthew Williams· Oct 23
A 2021 marsquake shows faults under Valles Marineris can still slip
Re-analysing a 2021 marsquake recorded by NASA's InSight lander, researchers found it came from faults sliding sideways deep beneath Valles Marineris. That means faults billions of years old can still rupture today.
Why it matters · It adds to evidence that Mars, long treated as geologically dead, still has stress building and releasing in its crust, and that one seismometer can show this.
Know this first
Context from the editor, not the article · 28 sec
1 · A one-plate planet
Earth's crust is broken into moving plates. Mars has a single rigid shell, called a "stagnant lid". Without plates grinding past each other, scientists long assumed the planet's crust had gone quiet.
2 · InSight's lone seismometer
NASA's InSight lander sat in Elysium Planitia from late 2018 until dust choked its solar panels in 2022. It carried one seismometer. The time gap between wave arrivals gave a quake's distance, and the motion of the ground hinted at its direction.
3 · Kinds of fault motion
Rock can break in different ways. Crust pulled apart drops down along normal faults. In a strike-slip fault, two blocks slide past each other horizontally. Each type sends out its own pattern of seismic waves.
3/5Ars Technica Science·
Jacek Krywko
· Oct 24
Last fragment of North America's great ice sheet was growing until 1960
Dating rocks and dead moss on Baffin Island's Barnes Ice Cap, a Science study finds North America's old ice sheet started regrowing about 2,000 years ago. Human-caused warming stopped that growth around 1960.
Why it matters · It would be field evidence of a glaciation actually starting, and it suggests human emissions have broken one of Earth's most regular climate cycles.
Know this first
Context from the editor, not the article · 29 sec
1 · The Laurentide Ice Sheet
During the last ice age, the Laurentide Ice Sheet buried most of Canada under ice up to two miles thick. It melted away over the Holocene, the warm period of roughly the last 11,700 years, and only small remnants survive today.
2 · What paces ice ages
For 2.5 million years, ice ages have come and gone on a regular rhythm. Slow changes in Earth's orbit control how much summer sunlight reaches high northern latitudes, and carbon dioxide levels either strengthen or weaken that effect.
3 · Glacier mass balance
A glacier grows when its upper accumulation zone, the part above the snow line, gains more snow than the ice lost to melting below. When that balance turns negative, the glacier shrinks.
4/5NASA· Oct 23
NASA's Swift gamma-ray burst observatory ends science after nearly 22 years
NASA's Swift satellite made its last observation on October 20. It was built for a two-year mission and worked for nearly 22. It recorded over 2,000 gamma-ray bursts and helped show that short bursts come from colliding neutron stars.
Why it matters · Swift was astronomy's main fast responder to sudden cosmic events. Nothing in orbit fully replaces it, so short-lived flashes will be harder to catch for now.
Know this first
Context from the editor, not the article · 31 sec
1 · What gamma-ray bursts are
Gamma-ray bursts are brief flashes of high-energy light from distant galaxies, and they are the most powerful explosions known. Each one fades within seconds to minutes. It leaves a dimmer 'afterglow' in X-rays and visible light that lasts hours to days.
2 · Long versus short bursts
Bursts come in two broad families. Long ones last more than about two seconds and are linked to the collapse of massive stars. Short ones last under two seconds, and before 2005 nobody had pinned down where they came from.
3 · Why orbits decay
Low-orbit satellites skim the thin upper atmosphere, and drag slowly lowers them. When the Sun is active, it heats and puffs up that air, which speeds the decay. Without a propulsion system to boost the orbit, re-entry eventually follows.
5/5Universe Today· Laurence Tognetti, MSc· Oct 24
About one in thirty nearby white dwarfs isn't actually white
University of Warwick astronomers modeled how 151 nearby white dwarfs would look to the human eye. Five, about 3.3 percent, came out pink or yellow because elements in their dense atmospheres absorb part of their light.
Why it matters · The study shows a basic textbook rule, that a star's color tells you its temperature, can fail. It also shows how a star's atmosphere leaves visible marks on its light.
Know this first
Context from the editor, not the article · 33 sec
1 · What a white dwarf is
A white dwarf is the leftover core of a Sun-like star after it has used up its fuel. It packs roughly the Sun's mass into an Earth-sized ball. It no longer fuses anything, so it just glows from stored heat and slowly cools over billions of years.
2 · Blackbodies and star colors
An ideal 'blackbody' absorbs all light that hits it and gives off light whose spectrum depends only on its temperature. As it heats up, it goes from red to orange to white to pale blue. Astronomers usually treat stars as close to blackbodies.
3 · How absorption changes color
Atoms in a star's atmosphere absorb particular wavelengths, which removes slices from the spectrum. Take a big enough bite out of white light and what's left looks tinted, the way a filter tints a lamp.
The long, thin cloud on Mars that the study links to dust-free ice formation.
A study in 1 proposes that a giant cloud on Mars forms through a process never seen in nature. The cloud is the 2, a plume of water ice that can stretch about 1,000 miles from the volcano Arsia Mons. The study says it may form by 3: water vapor turning straight into ice crystals with no dust or other particles to start the process.
Why that's unusual
On Earth, clouds almost always need a seed. Water vapor condenses or freezes onto tiny particles such as dust or sea salt, which give the molecules something to gather on. Without a seed, small clusters of water molecules usually fall apart before they can grow.
Lead scientist Jorge Hernández-Bernal describes the seedless version as "akin to droplets of condensation appearing in the middle of a room, rather than on a window." The window plays the part of the dust particle. "It's wholly unexpected," he said.
How the volcano makes it possible
Seedless freezing needs extreme conditions. According to the study, the air has to cool by about 30 °C within roughly 10 minutes, and humidity has to be enormous: more than 100,000 times higher than any value ever measured on Earth.
Arsia Mons provides the cooling. It stands about 65,000 feet (roughly 20 km) tall. When wind hits it, the air is pushed up and over, setting off a powerful 4. That wave carries moist air high into the atmosphere within minutes. Rising air expands and cools, so the vapor chills so quickly that it freezes before it can find dust to freeze onto.
A first, if it holds up
Scientists have long assumed this process could happen high in the atmospheres of Venus and Earth, but no one has ever observed it. The humidity it requires is far beyond anything measured on Earth. Until this modeling, no one knew humidity that high existed on Mars either.
What kind of evidence this is
This is a modeling result, not a direct observation. The team reproduced the cloud's behavior in simulation, and the simulation only works if the vapor freezes without seeds. Nobody has measured humidity inside the cloud or confirmed that it contains no particles. Hernández-Bernal points out that Mars's atmosphere is far less well measured than Earth's, so matching the cloud this closely is "a big success." The article doesn't say whether the team ruled out other explanations, such as fine high-altitude dust seeding the ice. Direct measurements would be needed to settle the question.
A new study in 1 offers an explanation for one of Mars's strangest weather features, and the explanation involves a process that has never been seen in nature. According to the study, the 2, a plume of water ice that can stretch about 1,000 miles from a giant Martian volcano, may form through 3. In that process, water vapor turns directly into ice crystals without a speck of dust to help it along.
The Ars Technica piece, translated from WIRED Czech Republic and Slovakia, is short and starts partway into the story. It quotes the study's lead scientist, Jorge Hernández-Bernal, but gives little detail about the team's methods. What follows sticks to what it reports.
The usual way clouds form
On Earth, clouds almost never form from vapor alone. Water molecules need a surface to collect on. Dust, sea salt, soot and pollen supply it, and scientists call them condensation or ice nuclei. Without such a seed, a small cluster of water molecules tends to fall apart before it can grow. Clouds that form around particles are the product of 4 nucleation. Nearly every cloud you have ever seen formed this way.
Homogeneous nucleation skips the seed. Vapor packs so densely and cools so fast that the water molecules lock together into ice by themselves. Hernández-Bernal offers a comparison: it is "akin to droplets of condensation appearing in the middle of a room, rather than on a window." The window is the particle. The middle of the room is open air. "It's wholly unexpected," he said.
Why it needs extreme conditions
Theory says homogeneous nucleation should be possible, but the bar is very high. Air has to be enormously 5, meaning it holds far more vapor than it normally could at that temperature, so that random clusters of molecules can survive and grow. According to the article, the AMEC case requires:
A sudden chill: a temperature drop of about 30 °C within roughly 10 minutes.
Very high relative humidity: more than 100,000 times greater than any value ever measured on Earth. The article doesn't say exactly which humidity measure it means. It is most likely the degree of supersaturation.
Before this modeling, nobody knew humidity that high existed on Mars either.
How the volcano does it
Arsia Mons supplies the sudden chill. The volcano rises about 65,000 feet (roughly 20 km). When wind runs into it, the air is forced up and over, and this sets off a strong 6. The article says the wave lifts moist air high into the atmosphere "in a matter of minutes." Rising air expands and cools, so a quick lift means a quick, steep temperature drop. In the scenario the model describes, that drop is fast enough that vapor freezes on its own before it can find dust to condense on.
Why nobody has seen this before
Scientists have long assumed homogeneous nucleation could happen high in the atmospheres of other planets, including Venus and Earth. It has never actually been observed. Given how extreme the humidity has to be, the article notes, that is not surprising. Earth's air simply never seems to get there.
How strong is the evidence?
This is a modeling result, not a direct detection. As the article describes it, the team reproduced the cloud's behavior in a simulation, and the simulation only works if the vapor freezes without seeds. Nobody has measured the humidity inside the AMEC, and no instrument has watched ice form there without particles. Hernández-Bernal frames the achievement modestly: "We don't have nearly as much information about Mars' atmosphere as we do about Earth's, so reproducing the AMEC to this degree is a big success." He calls the result "remarkable."
There are reasonable grounds to take it seriously. The study passed peer review at a major journal. The AMEC is also a well-documented, recurring cloud, so any model has to match a lot of real observations. Still, matching observations is not the same as proving the mechanism. The article doesn't say whether the team considered other explanations, such as very fine dust in the upper Martian atmosphere seeding the ice, or how sensitive the result is to the model's assumptions.
Open questions
Can it be measured directly? Confirmation would need humidity and particle readings in the plume. Today's orbiters may not be able to provide them.
Does it happen elsewhere on Mars? Other tall Tharsis volcanoes produce similar mountain waves. The article doesn't say whether they also produce seedless clouds.
What does it mean for Venus and Earth? If the model holds, Mars becomes a natural laboratory for a process that cloud physicists have so far studied only in theory and in lab chambers.
Remember
Almost all clouds form on dust or salt seeds. The Mars result suggests ice can form from vapor alone.
Arsia Mons's wind-driven wave produces the needed chill: about 30 °C of cooling in roughly 10 minutes.
The evidence comes from a model that matches observations. No one has measured conditions inside the cloud.
Map of the Tharsis volcanoes and Olympus Mons, with Valles Marineris to the right, near where S0976a struck.1 / 2
A marsquake recorded in 2021 came from rock sliding along a fault deep under Valles Marineris, the largest canyon in the Solar System. A team led by Jung-Hun Song of Imperial College London reports this in the peer-reviewed journal Nature Communications. It shows that faults formed billions of years ago can still break under stress today.
Why it was an open question
Mars has no moving tectonic plates. Its crust is one rigid shell, a "1", so the planet was long treated as geologically dead. NASA's 2 lander changed that view. Its 3, an instrument that records ground shaking, ran from 2018 to 2022 and picked up hundreds of marsquakes. Some came from meteoroid impacts. Others pointed to activity inside the planet.
Valles Marineris is about 3,900 km long, up to 600 km wide and more than 9 km deep. The leading explanation is that it began as a rift, where the crust was pulled apart while volcanism built the nearby 4 bulge 4.1 to 3.0 billion years ago. Erosion and collapsing walls then widened it. Nobody had confirmed that its faults were still active.
Testing one quake
The event, S0976a, was recorded on 25 August 2021. It was the only marsquake InSight detected in the western hemisphere, on the far side of Mars from the lander. Earlier studies had placed it near the western end of the canyon, but its cause was unclear. A meteoroid strike, a landslide or another kind of slope collapse were all possible.
The team built models of each explanation and compared the seismic waves each would produce with what InSight actually recorded. Impacts and landslides did not match. Images from NASA's 5, taken after the event, showed no new crater and no fresh landslide. The best fit was a 6 quake, in which two blocks of crust slide horizontally past each other along a steep fault about 20 to 40 km down.
Song argues the result is convincing because independent lines of evidence agree. The waves indicate sideways sliding at depth. Orbital images show the region is crossed by long-lived fault systems.
What it means, and the limits
The researchers suggest stress from long-term cooling of the planet, from volcanism and from the canyon itself could have reactivated old faults. InSight had already found active faulting at 7 and in southern Elysium Planitia. Together, these sites suggest stress in the Martian crust does not follow a single planet-wide pattern.
The conclusion rests on one event recorded by one instrument. The article doesn't give the quake's size or how tightly its location is pinned down. The same waves had already passed through Mars's core and been used to study it. Now they also reveal what happened at the source.
NASA's 1 lander stopped working in 2022. Its data are still producing results. A team led by Jung-Hun Song, an assistant professor at Imperial College London, working with colleagues at Columbia University and the University of Illinois Urbana-Champaign, has shown that a marsquake recorded in August 2021 came from faults slipping deep beneath Valles Marineris. That canyon system is the largest in the Solar System. The study, published in the peer-reviewed Nature Communications, concludes that faults formed billions of years ago, when Mars was far more active, are still unstable enough to rupture.
The "dead planet" assumption
For decades the standard view was that Mars was geologically finished. Its surface is full of old volcanoes, but the planet has no plate tectonics. Its crust is one continuous shell, which geologists call a "2". On Earth, most earthquakes happen where plates collide, separate or slide past each other. Without that machinery, nobody expected much to be happening on Mars.
InSight (Interior Exploration using Seismic Investigations, Geodesy and Heat Transport) landed in Elysium Planitia in 2018 with a sensitive 3, an instrument that records ground shaking. It detected many marsquakes. Some were caused by meteoroid impacts. Others came from inside the planet, including activity at 4, a set of young fissures near the lander, and in southern Elysium Planitia. Whether the giant canyon on the other side of the planet was also active remained an open question.
The canyon
Valles Marineris runs about 3,900 km long, up to 600 km wide and more than 9 km deep. For comparison, the article gives Earth's largest canyon, the Yarlung Tsangpo Grand Canyon in Tibet, as about 505 km long and up to 6 km deep. The most widely accepted explanation is that Valles Marineris began as a rift. Tension pulled the crust apart, and that stretching is linked to the huge volcanic build-up of the 5 bulge during Mars's 6 to Late Hesperian periods, roughly 4.1 to 3.0 billion years ago. Erosion and the collapse of the rift walls later enlarged it, much as happened in the East African Rift.
One unusual quake
The event, catalogued as S0976a, was recorded on 25 August 2021. It is the only marsquake InSight detected in Mars's western hemisphere, on the opposite side of the planet from the lander. Earlier analyses placed its origin near the western part of Valles Marineris but could not say what caused it. The candidates were a meteoroid impact, a landslide, another form of the slope collapse common on Mars, or a tectonic fault slip.
Each source shakes the ground differently. As an analogy, a hammer blow, a falling rock pile and two boards scraping past each other would all make noise, but each sound has its own character. An impact is a sudden point-like blow at the surface. A landslide is a shallow mass of material moving downslope. A fault slip releases stored stress across a buried surface, and the direction of slip shapes the waves that radiate out.
How the team tested it
The researchers built models of the alternative explanations and calculated the seismic waves each would send to InSight's location. Neither the impact model nor the landslide model reproduced the recorded waves.
They also checked a separate line of evidence. NASA's 7 photographed the region after the event. A meteoroid big enough to cause the quake would probably have left a fresh crater, and a large slope failure would have left visible debris. Neither showed up.
The model that matched best was a 8 quake. In this type, blocks of crust move horizontally past each other along a steep, near-vertical fault. The source sat about 20 to 40 km beneath the valley floor. That is well below the surface processes that cause landslides, and it points to stress stored in the crust itself.
Song argues the result is compelling because separate kinds of evidence agree. The seismic waves indicate sideways sliding on a fault deep underground. The geology seen from orbit shows a region crossed by long-lived fault systems.
Why old faults would move now
According to the researchers, the slip fits what would be expected if pre-existing fault structures were reactivated by a combination of stresses. These include the planet's long-term cooling and contraction, volcanic stresses tied to Tharsis, and local effects of the canyon itself, which removed an enormous volume of rock and changed the loads on the surrounding crust. The article doesn't break down how much each factor contributes.
Taken with the earlier evidence from Cerberus Fossae and southern Elysium Planitia, the result suggests stresses in the Martian crust do not follow one planet-wide pattern. Different regions appear to be responding to different local conditions.
One event, two uses
S0976a was already important before this study. Doyeon Kim, an assistant professor at Imperial and a senior author, notes that its waves travelled through Mars's core and helped researchers probe the deepest part of the planet. The new work uses the same recording to ask what happened at the source. In his words, one marsquake has informed both the planet's centre and an active fault beneath one of its most remarkable landscapes.
Caveats and open questions
The conclusion rests on a single event, recorded by a single seismometer, on the far side of the planet. With one station, locating a quake and working out its fault motion depends heavily on modelling. That is why the absence of craters and landslides in orbital images carries so much weight. The 20 to 40 km depth range shows the remaining uncertainty. The article doesn't report the quake's magnitude, how precisely its location is constrained, or how often such events might occur beneath the canyon.
Answering those questions would take more seismometers on Mars, ideally a network spread across the planet, so quakes can be located by comparing arrival times at several stations. No such mission is described in the article. Song suggests the approach could also reveal ongoing seismic activity on other worlds now assumed to be geologically inactive.
Remember
Faults that formed billions of years ago under Valles Marineris can still rupture today.
The case rests on agreement between models of the seismic waves and the lack of any crater or landslide in orbital images.
Active faulting at several Martian sites suggests stress in the crust varies from region to region.
Baffin Island in the Canadian Arctic, home to the Barnes Ice Cap, the last fragment of the Laurentide Ice Sheet.
A study in Science argues that a new ice age began about 2,000 years ago, and that human-caused warming stopped it around 1960. The evidence comes from the Barnes Ice Cap on Baffin Island in the Canadian Arctic. Barnes is the last surviving piece of the 1, which once buried most of Canada under two miles of ice.
Ice that preserves instead of erasing
Most glaciers slide on meltwater at their base and grind up whatever lies beneath. Barnes is 2: it is frozen to the bedrock and can't slide. Lead author Nicolás Young of Columbia University's Lamont-Doherty Earth Observatory compares it to ice stuck to a car windshield. When the Laurentide retreated, tundra mosses grew on the bare ground. When the ice came back, it covered them and preserved them in place.
Two ways to date it
To date the retreat, the team measured 3, an isotope that builds up in rock surfaces exposed to the sky. The amount shows how long a boulder has been uncovered. These dates show the ice had shrunk inside today's margin by 3,600 years ago.
To date the advance, they radiocarbon-dated the dead moss. Each sample gives a 4, the moment the ice reached that spot. About 70 percent of the dates cluster around 1800 CE, during the 5. Young reads that as a late pulse within a longer advance.
There's a catch. The oldest buried moss at Barnes is still under the ice. The 2,000-year start date comes from nearly 200 kill dates under neighboring ice caps on the same plateau, none of them older than 2,000 years. Young expects Barnes' own oldest plants to be exposed within about 20 years.
Why then, and why it stopped
Summer sunlight in the far north has been falling for about 10,000 years because of slow changes in Earth's orbit. A modest rise in carbon dioxide (about 20 6) couldn't offset that cooling. Models say the next ice age is tens of thousands of years away. Young argues there's no contradiction: those models define an ice age by how big the ice has grown, while his evidence shows the first turn from shrinking to growing.
Industrial emissions ended the advance. By 1960 Barnes was losing more ice each year than it gained. About 35 percent of its surface sat above the snow line in the 1960s. Today none does, so the whole cap melts every summer. Young's models say Barnes will be gone within a few centuries.
Young argues that warming didn't save us from anything, since a full ice age would have taken tens of thousands of years to arrive. Instead, he says, it has broken one of Earth's most regular cycles.
A study in Science reports what may be direct physical evidence that a new ice age began about 2,000 years ago, and that human greenhouse gas emissions stopped it around 1960. The evidence comes from the Barnes Ice Cap, on the central plateau of Baffin Island in the Canadian Arctic. Barnes is the last surviving piece of the 1, the largest of the Pleistocene ice sheets. At its peak the Laurentide covered most of Canada under two miles of ice and held around 80 meters of sea level.
The team, led by geologist Nicolás Young of Columbia University's Lamont-Doherty Earth Observatory, concludes that the Laurentide shrank to its smallest size about 3,600 years ago. It then started growing again roughly 2,000 years ago. The researchers read that regrowth as the opening move of the next glaciation.
Why this ice keeps a record
Ice sheets usually destroy the evidence of their own history. Most glaciers are warm-based: meltwater at the bed lets them slide, and the sliding ice grinds up whatever lies beneath. Barnes is 2, meaning it is frozen to the bedrock and can't slide. Young compares it to the ice you scrape off a car windshield, which "is sort of just stuck to what it's on."
This matters because of what happened on the plateau. As the Laurentide pulled back, tundra plants, including small rooted mosses, colonized the bare ground. When the ice advanced again, it didn't scour those plants away. It covered them and preserved them in place.
Two clocks
The team used two independent dating methods.
Beryllium-10 for the retreat. Beryllium-10 is an isotope that builds up in the top few centimeters of rock exposed to the sky, because cosmic rays produce it there. Measuring how much has built up in a boulder's upper surface shows how long the rock has been uncovered. These dates show the Laurentide had pulled back inside today's ice margin by 3,600 years ago, and it probably shrank further by around 3,000 years ago.
Radiocarbon for the advance. When the advancing ice reached a patch of moss, it killed the moss. Radiocarbon dating of the dead moss gives a 3, the moment the ice margin arrived at that spot. Kill dates from many locations, put together, map the ice edge as it moved forward.
About 70 percent of the radiocarbon dates cluster around 1800 CE, at the peak of the 4, when Northern Hemisphere glaciers were at their largest in recent millennia. Young argues that at Barnes, the Little Ice Age was not a separate event. It was a late pulse within an advance that had already been going for 2,000 years.
The missing samples
There's a gap in the evidence. Since 1960, Barnes' margin has retreated 200 to 800 meters, exposing mosses killed from about 1000 CE onward. The oldest kill dates, the ones that would mark the start of the advance, are still under the ice.
To fill the gap, the team drew on other small ice caps on the same plateau, close enough to share the same climate. Earlier studies collected nearly 200 kill dates from beneath them, and none is older than 2,000 years. Young reasons that these caps all began advancing about 2,000 years ago, and that Barnes, "right next door," probably did too. This is an inference from neighboring ice caps, not a direct measurement at Barnes. Young expects that further retreat could expose the decisive 2,000-year-old plants within about 20 years.
A tug of war
The study explains the timing as a contest between two forces. Summer sunlight at high northern latitudes peaked 10,000 to 11,000 years ago and has fallen since, because of slow changes in Earth's orbit. Less sunlight pushes the planet toward glaciation. Meanwhile, atmospheric CO₂ rose by about 20 5 (ppm) between 8,000 and 2,000 years ago, which strengthened the greenhouse effect. In Young's account, the falling sunlight outweighed that small CO₂ warming. By about 2,000 years ago, temperatures had dropped enough for the ice to start growing.
This seems to conflict with models of orbital forcing and CO₂ that say the next ice age has been postponed by tens of thousands of years. Young argues the two don't contradict each other, because the models define 6, the start of a glaciation, as ice reaching a certain size. Until now there was no way to detect the earlier moment when an ice sheet first stops shrinking and starts to grow. His evidence concerns that first turnaround, not a full-sized ice sheet.
Then the Industrial Revolution
Greenhouse gases rose about 12 ppm between 1750 and 1850, another 50 ppm by 1960, and a further 138 ppm by 2024. By 1960, Barnes' 7 had turned negative, meaning it was losing more ice each year than it gained, and the advance ended.
The decline since then is steep. In the 1960s and 1970s, about 35 percent of the cap's surface lay above the snow line. By the early 2000s, about 3 percent did. Today none of it does, so the whole cap melts every summer and no new ice forms. "An ice cap or glacier cannot survive if it does not have an accumulation zone," Young says. His models say Barnes will disappear within a few centuries under any plausible emissions scenario.
Did warming save us?
Young rejects that framing. A full ice age climate with large ice sheets would have taken several tens of thousands of years to develop, so emissions "hasn't really saved us from anything." What they have done, he argues, is interrupt "one of the most consistent cycles in the Earth system," the pacing of ice ages over the last 2.5 million years.
What's still open
The central claim rests on a chain of evidence. The retreat date comes from beryllium measurements at Barnes. The advance is mapped from kill dates, but only back to about 1000 CE. The 2,000-year start date is borrowed from neighboring ice caps. Calling a regional ice advance the start of a global glaciation is the team's interpretation, and it depends on how glacial inception is defined. The article doesn't say how other researchers have responded, or whether ice elsewhere shows the same turnaround at the same time.
Remember
Cold-based ice can preserve the ground beneath it, so a glacier can record its own history.
The 2,000-year start date comes from neighboring ice caps. Barnes' own oldest moss is still under the ice.
No part of Barnes is above the snow line any more, so it can't form new ice and will likely vanish.
Artist's concept of Swift in orbit. Air drag in the thin upper atmosphere is now pulling it down.1 / 2
NASA's Neil Gehrels Swift Observatory made its last observation on October 20, 2026. Its orbit has sunk below 275 kilometers. At that height, air drag keeps its telescopes from holding steady on targets. The satellite will re-enter the atmosphere within weeks. It launched in November 2004 for a planned two-year mission and worked for nearly 22 years.
Built to chase flashes
1 are the most powerful explosions in the universe, and they are over in seconds. What causes a burst shows up in its 2, the fading X-ray and visible light that follows. That glow dims fast. Before Swift, big telescopes couldn't be pointed at a burst in time.
Swift handled the whole chain by itself. It spotted a burst and sent the position to observatories on the ground. Then it turned two telescopes pointing in the same direction, one X-ray and one ultraviolet/optical, to image the spot and sharpen the position. That usually took about a minute.
The short-burst result
Speed mattered most for 3, which peak in under two seconds and had never been caught in afterglow. In May 2005 Swift detected 4, which lasted 0.03 seconds. It turned toward the spot fast enough to collect 11 X-ray photons, the first afterglow ever seen from a short burst.
Those few photons supported a long-standing theory. Short bursts most likely come from two 5 merging. Neutron stars are collapsed stellar cores, each about the Sun's mass packed into a ball the size of a city. A combined gravitational-wave and gamma-ray detection in 2017 later confirmed the idea.
A flexible workhorse
Astronomers could request "6" observations of sudden events, and the team could command them within minutes. Swift could also monitor a single source for minutes or for months, and it could schedule up to 75 targets a day. Over its life it observed:
more than 2,000 gamma-ray bursts
more than 1,400 7 (exploding stars)
stars torn apart by black holes
active galaxies
comets and asteroids
It also mapped the whole sky in X-rays. Its data fed about 7,000 papers.
What's left, and what's missing
The public archive is about 12 terabytes. It includes nearly 22 years of brightness records and more than 1.5 million ultraviolet/optical images. It will keep producing research long after the spacecraft is gone.
There is no direct replacement yet. NASA says it will lean on its existing telescopes and is looking at fast-to-launch commercial spacecraft and new missions, but it names no successor and gives no date. Until then, short-lived cosmic events will be harder to catch while they are still bright.
NASA's Neil Gehrels Swift Observatory made its final observation on October 20, 2026, and its science mission is over. The spacecraft is now orbiting less than 275 kilometers (171 miles) above Earth. Air drag at that height is strong enough that its telescopes can no longer hold steady on targets. NASA expects it to re-enter the atmosphere within weeks. Swift launched on November 20, 2004, for a planned two-year mission and kept working for nearly 22 years.
The problem Swift was built to solve
1 are the most powerful explosions in the cosmos. They also don't last. S. Bradley Cenko, Swift's principal investigator at NASA's Goddard Space Flight Center, says they "came and went so quickly that no one could target them with large telescopes to learn more." The gamma-ray flash itself says little about what caused it. The useful information is in the 2, the fading X-ray and visible light that follows. To catch the afterglow, an observatory has to find the burst, pin down its position, and point sensitive telescopes at it before the glow fades.
Swift was designed to do all of that on its own. Cenko describes the sequence:
It detects a burst and works out roughly where it is. A wide-field gamma-ray instrument, the 3, did this. The article doesn't name it, but it is well documented.
It sends the position to observatories on the ground.
It turns itself so that two narrow telescopes pointing in the same direction, one X-ray and one ultraviolet/optical, can image the spot and sharpen the position.
The whole sequence usually took about a minute. Neil Gehrels, Swift's first principal investigator, shaped it as a "multiwavelength" observatory, meaning it observed in several kinds of light at once. NASA renamed the mission after him in 2018, following his death.
The short-burst breakthrough
Speed mattered most for 4, which reach peak brightness in under two seconds. Before Swift, no observatory could locate them quickly and precisely enough to see an afterglow. In May 2005, Swift detected 5, a burst that lasted just 0.03 seconds. It turned toward the spot fast enough to collect 11 X-ray photons. That made it the first short burst with a detected afterglow.
Eleven photons is a small number. It was still enough to place the burst near a galaxy and to test the theories about where short bursts come from. The observations supported the long-standing idea that short bursts come from mergers of two 6. Neutron stars are the collapsed cores of dead stars, holding about the mass of the Sun in a ball the size of a city. That idea got its strongest confirmation in 2017. Gravitational-wave detectors recorded two neutron stars merging, and gamma-ray telescopes caught a short burst from the same event. The NASA article doesn't cover that history, but it explains why the 2005 result mattered.
An astronomical multitool
Swift's software and operations mattered as much as its hardware. Astronomers could request "7" observations, meaning unplanned looks at sudden events, and the team could command them from the ground within a few minutes. Swift could also run monitoring programs on a single source, lasting anywhere from minutes to months. Its scheduling system could handle up to 75 separate targets a day. John Nousek, the mission's operations director at Penn State, credits fast hardware, quick operations and close teamwork between the flight and science teams for putting Swift "at the crossroads of burgeoning areas of research."
Over its life, Swift:
observed more than 2,000 gamma-ray bursts
studied more than 1,400 8 (exploding stars)
watched stars being torn apart by black holes
monitored active galaxies, whose central black holes are feeding
surveyed the whole sky in X-rays
observed asteroids and comets
Its data contributed to about 7,000 published papers.
What it leaves behind
The public archive holds nearly 22 years of brightness measurements of cosmic outbursts, multiwavelength spectra, and more than 1.5 million images from the ultraviolet/optical telescope. It totals about 12 terabytes. Shawn Domagal-Goldman, director of NASA's Astrophysics Division, says the archive will "fuel new discoveries for decades more." Long, consistent records like this are valuable because they let astronomers go back and check what a source was doing before it did something surprising.
The gap it opens
Swift's end leaves a real gap. Many astronomers relied on it as a fast, flexible responder that could follow up alerts from other instruments, including gravitational-wave and neutrino detectors. NASA says it will use and "augment" its current fleet of space telescopes in the meantime. It is also looking at commercial spacecraft that can reach orbit quickly and at new missions. The article names no replacement and gives no timeline. Domagal-Goldman's argument is that Swift showed "how critical rapid-response observations are to the entire community." If he is right, then until a replacement flies, astronomers will have a harder time catching short-lived events at their brightest and most informative.
The article doesn't say why Swift's orbit decayed at this particular rate. High solar activity, which heats and expands the upper atmosphere, is the usual reason satellites like Swift come down sooner than planned. In 2025 NASA announced a contract for a commercial spacecraft to try to boost Swift into a higher orbit. This announcement doesn't mention that effort, so readers can't tell from it what happened.
Remember
Swift's main asset was speed: about a minute from detecting a burst to pointing its own telescopes at it.
Eleven X-ray photons from a 0.03-second burst in 2005 tied short gamma-ray bursts to neutron-star mergers.
NASA has no named successor for fast-response observations, so the field faces a coverage gap.
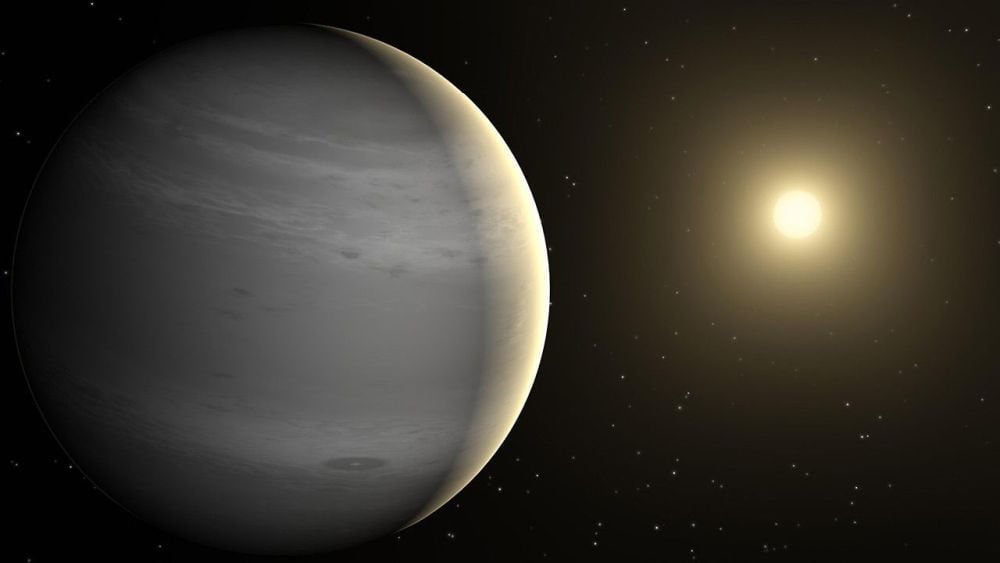
Artist's view of a carbon-atmosphere white dwarf, the type the models predict looks pink.1 / 2
Astronomers have long read a star's color as a thermometer: red and orange for cool stars, white around 6,000 kelvin, pale blue for the hottest. A team led by the University of Warwick now reports that some 1 break this rule. White dwarfs are the dense, Earth-sized cores left behind when Sun-like stars die. The study appears in 2, a peer-reviewed journal of the Royal Astronomical Society.
Why color usually tracks temperature
The temperature rule assumes a star acts like a 3, an ideal object whose glow depends only on its temperature. "This set of red/orange/white/blue are the only colors that are possible for a true blackbody," says lead author Mark Hollands, a postdoctoral researcher at Warwick. His comparison is a blacksmith's metal, which goes from red to orange as it heats.
Real stars have atmospheres, and atoms in an atmosphere absorb particular wavelengths. White dwarfs have much denser atmospheres than stars like the Sun. The team wanted to know whether elements such as carbon, calcium or sodium could absorb enough visible light to change the color a person would see.
What they did
The researchers used computer models to work out the colors of 151 white dwarfs within 20 4 (about 65 light-years) of Earth. The article doesn't explain how the models turn a star's light into a perceived color. It also doesn't say whether anyone observed the colors directly. These are modeled appearances, not photographs.
What they found
Five of the 151 stars came out off-white: three pink and two yellow. That is about 3.3 percent, or roughly one in thirty.
The colors depend on what is in the atmosphere:
Carbon turns white dwarfs pink or purple.
Cooler stars with hydrogen and helium tend toward cyan or blue.
Debris from the star's old planetary system that has fallen into the atmosphere tends to make it green.
"Across the entire population of white dwarfs in the Universe, that is still a lot of oddly colored stars," says co-author Boris Gänsicke. He adds that the median, or typical, white dwarf "really is white."
Caveats
The sample is small and local, so applying 3.3 percent to the whole galaxy is an extrapolation. The article doesn't say how strong these tints are. The striking pictures released with the study are artist's illustrations, not images of real stars.
Hollands notes that 5 break the rule too. These are objects too cool to fuse ordinary hydrogen. Sodium, potassium and titanium oxide in their dense atmospheres can change their colors, and some researchers have concluded that brown dwarfs may look violet.
University of Warwick astronomers report that 1 aren't always white. The study appears in 2, a peer-reviewed journal of the Royal Astronomical Society. The team modeled how 151 nearby white dwarfs would look to a human eye. Five came out pink or yellow, about 3.3 percent of the sample. The cause is not temperature but what sits in the stars' atmospheres.
The rule being tested
A star's color is usually taken as a direct readout of its surface temperature. The reasoning treats a star as a 3, an idealized "perfect radiator" that absorbs all light falling on it and gives off a spectrum set entirely by its temperature.
Lead author Mark Hollands, a Warwick postdoctoral researcher, describes the sequence. "As an object gets hotter it will emit more light at optical wavelengths, changing from red to orange (think of a blacksmith working on a piece of hot metal)." The orange then grows paler, and "by 6000K a black body will appear will just appear white," because its output is spread across the whole visible range. Hotter still, most of the light shifts into the ultraviolet, and what is left in the visible looks pale blue. "This set of red/orange/white/blue are the only colors that are possible for a true blackbody," Hollands says. On the blackbody curve, a temperature simply can't produce green, pink or purple.
Real stars only come close to this ideal. Their outer layers contain atoms and molecules that absorb specific wavelengths, leaving dark 4 in the spectrum. In most stars these lines are too narrow to change the overall color much.
Why white dwarfs
A white dwarf is the exposed core of a dead Sun-like star. It holds roughly a solar mass in an Earth-sized body, no longer fuses anything, and cools slowly over billions of years. The team picked white dwarfs because they are extreme, especially their atmospheres, which are far denser than the Sun's. The question was whether elements in those dense atmospheres, such as carbon, calcium or sodium, could absorb enough visible light to push a star's color off the blackbody sequence.
An analogy (ours, not the article's): picture a white lamp behind a filter that removes one band of colors. The light that gets through is no longer white. If you remove much of the green, the rest looks magenta-pink. A dense atmosphere can act like that filter. The thicker the gas, the wider the absorption features, and the bigger the slice of the spectrum it removes.
What the team did
The researchers used computer models to work out the colors of 151 white dwarfs within 20 5 (about 65 light-years) of Earth. A volume-limited sample like this one, which includes everything within a set distance, is useful because it isn't biased toward the brightest or most unusual objects. The article doesn't describe the modeling in detail. It doesn't say how spectra were converted into colors a human would perceive, or whether the models were checked against direct color observations. The results should be read as predicted appearances.
Results
Five of the 151 white dwarfs came out visibly off-white: three pink and two yellow. That is 3.3 percent, about one in thirty.
The study also links particular colors to particular atmospheres:
Carbon-bearing atmospheres make white dwarfs look pink or purple.
Cooler white dwarfs with hydrogen and helium atmospheres tend toward cyan or blue.
Atmospheres polluted with debris from the star's former planetary system usually look green. A press illustration shows a greenish white dwarf colored by sodium-rich planetary material.
The article doesn't say exactly how these categories map onto the five off-white stars in the sample. Some of the color classes may be modeled possibilities rather than stars actually found within 20 parsecs.
The planetary-debris finding links to a well-established area of research. White dwarf gravity is so strong that heavy elements sink out of sight relatively fast. When metals show up at the surface, astronomers take it as a sign the star has recently swallowed rocky material, such as asteroids or fragments of planets. Here, that material may also tint the star.
Co-author Boris Gänsicke, a Warwick physics professor, puts the fraction in perspective: "One in thirty might not sound like a huge fraction, but across the entire population of white dwarfs in the Universe, that is still a lot of oddly colored stars out there." He also notes the other side. Taking the median across a representative population, "the average white dwarf really is white."
Caveats and open questions
Small sample. Five oddballs out of 151 is a small count, so the 3.3 percent figure is uncertain. Applying it to every white dwarf in the universe assumes the local neighborhood is typical.
Models, not snapshots. The colors come from modeling. No one has seen a pink white dwarf by eye, and these stars are far too faint to see without a telescope anyway.
How strong the tints are. The article doesn't say whether these colors are vivid or faint tints. The images that came with the study are artist's illustrations.
What it's for. The article suggests the work could inform studies of how stars form and evolve, but doesn't explain how. The more concrete point is that a star's color alone can mislead you about its temperature when its atmosphere is unusual.
Not just white dwarfs
Hollands points to a second group that breaks the blackbody rule: 6. These are substellar objects too cool to fuse ordinary hydrogen in their cores, though they can fuse 7, a heavier form of hydrogen. They give off most of their energy in the infrared, but some light leaks out at visible wavelengths. Their dense atmospheres contain sodium, potassium and molecules such as titanium oxide, which absorb strongly enough to change their colors too. "Some astronomers who study brown dwarfs have looked into their appearance in the past and concluded that they can appear violet in color!" Hollands says.
Remember
Elements in a star's atmosphere, not just its temperature, can set the color it shows.
Carbon gives pink or purple, swallowed planetary debris gives green, and cool hydrogen or helium gives cyan or blue.
The typical white dwarf still looks white. The off-white ones come from models of a small local sample.