Egg-Shaped Worlds and Flipping Poles · Morning Gist
Saturday, October 245 stories · 15 min
Egg-Shaped Worlds and Flipping Poles
Webb resolves one exoplanet's atmosphere region by region, a Permian extinction lines up with frantic magnetic reversals, and Japan heads for Phobos.
Picked from 41 new articles across 10 sources · arrow keys for other days
Today in 30 seconds
30s left
Webb finds WASP-17 b's evening edge about 660 K hotter than its morning edge, with its atmosphere puffed out 1.8 times thicker there. story 1 ↓
South China rocks show 11 magnetic reversals per million years around 261 million years ago, timed with a Permian mass extinction. story 2 ↓
Among 173 transplant patients whose meals were weighed, each extra 100 g of sugar during antibiotics meant 24% lower gut diversity. story 3 ↓
Swapping gas stoves for electric in Cleveland homes eased asthma more than typical drugs do, though the study was small and uncontrolled. story 4 ↓
Japan's probe to Phobos launched carrying Idefix, a 24 kg rover, to bring back soil that could show how Mars's moons formed. story 5 ↓
NASA set out a 14-day plan for Artemis III in 2027, an Earth-orbit crew test that helps choose SpaceX's or Blue Origin's lander.
1/5Universe Today· Andy Tomaswick· Oct 23
Webb maps hot Jupiter WASP-17 b's atmosphere edge by edge, revealing an egg-shaped planet
A Bristol and Cornell team used the James Webb Space Telescope and a new analysis method to map hot Jupiter WASP-17 b's atmosphere all the way around its edge. The hot evening side swells to 1.8 times the thickness of the morning side.
Why it matters · Exoplanet atmospheres are usually measured as one blurred average. Here a single planet's atmosphere is resolved into regions, which lets astronomers test models of alien weather and chemistry place by place.
Know this first
Context from the editor, not the article · 28 sec
1 · How transits reveal atmospheres
When a planet passes in front of its star, some starlight filters through the thin ring of atmosphere at its edge, called the limb. Gases absorb particular wavelengths, so the filtered light shows what the atmosphere contains.
2 · Hot Jupiters and tidal locking
Hot Jupiters are gas giants that orbit very close to their stars. Most are tidally locked, with one side always facing the star. Winds carry heat from the permanent dayside toward the nightside.
3 · Morning and evening terminators
2/5Universe Today· Evan Gough· Oct 23
Rapid magnetic pole flips coincided with a Permian mass extinction
Chinese geologists dated magnetic signals in a 3.75-million-year rock sequence. They found Earth's poles flipping unusually often just as the end-Guadalupian extinction struck. It is a correlation, and the authors say causation is unproven.
Why it matters · It adds a well-dated case to an old, unresolved question: whether events in Earth's core can reach up and harm life at the surface.
Know this first
Context from the editor, not the article · 28 sec
1 · How pole flips are recorded
When lava cools or sediment settles, magnetic minerals line up with Earth's field and lock in place. Reading that orientation layer by layer shows when north and south swapped. This study of ancient magnetism is called paleomagnetism.
2 · Where the field comes from
Earth's magnetic field is generated by molten iron churning in the outer core, a system called the geodynamo. Heat flowing from the core into the mantle above drives it, and changes in that heat flow are thought to trigger reversals.
3 · The Permian's two extinctions
The Permian period ended 252 million years ago with the largest mass extinction known. About nine million years earlier, the end-Guadalupian extinction hit marine life hard. Both coincide with huge volcanic outpourings.
3/5Science News· Mariella Careaga· Oct 23
Sugar during antibiotic treatment linked to bigger gut-bacteria losses in cancer patients
Researchers tracked more than 9,000 weighed hospital meals eaten by blood cancer patients. Those who ate more sugar while on antibiotics lost more gut bacterial diversity and had more growth of Enterococcus, a bacterium linked to hard-to-treat infections.
Why it matters · Most diet–microbiome studies depend on people remembering what they ate. Here meals were weighed to the gram, so the sugar link rests on unusually solid diet data, plus a supporting mouse experiment.
Know this first
Context from the editor, not the article · 28 sec
1 · Gut diversity and why it matters
The gut holds trillions of bacteria from hundreds of species. Researchers often score its health by diversity: how many species are present and how evenly they are spread. Low diversity tends to mean a few species have taken over.
2 · Antibiotics clear the field
Antibiotics kill helpful gut bacteria as well as harmful ones. Species that survive, sometimes because they are drug-resistant, can then multiply into the empty space. This takeover is called a bloom.
3 · Stem cell transplant patients
4/5Science News· Aimee Cunningham· Oct 23
Swapping gas stoves for electric ones eased asthma in Cleveland homes
Researchers in Cleveland put electric stoves into homes in place of gas ones. Months later, 85 people with poorly controlled asthma reported symptom relief two to three times larger than medication usually gives. There was no comparison group.
Why it matters · About a third of US homes cook with gas. If this result holds up in a proper trial, a change to the home could beat a prescription, and insurers might start paying for it.
Know this first
Context from the editor, not the article · 34 sec
1 · Why gas flames pollute
Burning natural gas in air makes nitrogen dioxide (NO2), because the heat of the flame makes nitrogen and oxygen in the air react. NO2 irritates the airways and is linked to wheezing, coughing and asthma attacks. Electric and induction stoves don't burn anything, so they make no NO2.
2 · Measuring asthma control
Doctors often judge asthma with short questionnaires about recent symptoms, night waking, inhaler use and lost activity. The patient fills them in, so the scores are self-reported. They're useful, but they can be swayed by expectations and by the season.
3 · Before-after versus randomized
5/5Scientific American· Oct 23
Japan launches a probe to land on Mars's moon Phobos and bring back a sample
Japan's space agency launched its Martian Moons Exploration probe on October 19. It will map Phobos, drop a small rover, land, and return 10 grams of soil in 2031 to test how Mars's moons formed.
Why it matters · Nobody knows how Mars's two moons formed. Soil from Phobos measured in labs on Earth could settle it, and every earlier mission to Phobos has failed.
Know this first
Context from the editor, not the article · 29 sec
1 · Mars's two small moons
Phobos, about 26 km long, and Deimos, about 16 km, were discovered in 1877. Both look like lumpy asteroids, yet both circle directly above Mars's equator in near-circular orbits. That combination is hard to explain.
2 · Why bring samples home
Instruments on a spacecraft are limited by mass and power. Lab equipment on Earth can measure chemistry and isotope ratios, a kind of chemical fingerprint, precisely enough to tell whether material came from Mars itself or from the asteroid belt.
3 · How our Moon formed
Most scientists think a Mars-sized body hit the early Earth. The impact threw out rock that quickly gathered into the Moon. This is the giant-impact model, and some researchers think something similar happened at Mars.
The terminator is the line between day and night. On a tidally locked planet, gas crosses the morning terminator as it comes in from the cold nightside, and the evening terminator as it leaves the hot dayside.
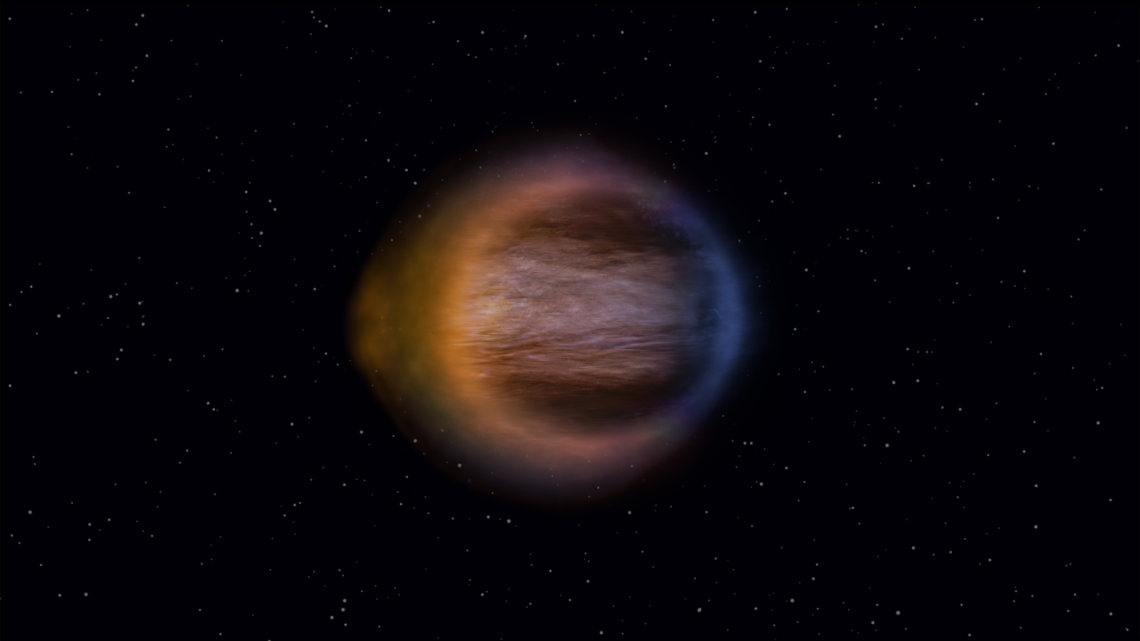
Artist's impression of WASP-17 b with its egg-shaped atmosphere, thicker on the hot evening side.
Astronomers have mapped how a giant exoplanet's atmosphere varies around its edge and found that it is lopsided. A team led by Lili Anderson of the University of Bristol, working with Cornell researchers, used the 1 to study WASP-17 b. The peer-reviewed results appear in Nature Astronomy.
An extreme planet
WASP-17 b lies about 1,300 light years away. It is a 2, a gas giant orbiting very close to its star, with a four-day year. It has about half Jupiter's mass but nearly twice its diameter, which gives it roughly the density of styrofoam. Like most hot Jupiters, it is 3: one side always faces the star.
Why averages hide things
Astronomers usually study an exoplanet's atmosphere with 4. As the planet crosses its star, starlight filters through the ring of atmosphere at its edge, and gases leave fingerprints at particular wavelengths. That measurement averages over the whole ring. It cannot tell the cold morning side from the hot evening side or from the poles.
Measuring the outline
The team used a technique called 5, run in modelling software called 6. It treats the planet's outline as an adjustable loop instead of a fixed circle. As the planet slides onto and off the star's disk, different parts of its edge cross the star's edge at different times. So the exact way the starlight dims records the atmosphere's thickness at each angle. JWST's precise infrared data made it possible to pull out a separate spectrum for each region.
What they found
The morning edge is about 858 K and the evening edge about 1,522 K, a difference of roughly 660 K.
Hot gas expands, so the evening-side atmosphere is 1.8 times thicker. Seen from Earth, the planet looks like an egg on its side.
The authors link this to an eastward equatorial jet stream that carries dayside heat around the planet. The gas cools and deflates on the nightside.
Water vapour and carbon dioxide are spread evenly from equator to poles. Methane and sulphur dioxide shift near the poles, possibly because they survive better away from the jets.
Caveats
The asymmetry was predicted, so this confirms theory by measuring it directly. Earlier JWST studies had already compared morning and evening sides on other planets. What's new is a map of the whole edge, including the poles. The shape comes from fitting a model to subtle changes in the starlight, the article gives no uncertainties, and the polar chemistry looks tentative. WASP-17 b's bloated atmosphere makes it an unusually easy target. Smaller worlds will be harder.
The news
A team led by Lili Anderson of the University of Bristol, working with researchers at Cornell, has mapped how the atmosphere of the exoplanet WASP-17 b changes around its edge. The study is peer-reviewed and appears in Nature Astronomy. The authors used the 1. They found that the planet's hot evening side holds an atmosphere 1.8 times thicker than its cooler morning side, so from Earth the planet's outline looks more like an egg lying on its side than a circle. The paper calls this the first spatial map of a 2's atmospheric 3. The limb is the thin ring of atmosphere around the planet's edge that starlight filters through.
The planet
WASP-17 b was discovered in 2009 and lies about 1,300 light years away in the constellation Scorpius. It is an extreme hot Jupiter. It circles its star every four days, has about half Jupiter's mass, and is puffed up to nearly twice Jupiter's diameter, which gives it roughly the density of styrofoam. Its large, hot, extended atmosphere makes it one of the easiest exoplanet atmospheres to study, and it is well studied. Earlier observations mapped infrared heat from its dayside, measured its nightside glow, and detected tiny quartz crystals in its upper atmosphere.
The problem: averaging hides the weather
The standard method is 4. As the planet transits, meaning it passes in front of its star, astronomers measure how much starlight is blocked at each wavelength. Gases absorb at specific wavelengths, so the planet looks slightly bigger at those wavelengths, and that pattern reveals the atmosphere's chemistry.
The catch is that the measurement averages over the whole ring of atmosphere. It treats the planet as a uniform circle. A 5 world is anything but uniform. Gas arriving at the morning 6 has just crossed the cold nightside. Gas reaching the evening terminator has just been baked on the dayside. The poles sit away from the main wind flow. One averaged spectrum blends all of these regions into a composite that may not match any real place on the planet.
The method: 7
To pull the regions apart, the team used a technique called transmission strings, run through modelling software called 8. Instead of fitting the planet's silhouette as a fixed circle, Harmonica treats it as an adjustable loop whose radius can vary with angle around the planet. (The published method builds that loop from a sum of smooth waves, a Fourier series.)
The information comes from the moments when the planet enters and leaves the star's disk, known as 9. During those minutes, different parts of the planet's edge cross the star's edge at different times. An analogy: picture an egg sliding sideways behind the edge of a lit window. Whether the fat end or the thin end goes first changes the timing of how quickly the light dims, so the exact shape of the dimming curve records the shape of the egg. Harmonica fits the outline that best matches the measured dimming at each wavelength. That yields a separate spectrum for each angle around the limb: morning, evening, and toward the poles.
The method needs very precise data with fine time resolution, because the signal sits inside a few short minutes of each transit. JWST's sensitivity in the infrared is what makes it workable. The article doesn't name the specific instrument or how many transits were observed.
The results
Temperature: about 858 K at the morning terminator and 1,522 K at the evening terminator. That is a gap of roughly 660 K (the article rounds it to 650 K).
Shape: hot gas expands, so the evening-side atmosphere extends to 1.8 times the height of the morning side.
Weather: the authors link the asymmetry to the strong eastward jet stream along the equator that is typical of tidally locked planets. The jet carries heated gas from the dayside toward the nightside. The gas cools there and the atmosphere deflates before it comes back around to the morning side.
Chemistry: despite the temperature contrast, water vapour and carbon dioxide appear evenly spread around the limb, from equator to poles. Methane and sulphur dioxide show changes near the poles. The article suggests these molecules survive better away from the jet streams.
The team expected the asymmetry, so the result confirms theory rather than overturning it. Its value is that it measures the asymmetry directly, region by region.
How new is it?
The headline phrase "first lopsided planet" needs context. Earlier JWST studies, of WASP-39 b and WASP-107 b in 2024, already compared the morning and evening sides of hot gas giants and found differences. As the paper's title frames it, the new step is a spatial map of the whole limb, including the polar regions, rather than a split into two halves.
Caveats and open questions
The map comes from fitting a model to subtle changes in a light curve, so the shape it recovers depends on the analysis. The article doesn't report uncertainties, and the methane and sulphur dioxide trends at the poles read as tentative hints rather than firm detections. This is also a single planet, chosen because its bloated atmosphere gives an unusually strong signal. Smaller or denser worlds will be much harder targets. The article doesn't say how quartz clouds or hazes, already seen on WASP-17 b, affect the mapped profile.
The authors expect JWST, and larger telescopes planned for later this century, to apply the same technique to other planets. Combined with earlier dayside and nightside maps, WASP-17 b now has one of the most complete three-dimensional pictures of any exoplanet atmosphere.
Remember
The timing of how starlight dims as a planet slides onto and off its star records the planet's outline.
WASP-17 b's evening atmosphere is 1.8 times thicker than its morning side, consistent with equatorial jet streams.
Water and carbon dioxide are evenly mixed around the edge; methane and sulphur dioxide hints near the poles look tentative.
The paper's stacked timelines: reversal rate, volcanism, sea level, carbon and species diversity across the Permian extinctions.1 / 2
A burst of pole flips
Geologists in China have found that Earth's magnetic field was unusually unstable at the time of a Permian mass extinction. The team was led by Min Zhang of the Chinese Academy of Sciences, and the peer-reviewed study appeared in National Science Review. They read magnetic signals locked into a 3.75-million-year stack of rock at Fengshan, South China, covering 262.5 to 258.75 million years ago.
The rocks contain 29 1, which are intervals of rock with a single magnetic polarity. The authors put the reversal rate at 11 flips per million years, "one of the highest records in Earth's history." Over the last 83 million years, Earth has averaged about 2.2 reversals per million years (183 in total), so this is roughly five times faster.
Why that timing matters
The unstable stretch overlaps the end-Guadalupian extinction about 261 million years ago, a major loss of marine life. That was nine million years or so before the far larger end-Permian die-off. The same window also saw 2, enormous lava outpourings fed by 3, which are columns of hot rock rising from deep inside the Earth. LIPs repeatedly coincide with extinctions and sudden climate shifts.
The authors read the reversal burst as a sign of "4 instability." The geodynamo is the churning of molten iron in the outer core that generates the field. In their picture, a deep-Earth upheaval may have disturbed the core and the mantle at the same time, just as life at the surface was in crisis.
How a flip might hurt life
The authors suggest that a field weakened by reversals may have let in more cosmic rays and solar wind. That could have thinned the ozone layer and raised ultraviolet radiation at the surface. Universe Today's Evan Gough notes that most scientists doubt this idea. There is also a basic problem: most reversals in the geological record passed without any mass extinction.
The caveat
The result is a timeline match, not a demonstrated cause. The authors themselves write that "the causation remains unproven." They say only that geomagnetic instability, alongside other factors, "might have influenced" the late Permian crises. What they do add is a detailed record across a boundary where such data have been sparse. The obvious next test is whether rocks elsewhere in the world show the same burst of flips at the same time.
The finding
A team led by Min Zhang of the Institute of Geology and Geophysics at the Chinese Academy of Sciences in Beijing has reported one of the most unstable stretches of Earth's magnetic field ever recorded. The peer-reviewed paper appeared in National Science Review. The unstable stretch lines up in time with a mass extinction about 261 million years ago. The team suggests the two may be linked, but they say plainly that "the causation remains unproven."
Why pole flips are hard to study
Earth's north and south magnetic poles have swapped many times over the planet's history. Geologists count 183 of these geomagnetic reversals in the last 83 million years. That averages out to roughly one every 450,000 years. The last one was about 780,000 years ago, so in a loose sense we are "overdue." Universe Today's Evan Gough points out that the average is mostly a mathematical abstraction, though. Reversals don't follow a cycle. Long calm spells can give way to bursts of rapid flipping, and nobody can predict the next one.
Each reversal is also a messy event. Computer models of the 1, the churning of molten iron in the outer core that produces the field, show tidy north–south field lines breaking down into a tangle before a new orientation settles in. Working out exactly when a reversal happened, and how long it took, means carefully reading a jumbled record left in lava and sediment.
The method for reading it is 2. When lava cools, or when fine sediment settles on a seabed, its magnetic minerals line up with the field of the time and get locked in. Sampling a thick stack of rock layer by layer gives a sequence of normal and reversed polarity. Matching that sequence to a timescale is called 3. Each interval of rock with a single polarity is a magnetozone.
What the Fengshan rocks show
Zhang's group worked on the Fengshan section in South China. Its layers cover 3.75 million years, from 262.5 to 258.75 million years ago. That window spans the Guadalupian–Lopingian transition, the boundary between two stages of the Permian period. The end-Guadalupian extinction, a major loss of species and especially of marine life, falls at that boundary, around 261 million years ago.
The section contains 29 4. The authors report a reversal frequency of 11 per million years, "one of the highest records in Earth's history." To put that in perspective, the 183 reversals of the last 83 million years come to about 2.2 per million years, so the Fengshan rate is about five times higher. The article doesn't say whether 11 per million years is the average over the whole section or the rate in its busiest part.
The authors read this as a period of "geodynamo instability" linked to processes deep inside the Earth. In their reading, something was disturbing heat flow at the core–mantle boundary enough to make the field flip over and over.
Lining up the timelines
The paper's central figure stacks several records on one age axis:
(a) reversal frequency, with 5 data (estimates of how strong the field was)
(b) volcanic activity, with the main phases of large igneous provinces highlighted
(c) sea-level changes and the layout of the supercontinent Pangaea
(d) atmospheric carbon
(e) species diversity, marking both the end-Guadalupian and the end-Permian extinctions
The overlap is what drives the argument. Large igneous provinces (LIPs) are vast outpourings of lava, thought to be fed by 6, columns of hot rock rising from deep in the mantle. They are unlike any volcanism today, and they line up again and again with extinctions and sudden climate change. In the authors' picture, the same deep-Earth upheaval may have produced the plume-driven eruptions at the surface and the disrupted dynamo in the core, around the time life was collapsing. The Emeishan eruptions in southwest China are usually linked to the end-Guadalupian event, but the article doesn't name a specific LIP.
The proposed mechanism, and the doubts
There are two possible routes from a flipping field to dying species. The first is indirect. A common deep cause would drive both the reversals and the volcanism, and the volcanism would do the killing through its carbon and climate effects. The second is direct. The field may weaken during reversals, letting in more radiation. The authors write that this instability "may have amplified upper atmospheric ionization through increased flux of galactic cosmic rays and solar wind particles, potentially promoting ozone depletion, increasing atmospheric oxygen loss, and elevating ultraviolet radiation (UVR) on Earth's surface."
Gough notes that most scientists doubt the direct radiation route. It also isn't clear how much the shield actually weakens during a reversal. There is a broader problem too, which the article doesn't spell out. Most of the hundreds of reversals in the fossil record came and went without a mass extinction. A flip by itself is clearly not enough to kill off large numbers of species.
What this does and doesn't establish
The result is a precise, high-resolution record across a key boundary. The authors note that such paleomagnetic data from Permian transitions have been "sparse," so this fills a real gap. What it shows is a coincidence in time between extreme magnetic instability, giant eruptions, climate disruption and extinction.
It doesn't show which of these caused which, or whether the magnetic part did anything at all. Gough's verdict is that declaring causality would be too soon. The authors are measured too, saying only that geomagnetic instability "together with other global forcing factors... might have influenced" the late Permian crises.
Some questions remain open:
Is the 11-per-million-year rate seen in other sections around the world, or is it partly a local quirk of the Fengshan record?
How precisely do the dates of the reversals, eruptions and extinction pulses actually line up?
Can anyone find physical evidence in the rocks, such as signs of extra ultraviolet damage, that the radiation route ever worked?
Until those are answered, the link stays in the category the headline describes: a correlation that keeps turning up and keeps going unproven.
Remember
Reversals have no regular cycle: long calm spells alternate with bursts of rapid flipping, so the 450,000-year average predicts little.
The proposed link probably runs through deep-Earth upheaval that drove both core instability and extinction-linked volcanism.
The idea that a weakened field let in harmful radiation is contested, and most reversals caused no extinction.
People with blood cancers often get blood-forming stem cell transplants. Their immune systems are weakened for weeks, so they get many antibiotics and face a high risk of infection, including infections that start in the gut.
Image: Science News
A peer-reviewed study published September 30 in Nature found that blood cancer patients who ate more sugar while taking antibiotics lost more of their gut bacteria than patients who took the drugs without it. The sugar was also linked to the overgrowth of a bacterium tied to dangerous infections.
The problem
Antibiotics kill helpful gut microbes along with harmful ones, and earlier research suggested that sugary diets can also disturb the 1, the community of bacteria living in the intestines. No one knew what the two did together, especially in people already at high risk of infection. Diet studies are also hard to trust because they usually depend on people remembering and reporting what they ate. Tiffany Weir of Colorado State University, who was not involved, calls diet records "one of the biggest black boxes" in this field.
How the team measured it
Jonas Schluter's group at NYU Langone Health studied 173 people in hospital for 2. Because these patients ate standardized hospital meals, the team could weigh food intake down to the gram across more than 9,000 meals. They then compared nutrient intake with 3, measured from stool samples.
What they found
For patients on antibiotics, every extra 100 grams of sugar (roughly 2.5 cans of Coke) eaten in the two days before a sample went with a 24 percent drop in bacterial diversity.
Sweets and sugary drinks during antibiotic treatment were linked to 4 of 5. These bacteria can be drug-resistant and are tied to infections that are hard to treat, longer hospital stays and higher death rates.
The patient data shows an association, not cause and effect. To test cause, the researchers gave mice a single dose of antibiotics on either a standard diet or a diet high in 6 (table sugar). Sugar made the post-antibiotic rise in Enterococcus worse.
Schluter's explanation is that bacteria that survive antibiotics get a head start, and simple sugars, which almost any microbe can use, help them dominate. He compares it to burning down a rainforest and then pouring petrol on the flames.
Caveats
The patients were severely ill and immunocompromised, so the findings may not apply to everyone who takes antibiotics. Sarah Berry of King's College London, who was not involved, says cutting sugar could be one way to support the gut during treatment, but more research is needed. Schluter wants clinical trials to test whether reducing sugar actually limits the damage.
On September 30, researchers reported in Nature that blood cancer patients who ate more sugar while on antibiotics lost more gut 1 than those who took the drugs alone. The sugar was also linked to 2 of 3, a bacterium tied to hard-to-treat infections. A mouse experiment pointed the same way. The study is peer-reviewed, but the human evidence is correlational and comes from a very specific group of patients.
The question nobody had answered
Two facts were already fairly well established. Antibiotics damage the 4, the community of bacteria in the intestines, because they kill helpful species along with harmful ones. Separately, there was evidence that sugary diets can disturb that community too. What was unclear is how the two interact, especially in people who are already vulnerable to infection.
That question is hard to study because diet data is usually poor. Most diet–microbiome research relies on people reporting what they ate, which is error-prone. "Diet records are one of the biggest black boxes in a lot of diet microbiome studies," says Tiffany Weir, a microbiologist at Colorado State University in Fort Collins, who was not involved in the work.
Why cancer patients made a useful test case
Jonas Schluter, a microbiologist at NYU Langone Health, and colleagues studied 173 people hospitalized for 5, a standard treatment for blood cancers such as leukemia and lymphoma. These patients take medications that can badly damage the microbiome, and their diets vary a lot. Schluter says this lets researchers watch dramatic gut changes "that we believe are also relevant in the healthy context."
The bigger advantage was measurement. Hospital meals are standardized, so the team could record intake over several days down to the gram, across more than 9,000 meals. They broke those meals into nutrients and compared intake with bacterial diversity measured in stool samples. Diversity reflects how many bacterial species are present and how evenly they are spread. A drop usually means a few species are taking over.
The results
The main number: among patients on antibiotics, every extra 100 grams of sugar eaten in the two days before a stool sample was associated with a 24 percent decrease in bacterial diversity. For scale, 100 grams is about 2.5 cans of Coke.
The second finding was about which bacteria filled the gap. Eating sweets and drinking sugary beverages during antibiotic treatment was associated with blooms of Enterococcus. These gut bacteria can be resistant to antibiotics, and they are linked to difficult infections, longer hospital stays and higher mortality. In transplant patients, whose immune systems are suppressed, a gut dominated by one such species is a real clinical worry.
From correlation toward cause
Observational data like this can't rule out other explanations. For example, sicker patients might both eat differently and get more antibiotics. So the team ran a controlled experiment in mice. Animals on a standard diet or a diet rich in 6 (table sugar) each got a single dose of antibiotics. Sugar made the rise in Enterococcus after the antibiotic dose worse. That supports a causal role for sugar in the bloom, at least in mice. The article does not say whether the mice also showed the drop in diversity.
The proposed mechanism
Schluter describes it as competition. "Some bacteria, sometimes, survive antibiotics, or perhaps more dangerously, they are resistant to [them]," he says. Antibiotics clear out many competitors. Simple sugars are what he calls the "universal resource for life," so feeding them to the gut hands the survivors an easy fuel supply and strengthens their dominance. His analogy: "It's almost like burning down the rainforest with a lot of fire, and then trying to extinguish the flames by putting in more petrol."
The article does not explain why simple sugars would favor Enterococcus in particular over other survivors. One plausible reading is that dietary sugar reaches the gut when the usual sugar-consuming species have been wiped out, but the article does not confirm this.
What it does and doesn't mean
Sarah Berry, a nutrition scientist at King's College London who was not involved, says reducing sugar intake "could be another way for patients to support their gut microbiome during antibiotic treatment." She also says more research is needed to know whether the findings apply to anyone taking antibiotics. The patients here were severely ill and immunocompromised, and they were taking many medications. Healthy people on a short course of antibiotics may respond differently.
Some limits are worth keeping in mind:
Association, not proof, in humans. The 24 percent figure comes from comparing intake with diversity, not from a trial that assigned diets.
A narrow population. Transplant patients are a useful natural experiment, but they are not typical.
Outcomes not shown. The article reports links to diversity and Enterococcus blooms, not evidence that cutting sugar reduced infections or deaths.
Schluter hopes follow-up studies and clinical trials will pin down the relationship between sugar, antibiotics and the microbiome. He is clear that antibiotics remain necessary: "You need to take antibiotics to fight infections, but you should also be aware that they have side effects to the microbiome. Now, we need to find strategies to mitigate this damage." Diet during treatment, which is cheap and easy to change, is one candidate. Whether it works is still to be tested.
Remember
Weighed hospital meals gave unusually reliable diet data, which most microbiome studies don't have because they depend on self-reports.
The human result is an association. The mouse experiment adds evidence that sugar drives the Enterococcus bloom.
No trial has yet shown that cutting sugar during antibiotics prevents infections or improves outcomes.
A before-after study compares the same people before and after a change. It can't rule out that something else changed at the same time. A randomized trial gives the change to some people and not others, and compares the two groups.
A gas burner's flame, the combustion that produces the nitrogen dioxide behind the asthma link.
Researchers in Cleveland replaced gas stoves with electric ones in homes where someone had asthma. A few months later, 85 participants with poorly controlled asthma filled in a symptom questionnaire. They reported improvement about two to three times larger than asthma medication typically produces. Those with the worst symptoms improved most, and people reported fewer emergency room and hospital visits and fewer missed days of work or school.
"We were really surprised at how large the benefit was," says Ashwini Sehgal of Case Western Reserve University, who led the project. The US 1 funded it.
Why the stove matters
A gas flame is hot enough to make nitrogen and oxygen in the air react, forming 2, a gas that irritates the airways. Frying or boiling on a gas burner can push NO2 near the stove to hundreds of 3. The EPA's one-hour limit for outdoor air is 100. NO2 is linked to more wheezing, coughing and asthma attacks, including in children. Electric stoves burn nothing and make no NO2.
One participant said her throat felt like it was closing whenever she cooked on gas, and the feeling went away after the switch.
Big caveats
The study was meant to follow 1,200 households for a year. The Trump administration ended the EPA grant program that paid for it, so only a small group remained. The improvement in that group was still statistically significant. But:
No comparison group. Everyone got a new stove, so the season or the attention of being studied could explain part of the change.
Self-reported symptoms. Nobody's lung function was measured.
Unclear publication status. The article doesn't say whether the work has been peer-reviewed, so treat it as preliminary.
Outside experts suggest next steps. Carrie Breton of the WashU Bursky School of Public Health wants lung tests before and after a swap. Sehgal proposes a 4: half the homes get a stove at once and half wait six months, so the two groups can be compared.
Short of a new stove
To test it yourself, Sehgal suggests cooking on a hot plate and toaster oven for a while. Laura Paulin, a pulmonologist at Dartmouth Health, recommends a range hood that vents outside or an open window, and a 5 air filter with a carbon insert, because the carbon is what traps the gas. She also suggests keeping children with asthma out of the kitchen while cooking.
If the results hold up, Sehgal argues, insurers should help pay for stove swaps.
The finding
A project in Cleveland replaced gas stoves with electric ones in households where at least one person had asthma. Ashwini Sehgal, a clinician who studies community health at Case Western Reserve University, led it with funding from the US 1. A few months after the swap, 85 participants with poorly controlled asthma filled in a symptom questionnaire. They reported symptoms improving by about two to three times as much as medication typically achieves.
"We were really surprised at how large the benefit was," Sehgal told Science News. People with the worst symptoms improved the most. Participants also said they went to the emergency room or hospital less often and missed less work or school.
The article doesn't say whether the work has been peer-reviewed or published, and it doesn't name the questionnaire. Treat the result as preliminary.
Why a stove could matter
When gas burns, the flame's heat makes nitrogen and oxygen in the kitchen air react and form 2. NO2 is a reddish-brown gas that irritates the lining of the airways. Heating, steaming or frying on a gas burner can push NO2 near the stove to hundreds of 3. For comparison, the EPA's one-hour standard for outdoor air is 100 parts per billion. There is no matching federal standard for indoor air, so the kitchen can routinely exceed what would count as a violation outside.
NO2 exposure is linked to worse asthma. Studies in children have tied it to more wheezing, coughing and asthma attacks. Electric resistance and 4 stoves don't burn anything, so they make no NO2.
The idea is simple: take the source of an airway irritant out of the home, and airways that are already inflamed should calm down. Medication works the other way round. Inhaled steroids and bronchodilators treat the airways' response while the exposure goes on. Seen that way, it's at least plausible that removing a daily trigger could beat a drug. This is an interpretation, not something the study tested.
Participants described what changed for them. One woman, 38, said her throat felt like it was closing whenever she cooked on gas, and the feeling went away after the switch. A 36-year-old man who had found it hard to walk uphill or play with his children called the difference "magical."
A study cut short
The project was designed to follow 1,200 households for 12 months. That scale would have allowed firmer conclusions, and perhaps a look at seasonal patterns. The money came from the EPA's 5, a program set up under the Biden administration. The Trump administration ended those grants early, which left far fewer participants. Even with 85 people, the improvement was statistically significant, according to the article.
How much to trust it
There are real limits, and the researchers quoted acknowledge several of them.
No control group. Everyone got a new stove, and the comparison is each person before and after. If symptoms usually ease between the survey seasons, or if people paid closer attention to their health because they were in a study, the stove would get the credit.
Self-report. The results come from questionnaires, not lung-function tests. People who know they've received a stove meant to help may expect, and so report, feeling better.
Carrie Breton, an environmental epidemiologist at the WashU Bursky School of Public Health in St. Louis, says the next step should be to measure lung function before and after a swap and to account for things like the season. Laura Paulin, a pulmonologist at Dartmouth Health, points out that "many things can trigger people's asthma." Sehgal proposes a randomized design: some households get an electric stove right away and others wait six months, so the two groups can be compared over the same period. Everyone still ends up with a stove.
What people can do now
Breton says whether to replace a stove "depends on how much you are struggling with your own illness." Sehgal suggests a cheap test: cook on an electric hot plate and a toaster oven for a while, leave the gas stove off, and see whether symptoms change.
For people who can't swap, Paulin recommends cutting NO2 exposure in other ways:
Use a range hood that vents outside, or open a window.
Run a 7 air filter with a carbon insert. The carbon is what captures NO2, because HEPA material alone traps particles, not gases.
Keep children with asthma out of the kitchen while the stove is on.
"It doesn't have to be an all-or-nothing thing," she says.
The open question
If a 8 confirms fewer emergency visits and hospital stays, Sehgal argues that health insurers "should consider paying for or subsidizing" stove swaps. Asthma hospitalizations are expensive, and a stove is a one-time cost. "If it truly works this well," Breton says, "it's got a bigger bang for your buck." That "if" is the important part. The size of the effect is striking enough to justify a proper trial, but not yet enough to settle the question.
Remember
Gas cooking can push NO2 in the kitchen to several times the EPA's outdoor one-hour limit.
With no control group and only self-reported symptoms, the large benefit has not been proven to come from the stove.
A carbon-insert air filter, venting outside, or a hot plate can cut exposure without replacing the stove.
Phobos, Mars's larger moon: a lumpy, cratered body about 26 kilometers long, and MMX's landing target.
The 1 launched its Martian Moons Exploration (MMX) probe on October 19. Over the next five years it is meant to orbit close to Mars's moon Phobos, drop a rover onto it, land itself, scoop up about 10 grams of surface material and deliver it to Earth in 2031. The main question it is chasing is how Mars's two small moons formed. That question has been open since astronomers discovered them in 1877.
So far, only the launch has happened. Everything below is the plan.
The plan
MMX takes about a year to reach Mars. It will then map Phobos, a lumpy rock about 26 km long, to pick a landing site. It will also watch the smaller moon, Deimos (about 16 km), from a distance. After landing, the spacecraft will collect 2, the powdery surface layer of rock ground down by impacts and by repeated heating and cooling. Then it takes off, flies past Deimos for a closer look and heads home.
The rover is named Idefix. France's space agency (3) and the German Aerospace Center (4) built it together. It has a mass of 24 kg and is about the size of a large shoebox. MMX will stop 40 to 100 meters above the surface and release it. Phobos's gravity is about a thousandth of Earth's, so the fall could take minutes and end at under walking speed. On Phobos, Idefix will weigh about 15 grams. It is built to flip itself upright and will photograph its own wheel tracks to learn how loose and coarse the soil is. If it drives, Phobos will be the smallest body a wheeled rover has ever explored.
Why the moons are a puzzle
Both moons look like asteroids in composition, and Mars sits next to the asteroid belt. But capturing a passing asteroid requires it to lose a lot of speed. That is easier if the asteroid is a 5, a pair of rocks orbiting each other: one stays and the other is flung away with the extra energy. The two moons orbit at very different heights, though, so capture would mean two separate events. Captured asteroids should also travel on stretched, tilted orbits. Both moons instead circle directly above the equator.
The other main idea is a giant impact on Mars that threw debris into orbit, the same way Earth's Moon probably formed. That fits the circular orbits and hints that the moons' chemistry resembles Mars. A newer version says one moon formed this way and a later impact broke it into the two we see now.
Phobos's low density suggests it is a 6, loose rock held together by its own weak gravity. Testing the returned sample in labs on Earth should show whether its material came from Mars or from an asteroid.
Three earlier missions aimed at Phobos all failed: the Soviet Phobos 1 and 2 and the Russian-Chinese Phobos-Grunt.
On October 19, the 1 launched its Martian Moons Exploration (MMX) spacecraft toward Mars. The plan is to study both of Mars's moons, Phobos and Deimos, land on Phobos with a small rover, and bring about 10 grams of Phobos's surface material back to Earth in 2031. The mission's main goal is to answer a basic question that has stayed open since the moons were found in 1877: where did they come from?
The launch is the only news so far. Arrival, landing and sample return are all still ahead. What follows is the mission plan and the scientific puzzle it targets, as laid out in a Scientific American column whose author is openly enthusiastic about the mission.
The flight plan
MMX will take about a year to reach Mars. Once there, it will enter an orbit around Mars that keeps it close to Phobos, a lumpy body about 26 km long. From that orbit it will map Phobos's shape and surface, scout for landing sites, and take occasional distant looks at Deimos, which is about 16 km long.
Once engineers on Earth pick a site, MMX will release a rover. Soon after, the main spacecraft will touch down itself. It will collect a sample of 2, the powdery surface layer made of rock ground down by meteorite impacts and by repeated heating and cooling. Then it will lift off, fly past Deimos for close-up observations and head home.
A rover that weighs as much as a few coins
The rover is called Idefix, after the dog in the French Asterix comics. France's space agency, the National Center for Space Studies (3), and the German Aerospace Center (4) built it together. It has a mass of about 24 kilograms and is roughly the size of a large shoebox. With its solar panels unfolded, it spans just over a meter.
The drop goes like this. MMX slows to a halt about 40 to 100 meters above Phobos and lets Idefix go. Phobos's gravity is only about a thousandth of Earth's, so the rover drifts down slowly. Even from that low height the fall could take several minutes, and it should hit the ground at under one meter per second, about walking pace.
Low gravity also makes driving hard. On Phobos, Idefix will weigh about 15 grams, roughly half the weight of a house sparrow on Earth. With so little weight pressing the wheels down, the rover gets very little grip. Its locomotion system is designed to flip it upright however it lands. If it works, Phobos will be the smallest body a wheeled rover has ever explored.
Idefix will measure surface temperature and mineral makeup. It will also photograph its own wheel tracks. How the tracks look shows how tightly the regolith grains stick together and how big they are, which matters both for science and for any future landers.
Three ideas about where the moons came from
Captured asteroids. Mars sits at the inner edge of the main asteroid belt, and both moons resemble common asteroids in composition. The problem is the physics of capture. A passing asteroid moves too fast to stay in orbit around Mars unless it sheds a lot of speed. One way to lose speed is to skim through the upper Martian atmosphere at exactly the right angle, but that takes a very lucky path.
Capture is easier if the asteroid is a 5: two rocks orbiting each other. As the pair swings past Mars, one rock can end up in orbit while the other is flung away, carrying off the extra energy. Here is a rough analogy: two skaters holding hands push apart, and one slows to a stop while the other speeds away. But the moons orbit at very different heights. Phobos is only about 6,000 km above the surface and Deimos a little over 20,000 km. That means capture would need two separate lucky events.
Capture also fits poorly with the orbits we see. Captured objects should start on stretched, elliptical orbits at random tilts, yet both moons follow nearly circular paths directly above Mars's equator. Drag from the atmosphere and 6 from Mars could round out an orbit over time, but that takes billions of years. It isn't clear enough time has passed for Deimos, which is farther out and so feels weaker tides, to settle into its current orbit.
Giant impact. A large impact on Mars could have thrown debris into orbit, and the debris could have gathered into moons. Earth's Moon probably formed this way, after a Mars-sized body struck the young Earth. There are hints that parts of the moons' composition resemble Mars. Material from such a debris disk would naturally end up in circular orbits around the equator. What this idea struggles with is why the two moons sit so far apart. One suggestion is that the impact made many moonlets and only these two survived.
One moon broken in two. A newer hypothesis says Mars once had a single moon, formed together with the planet or from a later impact, which another impact then shattered into today's pair. According to the column, this can explain both the circular equatorial orbits and the different orbital heights.
Why the sample is decisive
Phobos is less dense than solid rock would be, so it is probably at least partly a 7: many loose rocks held together only by their own gravity. Many small asteroids are built this way. The leading explanation is a collision strong enough to shatter a body but not strong enough to scatter the pieces for good, so they fall back together. If Phobos is a rubble pile, MMX's measurements should reveal how it has changed over time.
The 10-gram sample is how the competing ideas get tested. In Earth labs, scientists can compare its chemistry with Martian meteorites and with known asteroid types. A clear match to one or the other would favor impact or capture. The column doesn't go into which specific measurements would decide the question.
A history of failure
The Soviet Phobos 1 and Phobos 2 probes and the Russian-Chinese Phobos-Grunt mission were all dedicated attempts to reach Phobos, and all failed, each in a different way. Mars missions have failed often enough that people in the space community joke about a "Great Galactic Ghoul" that eats spacecraft. MMX has a year of cruise and a series of first-ever maneuvers ahead of it before any of these questions can be answered.
Remember
Phobos's gravity is so weak that the 24-kilogram Idefix rover will weigh about 15 grams there.
Capture fits the moons' asteroid-like composition but not their circular orbits directly above Mars's equator.
The Soviet Phobos 1 and 2 and Russian-Chinese Phobos-Grunt all failed; MMX is the next attempt.
Who was measured. The reported group had poorly controlled asthma. That is where improvement is easiest to see, and also where scores tend to drift back toward average on their own (statistical 6). The finding that the sickest improved most fits a real effect, but it also fits this artifact.
Short follow-up. Symptoms were measured a few months after the switch.