Today's science tests its own evidence, from brain measures that disagree and contested fossil blood to galaxy models, permafrost hazards and a planned AI brain.
Picked from 29 new articles across 10 sources · arrow keys for other days
Today in 30 seconds
30s left
Questionnaires, task ratings and amygdala activity share almost no individual variation in emotional reappraisal, a Nature study pooling 40 brain-imaging data sets finds. story 1 ↓
A study reports heme-related chemistry in 115-million-year-old Brazilian theropod bones, but a leading specialist says the supposed blood structures have the wrong shape and size. story 2 ↓
Hubble's oxygen inventory of 37 nearby dwarf galaxies finds more lost than simulations predict, suggesting supernova-driven winds expel heavy elements more effectively than assumed. story 3 ↓
Two Canadian landslides moved 22.5 million cubic meters of largely frozen earth, possibly after thawing from below primed by decades-old wildfires. story 4 ↓
Stanford's privately funded AI brain model plans 14,000 hours of scans across about 100 people over five years; nobody knows how much data is enough. story 5 ↓
1/5Ars Technica Science·
John Timmer
· Nov 2
Three standard measures of emotional reappraisal barely agree, large study finds
An international team compared three common ways of measuring people's ability to rethink upsetting events. Questionnaires, in-the-moment ratings and brain scans barely tracked each other, suggesting they aren't capturing the same thing.
Why it matters · It shows how a plausible, widely used measure can go unchallenged for years, and why claims that one brain region reveals a person's emotional capacity deserve skepticism.
Know this first
Context from the editor, not the article · 28 sec
1 · Why null results rarely appear
Journals favor clear positive findings, so studies reporting no effect often land in obscure outlets or stay unpublished. This skews the scientific record, making effects and methods look more dependable than they may be.
2 · How brain scans track activity
Functional MRI does not record neurons directly. It detects changes in blood oxygenation that follow neural activity. Signals are noisy and scanning is expensive, so individual studies have often been small, which makes subtle effects hard to detect reliably.
3 · Measures should converge
2/5Live Science· Kenna Hughes-Castleberry · Nov 2
Study claims oldest chemical traces of blood in 115-million-year-old dinosaur bones
Researchers report microscopic, blood-cell-like structures with traces of a key blood molecule in a Brazilian dinosaur's bones. If correct, this is the oldest chemical evidence of its kind, but at least one expert disputes the identification.
Why it matters · The dispute shows how scientists test claims about ancient biology, and how much proof it takes to call a mineral-coated microscopic shape a 115-million-year-old blood cell.
Know this first
Context from the editor, not the article · 30 sec
1 · Why old molecules are contested
Fossilization usually replaces organic material with minerals, and biological molecules degrade over time. Reports of original soft tissue and proteins in dinosaur bones, prominent since the 2000s, remain debated, so extraordinary preservation claims face close scrutiny.
2 · Not all blood cells match
Mature mammalian red blood cells lack nuclei and are typically concave discs. Those of birds and reptiles keep their nuclei, which usually creates a central bulge. Because birds are living dinosaurs, researchers expect dinosaur cells to follow the nonmammalian pattern.
3 · The contamination problem
3/5NASA· Nov 2
Hubble study finds dwarf galaxies have lost more oxygen than simulations predict
Astronomers tallied the oxygen in 37 nearby dwarf galaxies using Hubble and other telescopes. Much of what simulations predict is missing, which suggests supernova-driven winds blew it out more effectively than models assume.
Why it matters · Where galaxies keep or lose heavy elements shapes how they evolve and how intergalactic space gets enriched, so this result gives galaxy simulations a concrete observational test.
Know this first
Context from the editor, not the article · 27 sec
1 · Stars make heavy elements
The early universe was almost entirely hydrogen and helium. Heavier elements, which astronomers call metals, were mostly forged later in stars. Massive stars make much of the oxygen and release it when they explode as supernovae.
2 · Why small galaxies leak
A galaxy's gravity holds onto its gas. Dwarf galaxies have little mass and weak gravity, so energy from massive stars and supernovae can more easily drive gas, along with its heavy elements, out into space.
3 · Layers around a galaxy
Outside a galaxy's stars lies the circumgalactic medium, a diffuse halo of gas. Beyond that is the intergalactic medium, the thin material between galaxies. Ejected elements can end up in either place.
4/5Science News· Nikk Ogasa· Nov 2
Thawing from below may set off a new kind of giant landslide
Researchers studying two huge slides in northern Canada propose a new landslide type: fire and heat crack frozen ground, water seeps beneath it, and the whole frozen layer eventually breaks loose, decades later.
Why it matters · It suggests frozen slopes can fail suddenly from below, long after the fire that primed them, so surface observations alone may badly misjudge the danger in warming permafrost regions.
Know this first
Context from the editor, not the article · 23 sec
1 · What permafrost is
Permafrost is ground frozen for at least two consecutive years. Ice binds its soil and rock together, and a thin surface layer above it usually thaws each summer and refreezes each winter.
2 · How thawing slopes usually fail
Permafrost normally thaws from the top down. On slopes, that typically releases muddy slurry or shallow, slow-moving failures, rather than sending thick blocks of still-frozen ground long distances.
3 · Why fire affects frozen ground
Forest and thick organic soil insulate permafrost from summer heat. A wildfire strips that insulation away, so the ground beneath can absorb more warmth for years or decades afterward.
5/5The Transmitter· Natalia Mesa· Nov 2
Stanford launches privately funded project to build an AI model of the human brain
Stanford's Wu Tsai Neurosciences Institute will scan about 100 people for 14,000 hours to train an AI model that predicts brain activity. No results exist yet, and outside researchers question whether the approach will work.
Why it matters · It tests whether the AI recipe of massive data plus large models can work for neuroscience, and whether a model that predicts the brain also explains it.
Know this first
Context from the editor, not the article · 30 sec
1 · Foundation models
A foundation model is a large AI system trained on huge amounts of general data, then adapted to specific jobs. Language models such as those behind chatbots are the familiar example; brain versions learn from scans instead of text.
2 · Measuring a living brain
No noninvasive scanner is both sharp and fast. Functional MRI locates activity to about a millimeter but follows slow blood-flow changes. Magnetoencephalography reads the brain's magnetic fields within milliseconds but pinpoints their sources less precisely.
3 · Explained variance
Brain responses fluctuate across moments and stimuli. "Variance explained" is the share of that fluctuation a model accounts for. At 50%, about half of the variation in the measured signal remains unpredicted, whether from noise or from what the model misses.
When several tests claim to measure one trait, people who score high on one should tend to score high on the others. Psychologists call this convergent validity. Without it, the tests may be capturing different things.
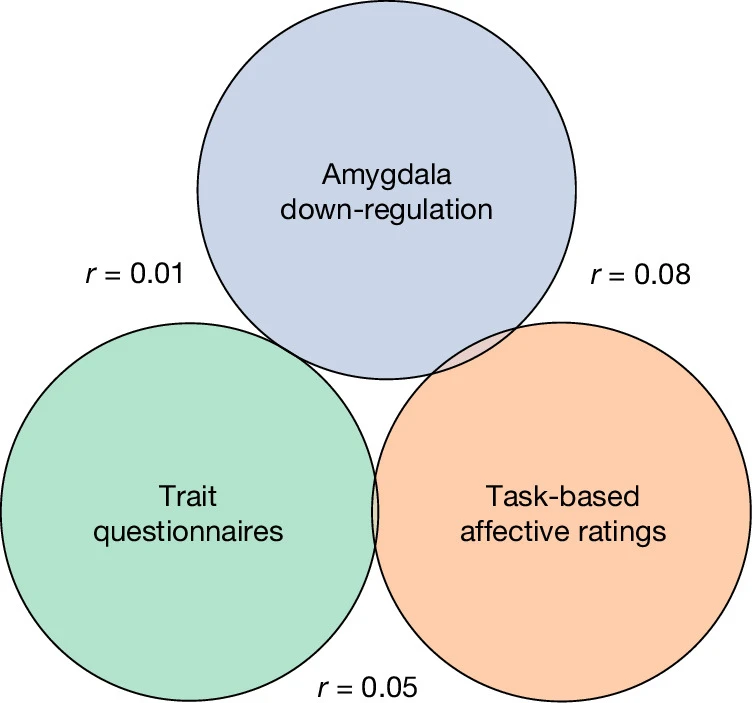
Three barely overlapping circles show how little person-to-person variation the three reappraisal measures share.
A large international team has published a study in Nature showing that three standard ways of measuring a key emotional ability hardly agree with one another. As Ars Technica's John Timmer notes, a result this close to negative rarely makes it into so prominent a journal.
The ability and its three yardsticks
1 (CBT), one of the most successful forms of talk therapy, relies partly on 2: rethinking a situation that upset you so that it has less impact. The ability has been linked to emotional resilience, so researchers want to measure it. They commonly use three methods, often assumed to reflect related aspects of the same capacity:
3, which ask about general, long-term tendencies.
Task-based ratings, in which people report how they feel after trying to reappraise something.
Amygdala down-regulation, a drop in activity in the 4, a deep brain structure that tends to be active during emotional responses.
What the data showed
The team examined 40 data sets from 5 (fMRI), which tracks brain activity through changes in blood oxygenation. The amygdala effect turned out to be small. Detecting it with 80 percent 6, meaning a four-in-five chance of finding an effect that really exists, would take 1,105 participants in a single study. Very few fMRI studies come close to that.
The bigger problem appeared when the team compared individuals. Almost none of the 7, the person-to-person differences in each measure, was shared across the three. In the paper's Venn diagram, the three circles barely overlap. Doing well on one measure said little about how someone would do on the others.
Brain areas responsible for high-level decision-making added another puzzle. Reappraisal should engage them, and more effort might be expected to accompany a quieter amygdala. Instead, activity in the two rose and fell together: a more active amygdala went with more activity in the reasoning areas.
Why they may disagree
The researchers argue this perhaps shouldn't be surprising. Questionnaires span long periods and probably reflect other traits besides emotional control. Task ratings and fMRI both capture the moment, but under very different conditions, since one requires lying in a scanner. Many fMRI experiments also simplify reappraisal to get consistent data, which could itself change brain activity.
What it does and doesn't mean
As described, the study examines how reappraisal is measured. It isn't reported as a test of whether CBT helps patients. Timmer's reading is that reappraisal may be real but current tools don't capture it clearly. The authors call for a "fundamental reassessment" and warn that strong claims about a person's emotional capacity based on any one brain region deserve "considerable caution."
The Ars article doesn't report the exact correlations or the total number of participants.
A large international collaboration has published a study in Nature with an unusual message: three of the standard ways of measuring a key emotional ability hardly agree with one another. As Ars Technica's John Timmer notes, it is rare for a result this close to negative to appear in so prominent a journal. Findings of no effect usually end up in low-profile journals or remain unpublished lab lore.
The ability being measured
1 (CBT), one of the most successful forms of talk therapy, relies in part on 2. This means thinking back over a situation that provoked a negative emotion and finding a way to reinterpret it so it has less impact. The ability to do this has been linked to emotional resilience, which has made it a popular research target. Many studies have looked at what the brain does during reappraisal, and several questionnaires aim to measure a person's capacity for it.
The team focused on three indices that, in their words, "are often assumed to reflect related facets of reappraisal capacity":
3, which ask about a person's general tendencies, covering a long stretch of their life.
Task-based affective ratings, in which people report how they feel after trying to reappraise something.
Amygdala down-regulation, meaning a drop in activity during reappraisal in the 4, a structure deep in the brain that tends to be active during emotional responses.
The logic of the third measure seems straightforward. If the amygdala is engaged by emotion, it should quiet down when someone tones that emotion down. But the amygdala is also active in a wide variety of other circumstances, so its activity is not a pure readout of feeling.
Why this is hard to test
Testing the brain measure requires 5 (fMRI), which tracks brain activity through changes in blood oxygenation, and fMRI studies are often small. The team therefore relied on 40 fMRI data sets, enough to reveal even relatively small effects.
That scale proved necessary. The researchers report that the amygdala effect was small: "To detect this effect size with a 6 of 80 percent, a single study would need to test 1,105 participants." Statistical power is the probability that a study detects an effect that really exists. At 80 percent power, about four in five studies of that size would find it. Very few fMRI studies come anywhere near that many subjects, the researchers note, so a typical single study has a limited chance of detecting the effect reliably.
The three measures don't line up
The more serious problem emerged when the team compared individuals. If all three measures captured one underlying capacity, a person with strong amygdala down-regulation should also tend to report good emotional control and show a larger drop in their task ratings.
Almost none of the 7, the person-to-person differences in each measure, was shared with the others. The paper's figure shows this as a Venn diagram of three circles that barely overlap.
Ars does not report the exact correlations, but the idea of shared variance is easy to illustrate. In this general example, not taken from the study, two measures correlating at 0.3 would share 9 percent of their variance, because shared variance is the correlation squared. The other 91 percent of the differences in each measure would have nothing to do with the other. Even a correlation that sounds respectable can leave two tests mostly independent.
A brain pattern running the wrong way
A second finding also cut against the standard picture. Reappraisal is effortful thinking, so the brain areas responsible for high-level decision-making should presumably be active while it happens, and more of that activity might be expected to go with a quieter amygdala.
The fMRI data showed something else. Activity in the amygdala and in the decision-making areas rose and fell together. When the amygdala was very active, implying a stronger emotional response, the reasoning areas were also more active. When the emotional response seemed subdued, they were less active as well. The article does not offer a settled explanation for this pattern.
The researchers concluded: "These findings call for a fundamental reassessment of how reappraisal capacity is measured and interpreted across behavioural and neural levels of analysis."
Why the mismatch may not be so surprising
The authors argue that, in hindsight, the disagreement should not come as a shock, because the three measures differ in basic ways.
Questionnaires ask about overall personality tendencies across a long period, and the answers probably involve traits beyond emotional control. Task ratings and fMRI both capture in-the-moment responses, but under very different conditions, since one of them requires lying inside an MRI tube. Many fMRI experiments also simplify the reappraisal process to get consistent data, and those simplifications could themselves shape brain activity in various ways.
What it does and doesn't show
Timmer's reading is that reappraisal may well be a real phenomenon, but that current tools do not capture it clearly. Progress may require new methods and clearer thinking about what each stage of the process demands.
The limits of the conclusion matter. As described, the study examines how reappraisal is measured. It is not reported as a test of whether CBT helps patients, and it should not be read as evidence that CBT fails. Its direct consequence is narrower, though still significant: we lack a good way to measure the impact of a concept central to a key therapy.
The authors' practical warning concerns brain-based claims in particular: "strong claims about a person's emotion regulation capacity based on any specific brain region should be made with considerable caution."
Several questions remain open. The Ars piece does not give the total number of participants or the exact correlations, and it does not say which measure, if any, best predicts how people cope in everyday life. That last question would determine which of these three yardsticks, if any, deserves the most trust.
Remember
Detecting the amygdala effect reliably would take 1,105 participants, a size very few fMRI studies reach.
Measures sharing a concept's name can still capture different things; convergence has to be tested, not assumed.
A brain marker that holds on average may say little about individuals, so single-region claims deserve caution.
Buried bones can be colonized by microbes long after death. A 2008 study argued that some vessel-like structures reported in dinosaur bone could be bacterial biofilms, so researchers must show that a signal came from the animal itself.
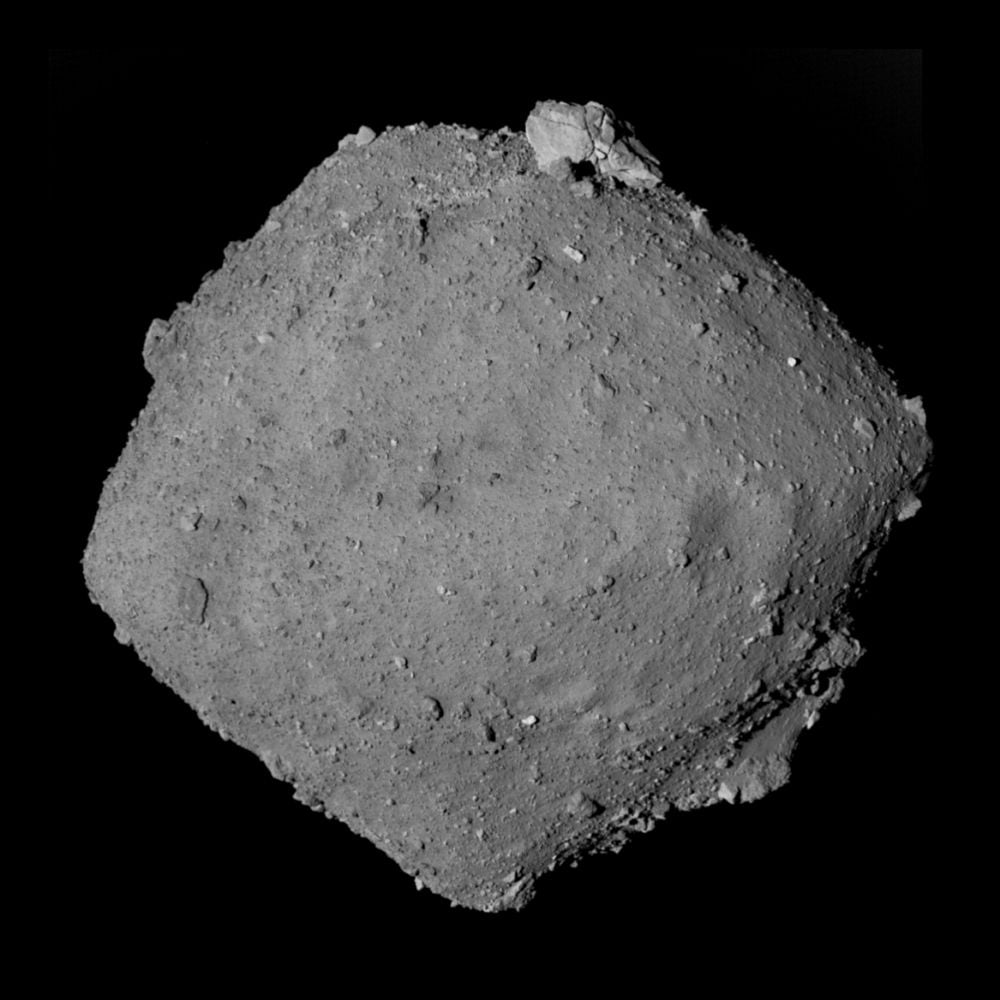
Artist's illustration of a microbial mat covering the dinosaur's bones, the burial setting the team proposes aided preservation.
A study published on Nov. 2 in 1, the Proceedings of the National Academy of Sciences, reports structures resembling red blood cells in the limb bones of a 115-million-year-old dinosaur from Brazil. The authors also detected chemical traces of 2, the iron-containing molecule in 3, which carries oxygen in the blood. Live Science calls this the oldest chemical evidence of blood-related material in a dinosaur fossil. The paper is peer-reviewed, but its central identification is disputed.
The case for blood
The fossil is Aratasaurus museunacionali, a 4, one of the mostly meat-eating, two-legged dinosaurs, about 10 feet (3 meters) long. The team wasn't hunting for blood. Co-author Kliti Grice of Curtin University in Australia says the broader question was how much of an animal's original biology can survive fossilization.
That is hard to establish, because molecules decay and buried bones can pick up material from their surroundings. The team's case combines three lines of evidence:
Location: the structures sit in 5, the channels that once held blood vessels in bone.
Form: their shape and size are, the team says, consistent with red blood cells.
Chemistry: heme-related compounds are associated with the structures.
The team measured the chemistry 6, in the bone itself, instead of extracting it from a sample. Grice argues this is much stronger because it ties each signal to a specific structure.
These aren't intact cells. The structures are mineralized with 7, a manganese oxide. The team thinks this early mineralization stabilized or copied them before they were destroyed. It proposes that rapid burial in low-oxygen sediment with 8, thin films of microorganisms, altered normal decay.
The objection
Mary Schweitzer, a molecular paleontologist at North Carolina State University who wasn't involved, praises the team's rigor and agrees that original molecules can persist in some form. She doubts these structures are red blood cells.
Nonmammalian red blood cells keep their nuclei, which typically creates a bulge. Schweitzer says these structures are concave, with no bulge, and smaller than most such cells. She also suggests that 9, a laser technique for characterizing compounds, would have been more conclusive. Her team used it in 2025 to detect heme in tissues from T. rex and a duck-billed dinosaur.
Where this leaves things
The chemical traces and the "blood cell" label are separate claims, and the second is the more contested. There is another gap: heme isn't unique to blood, since many microbes use it too, and the proposed burial setting included microbial mats. The Live Science report doesn't say how the authors excluded that source.
For now, "structures resembling red blood cells" is a fairer description than "red blood cells found."
A paper published on Nov. 2 in the journal 1, the Proceedings of the National Academy of Sciences, reports microscopic structures resembling red blood cells inside the limb bones of a 115-million-year-old dinosaur from Brazil. The authors also report chemical signatures of 2, the iron-containing, ring-shaped molecule at the working center of 3, which carries oxygen in red blood cells. Live Science describes this as the oldest chemical evidence of blood-related material in a dinosaur fossil. The work is peer-reviewed, but the central identification is disputed.
The question behind the study
The animal is Aratasaurus museunacionali, a 4 about 10 feet (3 meters) long from the Early Cretaceous. Theropods were mostly meat-eating, two-legged dinosaurs, the group that includes Tyrannosaurus rex and Velociraptor.
Blood was not the original target. Study co-author Kliti Grice, of the School of Earth and Planetary Sciences at Curtin University in Australia, says her research began with a broader question: how much of an organism's original biology can survive fossilization? Bones, teeth and shells record anatomy, but they say little about physiology. Grice argues that exceptional fossils may hold a second archive of microscopic structures and molecular traces, one that could answer questions anatomy can't.
Reading that archive is hard. Organic molecules break down over geological time, and a buried bone can pick up material from its surroundings, including microbes. A molecule found in a fossil therefore doesn't necessarily belong to the animal, and a round shape under a microscope isn't necessarily a cell.
How the team built its case
The argument rests on three lines of evidence that are meant to reinforce one another.
Location. The structures sit within 5, the channels that once carried blood vessels through bone. That is where blood cells would be expected.
Form. The team says the structures' shape and size are consistent with red blood cells. These are not soft, intact cells. According to Grice, they were mineralized with 6, a manganese oxide (Mn₃O₄). The team's interpretation is that early mineralization stabilized or copied the structures before they were destroyed, while some of the chemistry survived in altered form.
Chemistry. The analyses detected heme-related compounds associated with the structures. The fossil also held preserved amino acids associated with collagen, the structural protein in bone.
Grice emphasizes that the chemistry was studied 7, meaning in the bone itself, rather than being extracted from a ground-up sample. As an analogy, a fingerprint found on a particular door handle tells you more than the same print found somewhere in a bag of dust swept from the whole house. Measuring in place lets researchers tie a chemical signal to a specific structure, which Grice calls "much stronger" than assuming where extracted molecules came from.
The team also offers an explanation for the unusual preservation. It proposes that the carcass was rapidly covered by sediment in a low-oxygen setting containing 8, thin biofilms made of microorganisms. These conditions may have altered normal decomposition.
The objection
Mary Schweitzer, a molecular paleontologist at North Carolina State University who has long studied soft tissues from the dinosaur age and was not involved in the study, praises the team's rigor. She agrees that 9 molecules, those produced within the body, can persist in some form over geological time. But she is not convinced the structures are remnants of red blood cells.
Her objections are mainly about shape, size and proof:
Shape: Nonmammalian red blood cells keep their nuclei, which typically produces a bulge. Schweitzer says these structures are more concave, with no nuclear bulge.
Size: She says they are smaller than most nonmammalian red blood cells. Live Science does not report the measurements.
Standard of proof: She questions whether the criteria for identifying fossilized blood cells were adequately met, and suggests that 10 would have been more conclusive. This laser technique characterizes chemical compounds. Schweitzer was on a team that used it in 2025 to detect heme in tissues from and , a duck-billed dinosaur.
Her criticism targets the identification, not the wider approach. She says she is excited to see groups taking a molecular approach to ancient remains.
What is and isn't established
Two separate claims are easy to blur. One is that heme-related chemistry survives in these bones, in association with particular microstructures. The other is that those microstructures are the mineralized remains of the dinosaur's red blood cells. The second needs the first but goes further, and it is the one Schweitzer challenges most directly.
Some points are left open in the Live Science report:
Source of the heme signal. As a matter of general biology, heme isn't exclusive to blood, since many organisms, including many microbes, use it. That matters because the team's own burial scenario includes microbial mats. The report doesn't say how the authors ruled out a microbial source.
Claims of priority. The article calls this the first study to use chemical processes to identify heme-based signatures in dinosaur bones, yet it also cites the 2025 detection of heme in dinosaur tissues. It doesn't reconcile the two statements. The difference may lie in bone versus recovered tissue, or in method. The "oldest" claim is easier to read, since the dinosaurs in the 2025 work lived much later.
Independent testing. The report mentions no independent replication. Resonance Raman analysis of this material, as Schweitzer suggests, would be one direct test of the heme signal, though it would not settle what the structures are.
For now, the most defensible reading is that the study offers intriguing chemical evidence paired with a contested interpretation of the structures that contain it. Live Science's opening line says "red blood cells found," but the paper's claim is better read as "structures resembling red blood cells."
Remember
Being in the right place with the right chemistry doesn't settle identity; shape and size must fit too.
The structures are mineral-coated forms, with chemistry surviving in altered form, so nobody is claiming fresh, intact dinosaur blood.
Analyzing chemistry inside the bone links molecules to specific structures, which extracted samples cannot do.
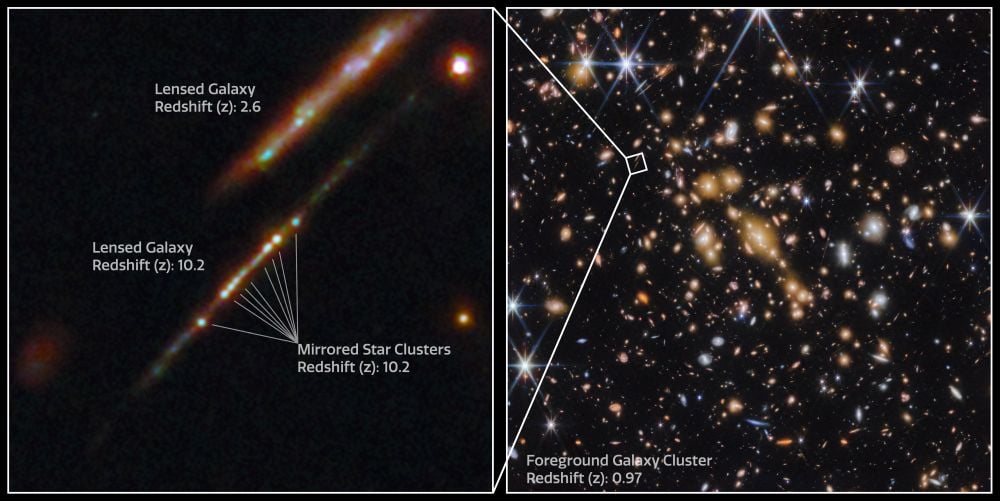
Hubble image of NGC 4449, one of the 37 dwarf galaxies in the GLOW oxygen study.
Astronomers have tallied the oxygen in 37 nearby 1, small systems with a few thousand to hundreds of millions of stars, and found much less than simulations predict. The peer-reviewed paper appeared Monday in The Astrophysical Journal. It comes from 2, a project funded by NASA and the National Science Foundation.
Tracking one element
Oxygen serves as a stand-in for heavy elements generally. It is the most abundant element after hydrogen and helium, it is relatively easy to measure, and its production is well understood. That last point carries the argument, as co-investigator Grace Telford of the University of Utah explains: stars make oxygen inside galaxies, so it must once have been there. If it's gone now, it must have been ejected, which takes energy from massive stars and supernova explosions.
How the audit works
Think of the study as an audit (our analogy, not the researchers'). A galaxy's 3 indicates how much oxygen it should have produced. The oxygen in its stars, gas and dust is what remains. The gap is what left.
The team used archival Hubble images to resolve individual stars and work out each galaxy's star-formation history and composition. It added data from the retired Spitzer Space Telescope and two ground-based radio arrays, the 4 and the 5.
The galaxies were chosen because their masses fall where theory predicts supernovae should expel a growing share of oxygen. They are also close enough for Hubble to pick out single stars, which is not true of most known dwarf galaxies.
What they found
Dwarf galaxies can hold onto only a small fraction of the oxygen their stars make. The team's reading is that 6, outflows of gas driven by supernovae, are apparently more effective at clearing out low-mass galaxies than current models predict.
This extends a 2014 study of star-forming galaxies like the Milky Way. That work found they too had lost a large fraction of their oxygen, some of it sitting in the 7, the diffuse halo of gas around a galaxy.
What's still unknown
Nobody yet knows where most of the missing oxygen went. It may sit in the halos of these dwarf galaxies, or it may have escaped into the 8, the space between galaxies.
NASA's release also gives no figure for how much oxygen is retained or how far simulations miss, and the ejection is inferred from the shortfall rather than watched directly.
Principal investigator Kristen Wingfield McQuinn plans to use the newly launched 9 to find even smaller galaxies, while Telford is using Hubble to study the massive stars that make the oxygen.
Astronomers have carried out an oxygen inventory of 37 nearby 1 and found much less than simulations predict. The peer-reviewed paper appeared Monday in The Astrophysical Journal. It comes from 2, a project funded by NASA and the National Science Foundation and led by Kristen Wingfield McQuinn of the Space Telescope Science Institute and Rutgers University.
Dwarf galaxies are small systems containing from a few thousand to hundreds of millions of stars. The team's interpretation is that the oxygen was made inside these galaxies and then expelled. If so, 3, outflows of gas powered by massive stars and supernovae, are apparently stripping low-mass galaxies more effectively than current models predict.
Why oxygen is the tracer
Stars produce a range of heavy elements, but following all of them is impractical. Oxygen stands in for the wider set. It is the most abundant element after hydrogen and helium, it is relatively easy to detect and measure, and its production is well understood. "It's really for practical reasons that we've chosen oxygen," McQuinn said.
The well-understood production matters most, because the study's logic depends on it. Co-investigator Grace Telford of the University of Utah lays out the reasoning: oxygen is produced by stars inside galaxies, so it must have been in those galaxies at some point. If it isn't there now, it must have been ejected. Doing that requires energy from massive stars and supernova explosions.
How you audit a galaxy
An analogy helps here, though it is ours rather than the researchers'. Think of the study as an audit. A galaxy's 4 works like its income records, indicating how much oxygen its stars should have made. The oxygen now in its stars, gas and dust is the balance on hand. Any gap between the two is money that left the account.
To build those records, the team used archival Hubble optical images to resolve individual stars and determine each galaxy's star-formation history and composition. Stars of different ages and compositions occupy different positions when plotted by color and brightness, which is how astronomers can reconstruct a galaxy's past from a census of its stars.
The team combined the Hubble data with observations from the retired Spitzer Space Telescope and two ground-based radio arrays, the 5 and the 6. NASA's release doesn't say what each instrument contributed. In general, though, Spitzer's infrared data can trace dust and stellar mass, and radio arrays commonly map a galaxy's hydrogen gas.
The sample was chosen with care on two counts:
Mass: the galaxies fall in the range where theory and simulations predict that an increasing share of their oxygen will be expelled by supernovae.
Distance: all are close enough for Hubble to resolve individual stars, which is not true of the vast majority of known dwarf galaxies.
The sample also spans a wide range of masses and environments.
What it adds to earlier work
Astronomers already suspected that galaxies shed a large fraction of their heavy elements. The open question has been where those elements end up. A 2014 study tackled this for star-forming galaxies like the Milky Way, finding that they had lost a large fraction of their oxygen. Some of it turned up in the 7, the diffuse halo of gas surrounding a galaxy outside its disk.
GLOW extends that accounting to low-mass galaxies. Its headline finding is that dwarf galaxies can hold onto only a small fraction of the oxygen their stars make, and that simulations predict significantly more should remain.
The result also bears on the 8, the space between galaxies. As McQuinn put it, tracing where oxygen goes helps show "where and how much galaxies are enriching" that space.
What remains open
The biggest gap is the destination. Other teams have measured oxygen in the circumgalactic medium of dwarf galaxies, but it is still unclear whether most of the missing oxygen sits in that halo or has left the galaxy's surroundings entirely. The result establishes a shortfall rather than a location.
Readers should also note the limits of the source. NASA's release gives no figure for the retained fraction or for the size of the gap between observation and simulation, so "small fraction" and "significantly more" can't be judged from it. The ejection is also an inference: the release describes a shortfall explained by winds, with "apparently" attached to the claim about their effectiveness, rather than direct observation of the oxygen leaving.
Follow-up work comes from two directions. McQuinn has an approved program on NASA's newly launched 9, a wide-field observatory, to find even fainter and smaller galaxies across a large stretch of sky. She then hopes to use Hubble and the James Webb Space Telescope to study their stars in depth and reconstruct how they formed stars across cosmic time.
Telford is working at the other end of the problem. She is using Hubble to examine individual massive stars in some of the nearby GLOW galaxies, to characterize how the stars that produce and eject oxygen differ in these small systems.
Remember
Oxygen works as a tracer because its production is well understood, making a shortfall meaningful rather than a measurement puzzle.
Choosing galaxies close enough to resolve single stars limits the sample, since most known dwarf galaxies are too distant.
A shortfall against simulations points to the models' treatment of winds, but NASA's release gives no size for the gap.
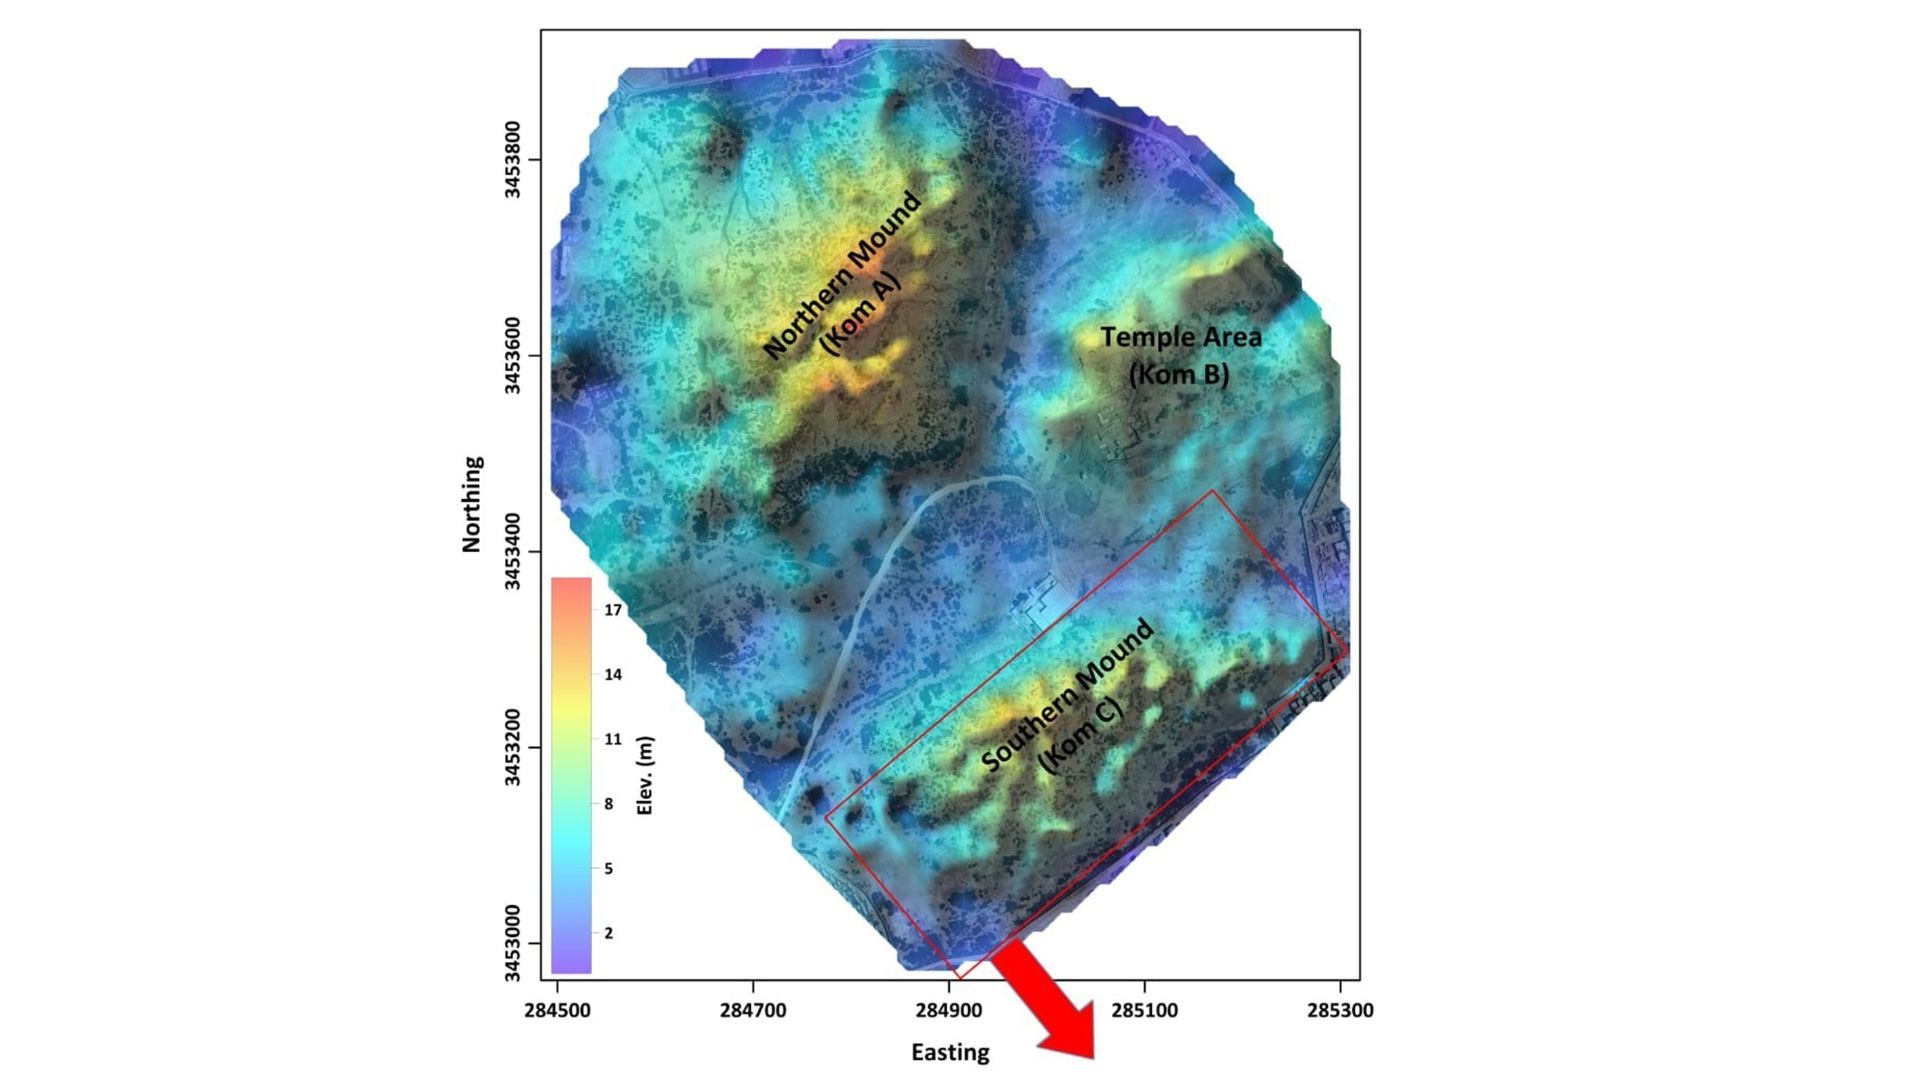
The 2018 slide's debris dammed Canada's Redstone River, creating a lake 3.5 kilometers long.1 / 2
Two giant landslides in Canada's Northwest Territories represent a new class of catastrophic failure, researchers report in the peer-reviewed journal 1. They call them 2: a thick frozen layer breaks loose along its base.
The puzzle
3 is ground frozen for at least two consecutive years. It normally thaws from the top down, releasing muddy slurry. Large slides rarely mobilize much still-frozen material, and those starting in thawing layers usually move slowly, says Dmitry Nicolsky, a University of Alaska Fairbanks geophysicist who wasn't involved.
But in 2019, permafrost geologist Joseph Young, then at the University of Alberta, flew over valleys where slopes were "just collapsing with landslides everywhere," in an area where the ground shouldn't have been thawing much. On foot, he found large blocks of still-frozen ground that seemed to have moved hundreds of meters.
Two slides under study
The team examined two of the largest such events. A 2018 slide moved 18 million cubic meters of earth, about seven Great Pyramids' worth, damming the Redstone River and creating a 3.5-kilometer-long lake. A 2017 slide moved 4.5 million cubic meters.
Both began on flat sliding surfaces about 20 meters down, at the base of the permafrost. Satellite records showed the ground had been moving by meters each year for decades, so the sudden collapses had a long prelude.
The proposed mechanism
To test whether fire and warming played a role, the team tracked ground temperature from 2020 to 2022 in undisturbed forest and in spots burned about 25 years earlier. They fed the data into simulations of how the ground evolves in the decades after a fire.
The researchers concluded that the sequence runs like this:
Wildfire and extreme summer heat warm and weaken the frozen surface.
The ground starts to 4 downslope, opening 5, which are fractures formed as the ground is pulled apart.
Water follows the growing cracks down until it gets beneath the permafrost.
Thawed from below, the whole frozen layer detaches.
What's still uncertain
The slides and their geometry are observed. The chain of causes is an inference from simulations and two years of temperature data, and nobody watched the water thaw the base as it happened.
Young says more than 150 other slides in the region, spotted by satellite, may be the same type, though these remain candidates. He expects the process wherever thin, warm permafrost meets a rapid warming event.
For Nicolsky, the lesson is that scientists must look below the surface: "it might go slowly or it might go catastrophically."
Researchers have proposed a new class of catastrophic landslide after studying two enormous slope failures in Canada's Northwest Territories. They call the events 1, in which a thick layer of still-frozen ground breaks away along its base. The study appeared in the Sept. 28 issue of 2, a peer-reviewed journal.
Their proposed explanation has a long fuse. A wildfire weakens the frozen surface, cracks form, and water works its way down over decades until it thaws the permafrost layer from underneath. The cause is an interpretation built on field data and simulations. The slides themselves are not in doubt.
A puzzle seen from a helicopter
The work began in 2019, when permafrost geologist Joseph Young, then at the University of Alberta in Edmonton, was flying to a field site to help a colleague. In some valleys, he recalls, slopes were "just collapsing with landslides everywhere." That surprised him because permafrost there, meaning ground frozen for at least two consecutive years, shouldn't have been thawing much.
The ground-level view was stranger. "Traditionally with permafrost, it melts from the top down, and that releases this slurry of muddy material," Young says. At some sites, though, large blocks of still-frozen ground appeared to have traveled hundreds of meters.
Dmitry Nicolsky, a University of Alaska Fairbanks permafrost geophysicist who wasn't involved in the study, explains why this stands out. Large landslides don't normally mobilize so much still-frozen material, he says, and those that begin in thawing layers usually move slowly.
Two slides, one geometry
Young and his colleagues focused on two of the largest slides that had moved big chunks of permafrost:
2018 slide: It mobilized 18 million cubic meters of earth, about seven Great Pyramids of Giza by volume. It dammed the Redstone River and created a lake 3.5 kilometers long.
2017 slide: It moved 4.5 million cubic meters of material.
Two lines of evidence shaped the team's thinking. In the field, both slides had started along flat sliding surfaces roughly 20 meters underground, where the team identified the base of the permafrost layer. That location points to the bottom of the frozen layer as the plane of failure, rather than the top, where thaw normally starts.
Satellite records added a second clue. The ground at both sites had been moving gradually, by meters each year, for decades. So the seemingly sudden collapses had a long prelude, even though the ground appeared to be locked in place.
How the team tested the idea
The researchers suspected that climate warming and wildfire were involved. To check, they installed instruments near the slides that tracked ground temperature from 2020 to 2022. Some spots sat in undisturbed forest, and others had burned about 25 years earlier.
That pairing works as a comparison. If the burned ground is thermally different from the intact ground, the difference gives a measure of what fire does. The team then fed the data into computer simulations to estimate how the ground would have evolved in the decades after a fire, a span the two-year record could not capture directly.
From those results, the researchers infer this sequence:
Wildfire and extreme summer temperatures warm and weaken the frozen surface.
The weakened ground starts to 3 downslope, which opens 4.
As the cracks grow, water penetrates deeper into the frozen ground.
The water eventually reaches beneath the permafrost layer and thaws it from below.
The entire frozen layer detaches and slides.
As a rough analogy of our own, picture a sheet of ice frozen to a tilted surface. Warming its top may soften it a little, but melting the bond underneath lets the whole sheet go at once. That may be why this failure can carry intact frozen blocks instead of muddy slurry: the upper part of the slab doesn't need to thaw for the slide to happen.
Where else it could happen
Satellite observations identified more than 150 other slides in the region that may also be permafrost detachment slides, Young says. He thinks the process could occur wherever a relatively thin, warm permafrost layer meets a rapid warming event. The thin layer matters in this picture because water has less frozen ground to get through, and warm permafrost has less margin before it thaws, though the article doesn't spell out that reasoning.
Nicolsky draws a practical lesson. Scientists need to study what's happening beneath the surface in permafrost regions, he says, because "we don't know how [the ground] will move — it might go slowly or it might go catastrophically."
Young also places the slides in a global context, since permafrost is thawing in cold regions around the world. "This is a direct reality of a changing climate," he says.
How firm is this?
The strongest parts of the study are the observations: the slide volumes, the depth and flatness of the sliding surfaces, the frozen blocks, and the decades of satellite-tracked movement.
The causal chain is less secure. Water thawing the permafrost from below wasn't watched as it happened. It's inferred from simulations informed by two years of temperature measurements at nearby sites, and the researchers' own language, as reported, is hedged: the fires "may" have set things in motion. The detailed case rests on two slides, and the 150-plus others are candidates that have not been shown to share this mechanism.
Several questions remain open in the article's account. It doesn't say how often this type of slide occurs outside this region, or whether fire is necessary or merely one possible trigger; Young refers more broadly to a "rapid warming event." It also doesn't report whether the decades of slow movement could serve as a warning. That prospect is an obvious one, given that satellites captured the motion, but it isn't something the article claims.
Remember
The slides failed about 20 meters down, at the permafrost's base, not at the surface where thaw normally begins.
A fire's effects may take decades to play out, so the trigger and the collapse can be widely separated in time.
Both slides were preceded by decades of satellite-visible movement, measured in meters per year, before catastrophic failure.
The wearable magnetoencephalography helmet, with hundreds of tiny sensors measuring the brain's magnetic field during tasks.
Stanford University's Wu Tsai Neurosciences Institute has announced the Stanford Digital Brain Project, which aims to build a "digital twin" of the human brain: an AI model that predicts how a brain will respond. The plan is to scan roughly 100 people for about 14,000 hours over five years, starting early next year.
This is a launch, not a result. No data exist yet. Private donors, including billionaire venture capitalist Mark Stevens and Mary Stevens, are funding it, and Stanford won't disclose the amount.
The plan
The model would be a 1, a large AI system trained on broad data and then adapted to specific uses. Existing examples such as Meta's 2 learned from scans of many people, but project member Dan Yamins says most large datasets lack enough information to model any one brain in detail. So Stanford will go deep on few people, gathering hundreds of hours per person, then adapt that model to others using far less data.
In the first of 10 data collection "campaigns," 10 people will be scanned about twice a week for a year with two complementary technologies:
3 tracks blood flow at roughly millimeter resolution but lags neural activity by several seconds.
4, a wearable helmet of tiny sensors, detects the brain's magnetic fields within milliseconds but locates their sources less precisely.
Participants will start with videos and simple decisions, then move to video games and virtual reality. The ultimate goal, says Stanford's Russell Poldrack, is predicting a person's response to treatments such as 5, which alters brain activity with magnetic pulses.
Meta launched a similar project in August, also called the Digital Brain Project, with $15 million toward 15,000 hours of scans.
The doubts
Nobody can say how much data is enough. Current models mimic only parts of the brain, such as the visual cortex, and predict about half the 6 in responses there, meaning half the variation goes unaccounted for. Columbia's Nikolaus Kriegeskorte, who works on Meta's project, expects whole-brain modeling to need much larger datasets than exist today.
Bing Wen Brunton of the University of Washington doubts the premise itself, since no one knows how brain models scale with data. "What's the evidence that this is going to work, besides that we're hoping it does?"
A model could also predict well without working like a brain. Checking that means altering the model and comparing the effects with similar interventions in people, and Brunton says those human tools lag behind. Yamins notes that models trained to perform human tasks often develop brain-like internals, so the team will combine that approach with training on brain data. He calls this his "personal bet."
The first test is modest. Caterina Gratton of the University of Illinois Urbana-Champaign frames it as: "Can we even make any digital brain that's a reasonable simulation of any one person at all?"
Stanford University's Wu Tsai Neurosciences Institute announced on November 2 that it is launching the Stanford Digital Brain Project, a large imaging effort meant to produce a "digital twin" of the human brain: an AI model that predicts how a brain will respond. The team aims to collect about 14,000 hours of scans from roughly 100 people over five years and to begin early next year.
This is a funding and launch announcement, not a result. No data have been collected and no model has been built. Billionaire venture capitalist Mark Stevens and his wife, Mary Stevens, are backing the work, with additional money from philanthropist Clara Wu Tsai. Stanford declined to say how much.
The bet
The model would be a 1, a large AI system trained on broad data and then adapted to specific uses. Dan Yamins, a Stanford psychologist and computer scientist involved in the project, describes the wager this way: trained on enough data, such models will accurately predict brain activity and generate hypotheses that can later be tested in people. Russell Poldrack, a Stanford psychology professor also involved, says the ultimate goal is to predict how a person will respond to a treatment such as 2, which uses magnetic pulses to alter activity in targeted brain regions, or 3, which uses sound waves for a similar purpose.
The analogy to language models only goes so far. Chatbots learned from internet-scale text, and no comparable supply of brain data exists. Yamins says the project will instead build on existing AI models that already predict some brain activity. Even so, he says, "our main activity is data collection."
Why more scans, and why these
Brain foundation models already exist, built from data on hand. 4 and 5 drew on thousands of hours of mostly 6 functional MRI, recorded while people lay in a scanner without a task, from tens of thousands of people. Meta's 7 used more than 1,000 hours of scans from 720 people watching movies, listening to podcasts and reading.
Those datasets are spread thinly across many people. Yamins says most large brain datasets don't carry enough information to build a detailed model of any single brain. Stanford is inverting the design: go deep on a few people, with hundreds of hours each, and then adapt the resulting model to other people using far less data. The headline figures alone work out to an average of about 140 hours per person (our arithmetic, not the project's), and the article doesn't explain how hours will be divided among participants.
The work is organized into 10 data collection "campaigns." In the first, 10 people will be scanned about twice a week for a year with each of two technologies:
8 (7T fMRI), a high-field scanner that tracks blood flow and oxygenation at roughly millimeter resolution. Because blood responds slowly, its signal lags neural activity by several seconds.
9, which uses a wearable helmet packed with hundreds of tiny sensors to detect the brain's magnetic fields on a millisecond timescale. It locates the sources of those fields less precisely.
Together they cover each other's weakness: one says where, the other says when. Participants will start by watching videos and making simple decisions, and later move on to video games and virtual reality tasks. The data will be shared through 10, a public repository for brain imaging datasets, and computation will run on Stanford's Marlowe 11. Almost a dozen Stanford researchers make up the team, and Yamins says the project is "very much looking for partners over time."
Stanford isn't alone. In August, Meta launched a project with the same name and, says Columbia University's Nikolaus Kriegeskorte, who is part of it, "the same general vision." Meta donated $15 million toward 15,000 hours of imaging. Nine research teams have been funded so far and initially plan to image at least 90 participants doing tasks that include interactive games.
How much data is enough?
Nobody knows. Kriegeskorte calls the question of whether either project will gather enough data "a very difficult question that I don't have a good answer to." Today's models mimic only portions of the brain, such as the visual cortex, and predict only about half the 12 in those regions. Whole-brain modeling, he says, will likely take much larger datasets than exist now.
Bing Wen Brunton, a University of Washington biologist, is more skeptical of the premise. She says she has "a lot of respect" for the team, but no one yet knows how brain models scale with data. "What's the evidence that this is going to work, besides that we're hoping it does?"
Prediction versus explanation
The deeper problem is that a good forecast isn't necessarily a good explanation. An analogy from astronomy (ours, not the article's): Ptolemy's system of nested circles predicted planetary positions well while getting the mechanism wrong. A model trained only on brain data could similarly predict well while its internal structure bears no resemblance to the brain's.
Testing for that resemblance takes intervention. Brunton says researchers must "poke at the inside" of a model and compare the effects with similar perturbations in people, and the tools for perturbing human brains lag behind those for measuring them.
Yamins points to a partial remedy. Computational models trained to perform the tasks people perform often do end up with brain-like internals. Well-known work on vision, for instance, found that networks trained to recognize objects develop layers whose activity resembles that of the visual cortex. The team plans to combine this task training with training on brain data. "My personal bet will be you'll end up with a lot of internal mechanisms that look similar," he says. That is a stated expectation, not a finding.
What would count as progress
The cohort is small and, as Caterina Gratton of the University of Illinois Urbana-Champaign notes, would ideally grow to better represent the population. She still sees value in the narrow test it allows: "Can we even make any digital brain that's a reasonable simulation of any one person at all?" If so, she says, "that already gives us a start."
The article doesn't say what accuracy would count as a reasonable simulation, or how the project will combine the two kinds of scans. Mariya Toneva of the Max Planck Institute for Software Systems, who isn't involved, says the project "is very needed," even with these questions unanswered.
Remember
Stanford's design trades breadth for depth: hundreds of scan hours per person, rather than brief scans of thousands.
Today's best models cover only parts of the brain and predict about half the variance there.
Validating brain-likeness requires perturbing human brains, and those tools lag behind the tools for measuring them.