Today's El Niño may be the strongest in about 900 years, and on the ground the fights are over who gets power, water and pipe money, and who pays.
Picked from 23 new articles across 13 sources · arrow keys for other days
Today in 30 seconds
30s left
This year's El Niño has a 91–95% chance of setting a record on the standard index. Tree rings suggest it's the strongest since about 1100. story 1 ↓
FERC rejected PJM's plan to connect data centers that agree to emergency power cuts. It said the plan intruded on states' control of retail rates. story 2 ↓
The UN carbon market now makes cookstove projects hold back at least 9% of wood credits against forest loss. It refused the industry's exemption request. story 3 ↓
California gas utilities must offer electrification cash instead of new pipe, when the cash costs less. Capped at 1% of customers, it expires in 2035. story 4 ↓
Corpus Christi's industry-funded desalination plant went from $140M to $1.2B as reservoirs fell below 20%. Refineries kept their drought-surcharge exemption. story 5 ↓
1/5The Climate Brink· Zeke Hausfather· Oct 12
This year's record El Niño is probably the strongest since about 1100
The 2026 El Niño already holds the thermometer record and is forecast to peak near 4°C. Zeke Hausfather checks it against tree-ring and coral records and finds it is probably the strongest in about 900 years.
Why it matters · El Niño drives year-to-year swings in global temperature, rainfall and crop and energy markets, and the proxy records suggest warming has made these events stronger.
Know this first
Context from the editor, not the article · 26 sec
1 · What Niño 3.4 measures
El Niño strength is usually tracked as the sea surface temperature anomaly in the Niño 3.4 box of the central-eastern equatorial Pacific. The Oceanic Niño Index (ONI) is its three-month average.
2 · Why use a relative index
The whole tropics are warming, so part of any Niño 3.4 anomaly is just background warming. NOAA's relative index (RONI) subtracts the tropical-mean warming to isolate the El Niño pattern itself.
3 · How proxies work
Thermometer records of the Pacific reach back only to about 1877. Before that, scientists rely on proxies: tree rings, whose growth follows El Niño-driven rainfall, and corals, whose annual bands record water temperature in their chemistry.
2/5Utility Dive· Ethan Howland· Oct 12
Federal regulators reject PJM's plan for connecting data centers to the grid
The Federal Energy Regulatory Commission rejected the core of PJM's plan to connect data centers without matching new power supply in exchange for cutting them first in emergencies. It ruled that states, not PJM, must set those rules.
Why it matters · Data center demand is the main reason power prices are rising in the largest US grid. This ruling leaves the question of who gets cut off first to individual states.
Know this first
Context from the editor, not the article · 28 sec
1 · What PJM is
PJM Interconnection runs the wholesale power market and transmission grid for 13 US states plus Washington, DC, serving about 65 million people. Northern Virginia, the world's largest data center cluster, sits inside it.
2 · PJM's capacity market
PJM holds auctions roughly three years ahead in which generators are paid to promise they will be available. Fast data center growth has pushed recent auction prices to record highs, and those costs end up on consumer bills.
3 · Who regulates what
Under the Federal Power Act, the Federal Energy Regulatory Commission (FERC) oversees wholesale power markets and interstate transmission. States regulate retail sales: the rates and service terms for homes, businesses and data centers that buy from utilities.
3/5Climate Home News· Matteo Civillini· Oct 12
UN carbon market makes cookstove projects insure against forest loss
The regulator of the Paris Agreement's carbon market has approved its first rules for cookstove credits. Projects must put aside part of their credits in case the forests they claim to save later burn or are logged.
Why it matters · Cookstove credits are among the most popular and most over-credited offsets, so how the UN market prices their risk sets a benchmark for the wider market.
Know this first
Context from the editor, not the article · 32 sec
1 · The Article 6.4 market
Article 6.4 of the 2015 Paris Agreement created a UN-run carbon crediting mechanism, the successor to the Kyoto-era Clean Development Mechanism. A Supervisory Body writes its rules, called methodologies, which set how each project type counts emission cuts.
2 · How cookstove credits work
Many households in poorer regions cook on wood or charcoal. A more efficient stove burns less fuel, so fewer trees are cut. Projects claim credits for the carbon kept in those trees, which makes them sensitive to how much wood savings are estimated.
3 · A sector under scrutiny
Independent researchers have found that cookstove credits often overstate their benefits, mostly by inflating how much fuel households used to burn and how much of it came from trees that would not regrow. This is why rules for the sector draw close attention.
4/5Canary Media· Alison F. Takemura· Oct 12
California makes gas utilities offer electrification cash instead of new lines
A new California law makes gas utilities that plan to replace a home's gas service pipe offer the household cash to switch to electric appliances instead. The cash must cost less than the new pipe.
Why it matters · It is the first statewide test of whether money that would have gone into new gas pipes can pay for electrification and lower costs for everyone else on the system.
Know this first
Context from the editor, not the article · 26 sec
1 · What a service line is
A gas service line is the short pipe that runs from the street's distribution main to one building. Utilities replace aging lines on safety schedules, often digging up yards to do it.
2 · How pipe costs get paid
Investor-owned utilities add capital spending to their "rate base". All customers then pay it back through their rates over decades, with a return to the utility. A household doesn't pay for its own new pipe directly.
3 · The stranded-asset worry
If buildings electrify, gas pipes built today may sit unused before they are paid off. The remaining gas customers would then carry those costs. California aims for a carbon-neutral economy by 2045.
5/5Inside Climate News· By Dylan Baddour, Neena Satija· Oct 12
Corpus Christi's industry-funded desalination plan nearly left the city without water
In 2018, Corpus Christi let refineries and chemical plants pay a small fee to avoid drought penalties, and the fee was meant to fund a seawater desalination plant. The plant was never built, and a drought nearly emptied the city's reservoirs.
Why it matters · The water supply for new industry is becoming a real limit on growth. This case shows how financing tied to that industry can leave the public carrying most of the cost and risk.
Know this first
Context from the editor, not the article · 29 sec
1 · Seawater desalination basics
Seawater desalination usually forces water through membranes (reverse osmosis). It takes a lot of energy and capital. It produces freshwater plus a concentrated brine that goes back to the sea. Its big advantage is that it doesn't depend on rainfall.
2 · Drought contingency plans
Texas water utilities keep drought contingency plans: staged restrictions that start when reservoirs fall below set levels. Surcharges are steep extra charges on water use. Their purpose is to force conservation, not to raise revenue.
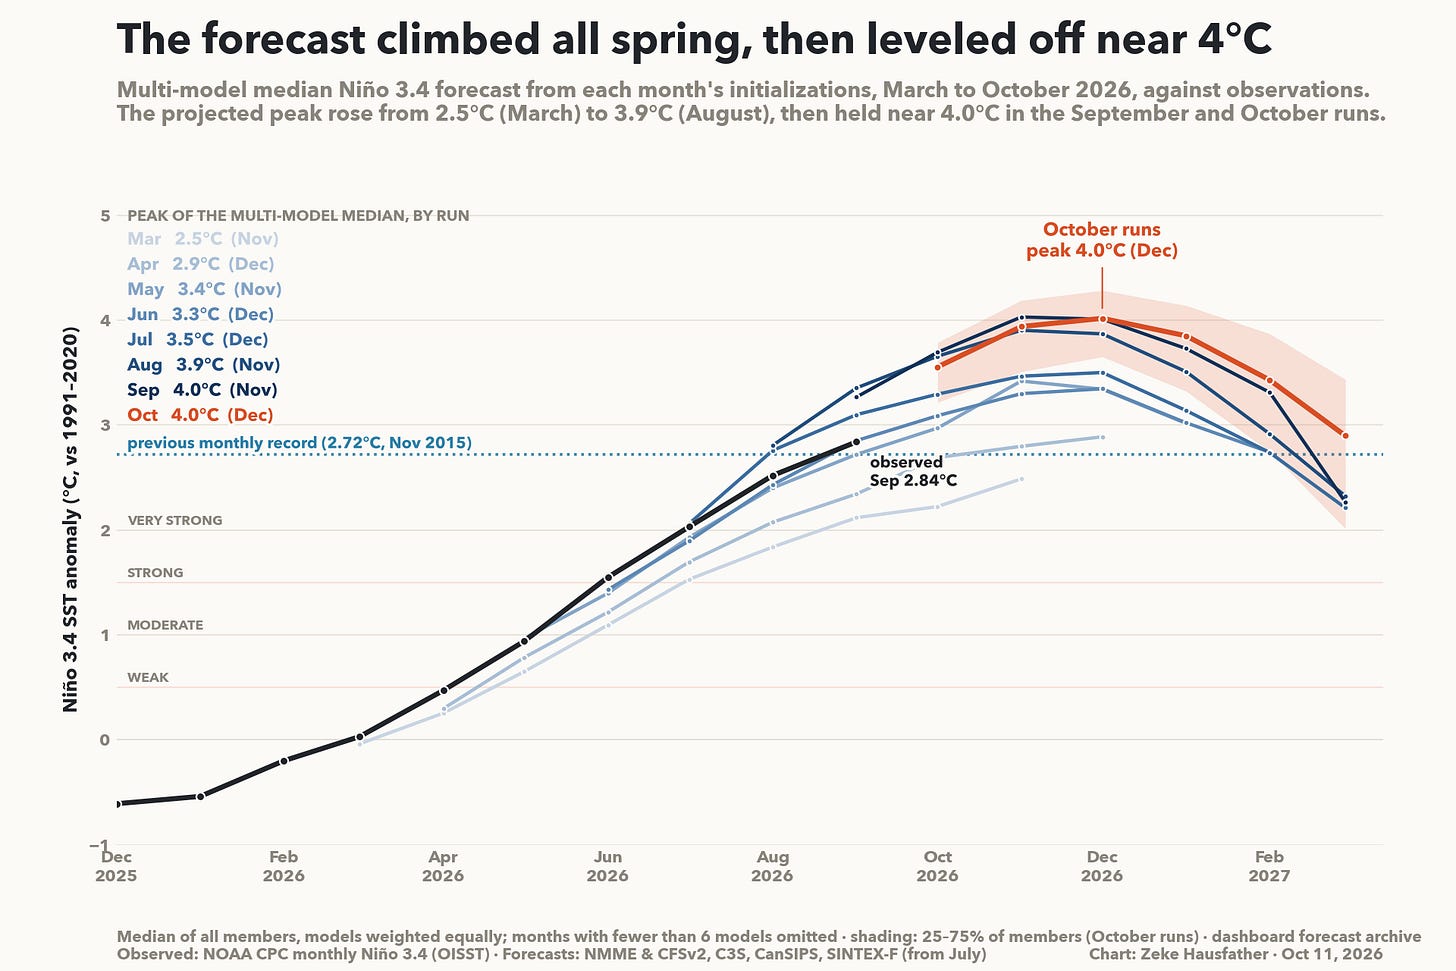
Monthly model forecasts against observed Niño 3.4 values, showing models first lagging, then overshooting, the event.1 / 2
The 2026 1, the warm phase of the Pacific's natural climate cycle, is already the strongest since reliable measurements began in 1877. Climate scientist Zeke Hausfather asks how it compares with the thousand years before that. His answer: if the forecasts hold, it is likely the strongest since about 1100.
Where the event stands
Scientists measure El Niño strength in the 2 region, a box of the equatorial Pacific. On September 20 the daily temperature anomaly there beat the previous record, set in November 2015. It has since reached 3.4°C. September also set the monthly record.
Fourteen seasonal forecast models put the peak near 4°C, with 80% of model runs between 3.3°C and 4.6°C. The models have been unreliable this year. They underestimated the event early on and have overestimated it for the past two months. Still, early October already ran above 3°C.
Tree rings back to 1100
Cook and Cane (2024) used 544 tree-ring records from places where El Niño changes rainfall. From them they reconstructed winter (December to February) Niño 3.4 temperatures back to 1100. Only 81 of those records reach that far back, and the early reconstruction has a typical error of about 0.6°C.
Before 1871, the largest winter the reconstruction shows is 2.1°C. The biggest winters in the thermometer era (1877–78, 1982–83, 1997–98 and 2015–16) measured 2.3–2.5°C. The forecast for this winter is 3.9°C. That is lower than the 4°C monthly peak because it averages three months.
Hausfather simulated the plausible true value of every winter before 1871, allowing for the reconstruction's errors. That gives a 91–95% chance that this winter beats every winter since 1100. On NOAA's relative index (3), which subtracts the general warming of the tropics, the chance falls to 60–72%.
Corals agree
A separate study by Cole and colleagues, published in Science in August, used 28 coral records from the Galápagos. Corals can't pin down the peak of a single event. They do show how much ocean temperature swung from year to year over 20-year windows. Before 1850, those swings were about 37% smaller than in recent decades, and the rise comes from stronger El Niños, not stronger 4. In climate models driven only by natural factors such as volcanoes and the sun, a jump this large comes up only about once in 100 cases.
Caveats
Both records are imperfect. Tree rings underestimated the 1877–78 event. The corals measure local Galápagos waters, not Niño 3.4, and leave about half the years unsampled. The ranking also depends on the forecast peak arriving. Hausfather judges a thousand-year record likely, not certain.
Earlier this summer Zeke Hausfather, a climate scientist who writes The Climate Brink, told a journalist that the 2026 1 might become the strongest in 500 or even 1,000 years. Readers asked how anyone could know what El Niño was doing in the year 1200. In this post he sets out the evidence. If the current forecasts are right, he concludes that the event is likely the strongest since about 1100.
The record so far
El Niño is the warm phase of a natural cycle in the tropical Pacific. Its strength is usually measured as the sea surface temperature anomaly in the 2 region, a box in the central-eastern equatorial Pacific. On that measure, 2026 already holds the instrumental record, which runs back to 1877. The daily anomaly passed the previous record, set in November 2015, on September 20. It has since reached 3.4°C, and September as a whole was the highest month on record.
The event is still growing. The latest runs from 14 seasonal forecast models put the peak around 4°C, with 80% of model runs between 3.3°C and 4.6°C. Hausfather notes that the models have not been steady. They underestimated the event earlier in the year and overestimated it over the past two months. With the first week of October already above 3°C, the October forecast of 3.6°C looks plausible, but different modelling groups still give a wide range of outcomes.
Written records: suggestive but coarse
Before thermometers, there are written sources. Quinn et al. (1987) compiled El Niño events off Peru back to 1525 from ship logs, mission records and chronicles. Gergis and Fowler (2008) combined these with tree-ring, coral and ice-core data into a chronology covering the same span. Five of the nine events in their most extreme tier fall in the 20th century. But these chronologies sort events into broad classes and miss a lot. They rate the huge 1997–98 event as only "weak", for example. Hausfather treats them as modest evidence and leans on two longer, quantitative records.
Tree rings back to 1100
Cook and Cane (2024) used 544 tree-ring chronologies from regions where El Niño changes rainfall, and so tree growth. From them they reconstructed winter (December–February) Niño 3.4 temperatures from 1100 to 2000. The sample thins further back: only 81 chronologies reach the 1100s. Since 1500 the reconstruction tracks observed winters with a typical error of about 0.5°C. The version starting in 1100 is noisier, at about 0.6°C.
On this winter-average measure:
Largest reconstructed winter before 1871: 2.1°C (1746–47 in one version, 1791–92 in the other)
Forecast for winter 2026–27: 3.9°C, with 80% of model members between 2.9°C and 4.6°C
The winter forecast is lower than the roughly 4°C monthly peak because it averages three months.
A raw comparison of 3.9°C against 2.1°C ignores the fact that a proxy can miss the true value. Hausfather handles this directly. He compared the reconstruction with observed winters over 1871–1929, years held out from the reconstruction's calibration, to measure how far off it tends to be. For the version from 1500 the best fit had a slope of 0.92 and a residual error of 0.49°C. For the version from 1100 the figures were 0.75 and 0.64°C. He then resampled those test years to capture uncertainty in the fit itself. Next he generated a plausible "true" value for every winter before 1871 and recorded the largest. He repeated the whole process 20,000 times.
Think of it this way (an illustration, not his exact method): each old winter gets a cloud of possible true values centred near its reconstructed number. The question is how often any of those clouds reaches past this year's forecast.
The results:
Since 1100: 91–95% chance this winter beats them all on the standard index (the Oceanic Niño Index, or 3, a three-month average of Niño 3.4). On 4, NOAA's relative index, the chance is 60–72%. RONI subtracts the warming of the wider tropics, so it isolates the El Niño pattern from background warming.
Since 1500, where the reconstruction is better: 94–98% (ONI) and 69–85% (RONI).
The gap between the two indices matters. A good share of the record on the standard index comes from the warmer ocean that El Niño now sits on top of. Cook and Cane themselves note that El Niño peaks in recent decades are "generally higher than at any time since 1100."
What the Galápagos corals show
The second record came out in August. Julia Cole and colleagues published 28 coral records from five Galápagos islands in Science. The Galápagos lie in the eastern Pacific, where El Niño events, including this one, are centred. Corals lay down yearly bands whose chemistry (oxygen isotopes or strontium/calcium ratios) tracks water temperature. A fossil coral therefore works as a rough thermometer for the decades it was alive. The oldest grew around 1130, and together the corals cover about half the years of the past millennium.
Corals can't reliably give the peak of a single event. What they capture is how much temperatures swung year to year within 20-year windows. Through 1850 those swings stayed in a fairly narrow band. They began rising in the late 19th century, and corals that grew after 1984 sit mostly above the pre-industrial range. Pre-1850 variability was about 37% lower than in recent decades; put the other way, recent variability is roughly 60% higher. The increase comes from stronger El Niños, not stronger 5.
To test whether nature alone could produce this, the team used last-millennium runs from 12 climate models driven only by volcanoes, solar changes and orbital shifts, plus 6 with no changes at all. The modern increase came close to 1-in-100 odds in the control runs. Other proxy studies point the same way, including central Pacific corals (Grothe et al., 2020) and a seven-century tree-ring reconstruction (Li et al., 2013).
How much to trust it
Hausfather's key point is that the two records are about as independent as paleoclimate gets. Tree rings read El Niño's effect on rainfall over land. Corals read ocean temperature directly in the eastern Pacific. Both put recent El Niños at or near the top of everything since the 1100s, and the 2026 forecast sits more than a degree above those.
The limits are real. Tree rings underestimated the 1877–78 event and carry errors above 0.5°C before 1500, though the odds calculation includes that error. The corals record decade-scale variability, not single peaks. They measure local Galápagos temperature rather than Niño 3.4, and they leave about half the years unsampled.
The whole ranking also depends on a forecast whose models have missed in both directions this year. If the peak falls toward the low end of the range, near 2.9°C for the winter average, the odds would shrink. The post does not work through that case. Hausfather's judgement is that a thousand-year record is likely if the forecast holds. The record within the modern era is already settled.
Remember
Before 1871, no tree-ring winter exceeds 2.1°C; this winter's forecast is 3.9°C.
On the warming-adjusted RONI index, the odds of a record since 1100 drop to 60–72%.
Galápagos corals show El Niño-driven variability is about 60% higher now than before 1850, an increase natural forcing rarely produces.
The 1, the federal agency that oversees wholesale power markets, on Friday rejected most of 2's plan for connecting data centers and other very large electricity users to its grid. PJM runs the grid and power markets for 13 states plus Washington, DC.
What PJM proposed
The core of the plan was the 3, or IRAS. Under it, a large load could connect without new generation being built to match its demand. In return, it would accept being 4, meaning forced to cut its power use, in the run-up to grid emergencies. PJM also proposed "bring your own new capacity" rules, which FERC rejected as well. The article doesn't describe how those rules would have worked.
Why FERC said no
FERC's objection was about jurisdiction. Most large loads buy power from utilities as retail customers, and states regulate retail service. FERC found that the IRAS 5 (the filed rulebook) appeared to:
place obligations directly on those retail customers,
dictate which retail customers get curtailed, and
set a retail rate through its compensation scheme.
FERC also said the plan appeared to discriminate against large loads. It approved two smaller pieces: PJM's definition of a "large load," and a registry recording each facility's location, ramp-up schedule and capacity supply.
FERC "strongly encourage[d]" states to decide which customers must be curtailed when the system is under stress. The ruling comes about five weeks after FERC rejected key parts of a separate PJM proposal, a backstop auction meant to fill an expected capacity shortfall.
A market-design problem
FERC Commissioner David Rosner raised a further objection. PJM wanted to leave IRAS loads out of the 6 in its 7, where generators are paid to promise future availability. Rosner warned that the market could then signal "more than enough capacity while the region sheds thousands of megawatts of demand on an involuntary basis." Prices would stay too low to attract new supply. Rosner argues that non-critical data centers should be cut before homes, hospitals and schools. In his view, states should set that order, and forced cuts should come only after voluntary 8 is used up. Demand response means customers who are paid to reduce their use.
Who benefits
Equity analysts at Jefferies expect capacity prices in PJM to stay higher for longer. That favors independent power producers that own existing plants, including Constellation, NRG, Talen and Vistra. They expect the idea to return in a smaller form, likely driven by the states, with Ohio and Pennsylvania as the ones to watch. PJM says it is reviewing the order. It wants to protect existing customers from higher costs or lower reliability caused by new energy-intensive users.
On Friday the 1, which regulates wholesale electricity markets and interstate transmission, rejected most of 2's package of rules for connecting data centers and other large loads. PJM runs the grid and wholesale markets across 13 states and Washington, DC. Its region has become the center of the US data center boom, and data center demand is the main reason its power prices have climbed.
FERC rejected the centerpiece, the 3 (IRAS). It also rejected proposed "bring your own new capacity" rules. It approved only the supporting pieces: a definition of what counts as a large load, and a registry of those loads.
The problem PJM was trying to solve
Resource adequacy means having enough generating capacity to meet peak demand with a safety margin. PJM secures it mainly through its capacity market, a set of auctions held roughly three years ahead that pay generators to commit to being available. When demand forecasts rise faster than new supply can be built, auction prices climb, and utilities pass those costs to every customer. Data centers can be planned and built faster than power plants, and they can request hundreds of megawatts at a single site. That creates a timing mismatch: either the new load waits, or it connects before matching supply exists and everyone else shares the strain.
IRAS was PJM's attempt at a middle path. A large load could connect without matching new capacity if it agreed to be 4 (forced to reduce consumption) in the lead-up to grid emergencies. In effect, the new load would be interruptible, which would protect existing customers' reliability while the supply side caught up.
Why FERC rejected it
FERC's main reason was jurisdiction. The Federal Power Act splits authority: FERC regulates wholesale sales, and states regulate retail sales, including the rates and service terms for customers who buy power from a utility. Most data centers are retail customers of their local utility. FERC found that the IRAS 5, the filed rules governing PJM's services, appeared to do three things that belong to the states:
Put obligations directly on eligible new large loads, "which are, for the most part, retail customers."
Dictate "which retail customers taking retail service will be curtailed."
Set up a compensation framework that "appears to establish a retail rate."
FERC added that the provisions appeared to discriminate unduly against large loads. It called the issue a shared federal-state challenge and said states have "a crucial role to play… by designating which retail customers must be curtailed when the system is stressed."
The ruling continues a pattern. About five weeks earlier, FERC rejected key elements of a separate PJM proposal for a backstop procurement auction to buy capacity to cover an expected shortfall. So FERC has now turned down two of PJM's main tools for the supply crunch in quick succession.
What survived
FERC approved PJM's definition of a large load and a large-load registry. The registry would record each facility's location, ramp schedule (how quickly its demand rises toward full load), capacity supply and other details. That gives PJM better data for planning, but it doesn't settle who pays for new supply or who gets cut first.
The market-signal problem
Commissioner David Rosner's concurring statement points to a flaw in the market design. PJM proposed to exclude IRAS loads from the 6 in its 7, the schedule that sets how much capacity PJM tries to buy at each price.
Here is an illustration with made-up numbers. Suppose the region needs 150 gigawatts of capacity, 10 GW of which are new interruptible data centers. If the auction only counts 140 GW of demand, it may clear at a modest price and report a comfortable surplus. When a hot week arrives, though, those 10 GW of data centers are still running until PJM forces them off. Rosner's phrase for this outcome is "a capacity market signaling that PJM has more than enough capacity while the region sheds thousands of megawatts of demand on an involuntary basis." Because prices never reflect the true shortage, investors get no signal to build, which Rosner says is "likely to prevent supply and demand from coming back into balance."
Rosner does support cutting large loads first in principle. He argues non-critical data centers should be curtailed before homes, hospitals and schools, but that state regulators should set those priorities and PJM should adapt its operations to them. He also says forced curtailment should come only after voluntary 8, meaning customers paid to cut use, has been exhausted.
Winners and next steps
Equity analysts at Jefferies wrote to clients that the ruling could mean higher capacity prices for longer in PJM. That is good news for 9, which own generation and sell into the market, such as Constellation Energy, NRG Energy, Talen Energy and Vistra. In their words, "the latest development is positive for existing generation/IPPs." Consumers get the mirror image: if large loads can't be connected as interruptible, more of the shortfall shows up in prices.
Jefferies expects the concept to be "minimally revived in future iterations and likely led by efforts from states." It named Ohio and Pennsylvania as the key states to watch. PJM spokesman Jeffrey Shields said the grid operator is reviewing the order. He said PJM wants to meet FERC's requirements while respecting state authority, and to ensure existing customers are not "unfairly burdened by new, energy intensive customers in the form of higher costs or decreased reliability."
What remains open
The article leaves several questions unanswered. It doesn't explain how the "bring your own new capacity" rules would have worked or exactly why FERC rejected them. It gives no figures on how many megawatts of large-load requests are queued, or on what this does to future auction prices. The structural problem is also unresolved. FERC has said states must decide who gets curtailed, but PJM's footprint covers 13 states plus DC. That raises the prospect of a patchwork of curtailment rules on a single interconnected grid, and it isn't clear how PJM would coordinate them.
Remember
FERC's objection was about jurisdiction: curtailing retail customers like data centers is a state decision, not PJM's.
Leaving interruptible loads out of auction demand could hide real shortages, so prices would never signal new building.
It's FERC's second rejection of a major PJM shortfall tool in about five weeks, which keeps capacity prices high.
The regulator of the Paris Agreement's carbon market, the 1, approved its first rules for cookstove credits last Friday. Cookstove projects must now set aside part of their credits as insurance in case the forests they claim to save are later lost. Credit developers, several conservation NGOs and the UN Environment Programme had lobbied for an exemption. The regulator rejected it.
The problem
A project that hands out efficient stoves to households cooking on wood or charcoal earns credits for the trees that would otherwise have been cut and burned. If those trees later burn in a wildfire, die in a drought or get logged, the carbon is released anyway and the credit's benefit disappears. Carbon markets call this "2".
The usual safeguard is a 3. Projects deposit a share of their credits in a shared reserve, and credits from it are cancelled to cover losses. It works like an insurance premium paid in credits.
The groups that opposed the rule argued that stove credits are a "flow" of avoided emissions, not a "stock" of stored carbon that can be released. They also said a buffer would add disproportionate costs. The regulator was not persuaded. The trees counted as saved can still be lost.
How the set-aside is calculated
There are two components:
Natural risks (fires, droughts, hurricanes): developers must use local risk values from new modelling by independent scientists, not values they pick themselves. They can propose alternatives, but expert reviewers must vet them and the regulator must approve them.
Human risks (logging, land clearing): a flat 20%, the low end of the 20–45% range the body's experts recommended. This can be cut by up to two-thirds if the host country has a forest-inclusive emissions plan, a long-term climate strategy and a framework for 4, the UN scheme that pays countries to cut deforestation.
According to a UN source, the minimum set-aside is 9% of wood-linked credits. That applies only in the lowest-risk areas, in countries that claim every discount. The share rises sharply in high-risk places such as Guyana, Sri Lanka and Timor-Leste.
Reactions and caveats
Carbon Market Watch called the method a "new paradigm" because it is based on real data, unlike the expert guesswork common in the voluntary market. Injy Johnstone of the Max Planck Institute says the policy discounts reward commitments on paper, not proven reductions in risk. She adds that the values need regular review as climate change makes fires and storms worse.
The regulator has asked its experts to revisit the values if credible new evidence emerges. The article does not say how the new rules handle the bigger, older problem with stove credits: inflated estimates of how much wood households would have burned.
The regulator of the Paris Agreement's UN carbon market, the 1, approved its first rulebooks for cookstove projects last Friday. The biggest decision in them is that projects must insure against the risk that the forests they claim to protect are later lost. A share of each project's credits goes into a "2" and cannot be sold. Credit developers, several conservation NGOs and the UN Environment Programme (UNEP) had lobbied for an exemption. The regulator turned them down.
Two 3
The rulebook has two methodologies, the formal rules for counting emission cuts:
Improved cookstoves: spreading stoves that burn less wood or charcoal.
Fuel switching: moving households to electric or liquid petroleum gas (4) cookers.
Cookstoves are one of the most popular types of carbon credit. They are also one of the most criticised for claiming more climate benefit than they deliver. Mkhuthazi Steleki, the South African who chairs the Supervisory Body, said the rules ensure "each credit represents a real and credible emission reduction".
Why permanence is a problem for stoves
An efficient-stove project earns credits for the carbon held in trees that would otherwise have been cut and burned as fuel. If those same trees later burn in a wildfire, die in a drought or get logged, the carbon reaches the atmosphere anyway and the credit's benefit disappears. Carbon markets call this "5".
Forest-protection projects already deal with this through buffer pools. Each project deposits a share of its credits into a shared reserve. When a reversal happens somewhere, credits from the reserve are cancelled to cover it. It works like an insurance premium paid in credits instead of cash.
The groups seeking an exemption, which critics called a "coordinated lobbying campaign", argued that cookstove credits are different. In their view a stove credit is a "flow" of avoided emissions, not a "stock" of stored carbon that can be released later. They also warned that a buffer would add disproportionate costs and threaten the projects' finances. The Supervisory Body did not accept the argument. The trees counted as saved are still standing carbon, and they can still be lost.
How the set-aside is calculated
The buffer contribution has two parts, one for natural risk and one for human risk.
Natural risks (wildfire, drought, hurricanes): developers must use local risk values from new modelling by a group of independent scientists, in a study backed by the mechanism's own experts. Industry groups and some corporate credit buyers wanted to pick values from other sources, such as national databases or their own estimates. The regulator said no, with one exception. Developers and host countries can propose alternative values, but the mechanism's expert panel must vet them and the regulator must approve them. An unnamed carbon market expert said they expect such requests will need solid scientific evidence, which makes unfounded claims less likely.
Backers say this data-driven approach is more rigorous than common practice in the 6, the separate private market where companies buy offsets, which mostly relies on expert guesswork. Federica Dossi of Carbon Market Watch, a Brussels advocacy group, called it "a new paradigm" and hopes voluntary-market registries will adopt it.
Human risks (logging, land clearing): projects apply a flat 20%. That is the bottom of the 20–45% range the body's technical experts recommended. The 20% can be cut by up to two-thirds if the host country has all three of the following:
a national emissions plan that covers forests
a long-term climate strategy
a framework for 7, the UN scheme that pays countries to reduce deforestation and forest degradation
What the numbers come to
A UN source told Climate Home News that the floor is 9% of credits linked to saved wood. That applies only to a project in the lowest-risk area, in a country that claims every discount. The full two-thirds cut takes the human-risk component from 20% to about 6.7%, so natural risk supplies the remainder in that best case.
An illustrative example (not from the article): a project that earns 10,000 wood-linked credits would deposit at least 900 in the buffer and could sell at most 9,100. The share rises "significantly" in places with high natural risk, such as Guyana, Sri Lanka and Timor-Leste, and in countries without REDD+ programmes. The article does not give figures for those cases.
Doubts about the policy discounts
Injy Johnstone, a senior research fellow at the Max Planck Institute in Munich, questions the discount for national policies. Plans, strategies and REDD+ frameworks are useful governance tools, she says, but having them on paper does not show that the risk of forest carbon loss has actually gone down. "It is important to distinguish between evidence of actual risk reduction and assumptions about the effectiveness of policy commitments."
This is a real weakness. A country can tick all three boxes and still lose forest quickly, and policies can change when governments change.
A moving target
The Supervisory Body asked its experts to recommend revising the risk values "should credible new evidence arise". Climate change is expected to make wildfires and hurricanes more frequent and severe in some regions, so today's natural-risk values may turn out too low. Johnstone argues that regular reassessment is essential. "The integrity of credits is not guaranteed simply because a reversal risk tool exists," she said. The test is whether the mechanism gives "equivalent atmospheric protection over time, rather than simply introducing another layer of accounting requirements".
What remains open
The article leaves several questions unanswered:
The other big error source. Cookstove over-crediting has mostly come from inflated estimates of fuel use and of how much harvested wood is non-renewable. The article does not say how the new methodologies handle that.
Fuel switching. It does not say whether the buffer applies the same way to LPG and electric projects.
Cost. Developers say the buffer threatens viability, but the article gives no evidence on how much it will actually cost them.
The buffer requirement addresses one weakness of stove credits. It is not a judgment on whether the rest of the accounting is sound.
Remember
Under the strictest-case discounts, human-caused risk drops from 20% to about 6.7%, which is why rewarding policies on paper draws criticism.
Natural-risk values must come from independent modelling. Developers can propose alternatives only through expert review.
Risk values may be revised as new evidence arrives, so set-asides could rise as climate change worsens fires and storms.
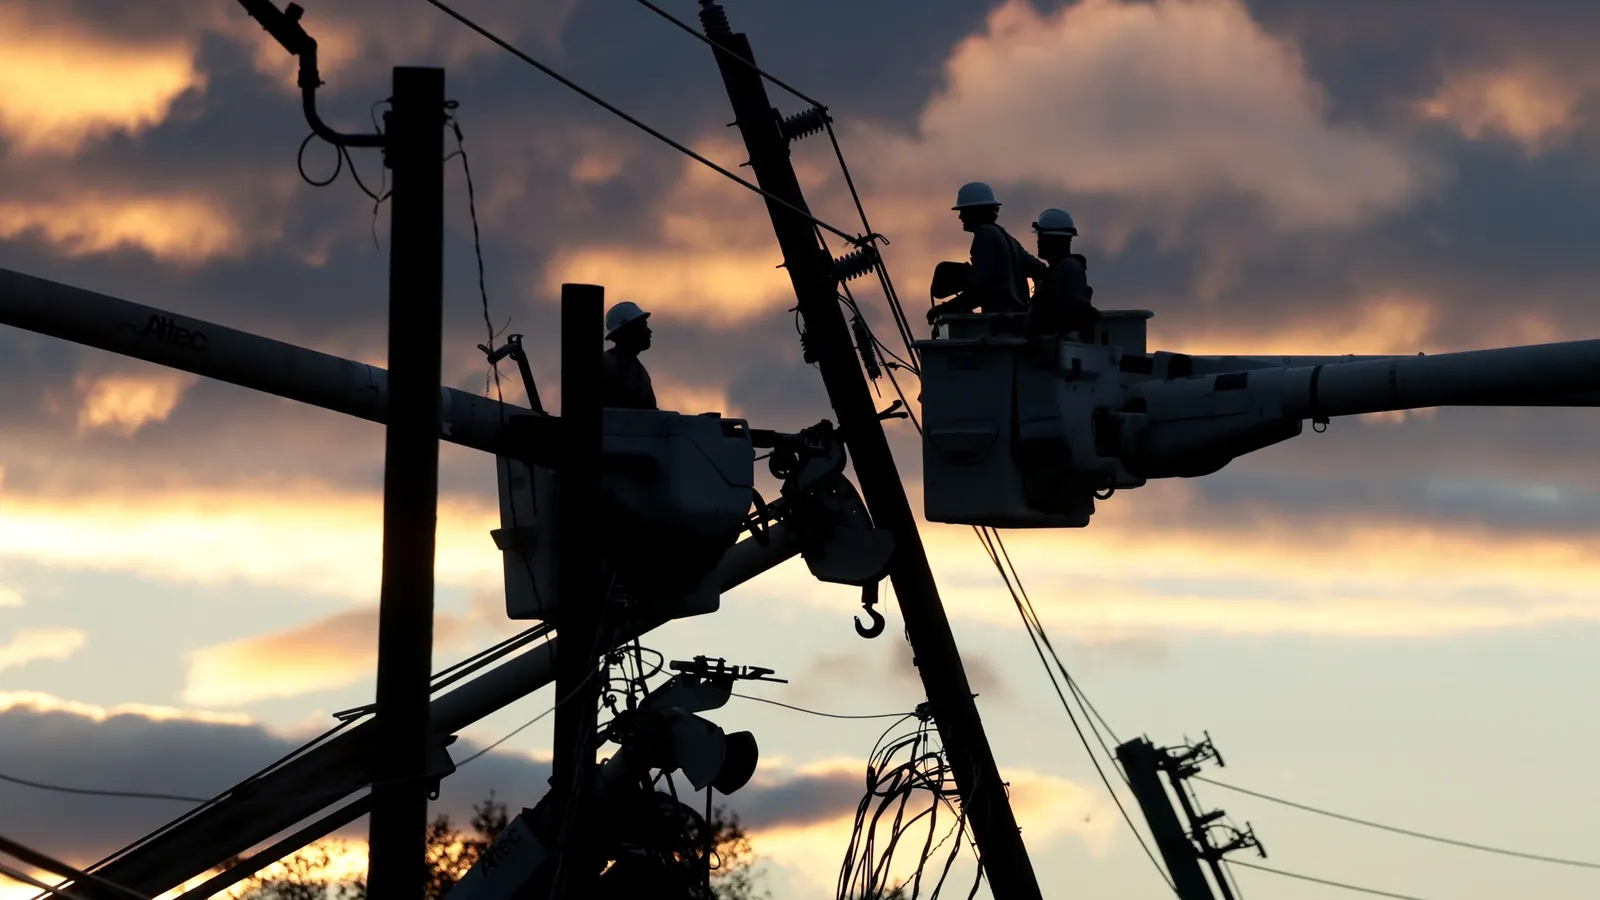
A PG&E crew replaces a gas service line in San Bruno, the kind of job the law targets.
California's new Home Energy Choice Act, Assembly Bill 2313, changes a routine gas-utility job. Before replacing the pipe that connects a home to the gas main (the "1"), a utility must offer the household a choice. It can take the new line, or it can take a cash incentive, potentially several thousand dollars, to switch to electric equipment such as 2, 3 stoves and heat-pump water heaters.
Why it exists
Merrian Borgeson of the Natural Resources Defense Council (4), an environmental nonprofit, explains the problem. Pacific Gas and Electric (PG&E) insisted on replacing the service line at her Berkeley home, even though she was about to remove her last gas appliance. In PG&E territory a replacement typically costs $20,000 to $30,000, plus interest and upkeep. Every gas customer pays it off over decades through their rates. Her new pipe now sits unused. "The customers all around me are paying for that pipeline for the next 50 years," she said.
How the trade works
The law requires the incentive to cost less than the line replacement it avoids. All gas customers share the difference. NRDC estimates that if PG&E gave 1,000 households $17,500 each instead of new lines, gas customers would save $20 million in total. PG&E replaces about 15,000 service lines a year.
The bill was weakened on its way to passage. Programs are capped at 1% of a utility's customers, and the law expires on January 1, 2035 unless it is renewed.
The objection
San Diego Gas and Electric and SoCalGas opposed the bill. They argued that as customers leave gas, those who remain pay more to keep the system running. NRDC's Kiki Velez accepts that this is a real long-term problem. She says this law is narrower: it only encourages people to leave when their leaving saves everyone money.
Where else
California is the third jurisdiction to adopt this approach, and the first statewide one. Con Edison in New York began offering up to $20,000 in 2024, and Colorado's regulator approved an Xcel Energy program in July. Velez says Illinois, Maryland, Minnesota, Oregon and Washington are considering similar bills.
What's still open
The California Public Utilities Commission, the state regulator, must now set incentive levels, with larger amounts for disadvantaged communities. Utility programs must be approved by January 1, 2028. How much warning households get is still undecided, and the risk is people hearing about the offer too late to act. 5, a clean-energy research group, recommends one to five years' notice. Real uptake is unknown so far. The $20 million figure is a model, not a result.
California has passed the Home Energy Choice Act, Assembly Bill 2313. It changes how gas utilities handle one routine job: replacing the pipe that connects a home to the gas main. Before a utility swaps out an aging 1, it must now offer the household a choice. The household can take the new line, or it can take a cash incentive, potentially worth several thousand dollars, to move to all-electric equipment and leave the gas system. That equipment includes 2 for space heating, 3 cooktops and heat-pump water heaters.
The problem, in one backyard
Canary Media's Alison F. Takemura opens with Merrian Borgeson, California policy director for climate and energy at the Natural Resources Defense Council (4), an environmental nonprofit. Pacific Gas and Electric (PG&E), one of the largest US investor-owned utilities, scheduled a replacement of the gas service line at her Berkeley home. Her only remaining gas appliance was a stove, and she planned to replace it with an induction model during a kitchen remodel and then have the gas shut off. She asked PG&E to skip the replacement. The utility said it couldn't wait and dug up her yard that week.
She wasn't billed directly. In PG&E territory a service line replacement typically costs $20,000 to $30,000, plus interest and operation and maintenance costs. All gas customers pay for it over the life of the pipe. A few years later the new pipe is unused. "The customers all around me are paying for that pipeline for the next 50 years," Borgeson said.
This is the core inefficiency. A utility's safety schedule doesn't know which homes are about to leave gas. Capital spending also earns investor-owned utilities a return, so they have little reason to ask.
How the law works
The mechanism is a trade. When a line is due for replacement, the utility offers an electrification incentive set below the cost of replacing the line. If the household accepts, the utility avoids the pipe. The difference between the avoided pipe cost and the incentive is a saving shared across all gas customers.
NRDC has run the numbers for PG&E. If 1,000 households each took a $17,500 incentive instead of a new line, gas customers would save $20 million in total. Our own arithmetic, not the article's: that implies about $37,500 of avoided cost per line once interest and upkeep over the pipe's life are counted, set against $17.5 million paid out. For scale, PG&E replaces about 15,000 service lines a year.
Assemblymember Marc Berman, the bill's author, frames it as avoiding investment in "fossil fuel infrastructure that will eventually become a 5". A stranded asset is equipment that stops earning its keep before it is paid off.
What got cut
Brandon García of Advanced Energy United, a clean-energy industry group, says the version that passed is less ambitious than the one introduced. Programs are capped at 1% of a utility's customers. The law expires on January 1, 2035, unless it is renewed. The article doesn't say how many households the 1% cap works out to for each utility, or whether it binds against the roughly 15,000 lines PG&E replaces each year.
The cost-shift objection
San Diego Gas and Electric and SoCalGas opposed the bill. Their argument is that as customers leave gas, the fixed costs of the system fall on fewer remaining customers, who are often the people least able to switch. Kiki Velez, NRDC's equitable gas transition lead, agrees this is a real statewide problem that needs solving. She argues this particular law is narrower: it encourages people to leave "at the exact time when they are saving money for everyone else by leaving." The two claims don't fully conflict. Each departure under this program saves money right away. Whether the gas network as a whole shrinks in an orderly way is a separate question that the law does not settle.
Not the first, but the first statewide
California is the third jurisdiction to approve this approach, and the first to do it statewide:
New York: Con Edison started its 6 in 2024. It offers eligible households up to $20,000 to electrify, and other New York utilities are following, according to Velez.
Colorado: In July, the state's Public Utilities Commission authorized Xcel Energy to run a similar program, which Velez expects within months.
Elsewhere: Velez says Illinois, Maryland, Minnesota, Oregon and Washington are considering similar bills.
What happens next, and what's open
The California Public Utilities Commission (CPUC), the state regulator, must first write a framework that sets incentive levels, with larger amounts for disadvantaged communities. Each utility's program must then be approved by January 1, 2028. So no household will see an offer for at least a year, and possibly longer.
Several details are still undecided:
Notice period. Borgeson's worst case is a household learning about the incentive only at the last minute, when there's no time to buy and install a heat pump. 7, a clean-energy research group, recommends utilities notify residents one to five years ahead, at the point they schedule the replacement.
Incentive size. Incentives have to be big enough to cover much of an all-electric retrofit and still small enough to come in under pipe costs. The CPUC will decide where that line falls.
Uptake. Neither the article nor the early programs offer evidence yet on how many households accept. The $20 million figure is a modeled scenario, not a result.
The economics are simple in principle: pay less than the pipe would cost and split the savings. Whether it works will depend on how the CPUC sets the details and on whether enough households hear about the offer early enough to act on it.
Remember
A single PG&E service-line replacement typically costs $20,000–30,000 before interest, paid by all gas customers for decades.
Programs are capped at 1% of each utility's customers and expire in 2035, so the near-term scale is limited.
No household gets an offer until utility programs are approved, with a deadline of January 1, 2028.
Since 2013, Texas has offered low-interest financing for public water projects through funds voters approved. Only public projects qualify. That rule is why private companies had a reason to have the city own the plant.
Corpus Christi's water sources, which grew with each drought, from local reservoirs to long pipelines.1 / 4
Corpus Christi, Texas' eighth-largest city, has spent at least $50 million on a seawater 1 plant that doesn't exist. This spring its reservoirs nearly ran dry. A joint investigation by Inside Climate News and The Texas Newsroom traces the problem to a 2018 deal with the region's refineries and chemical plants.
The deal
The city had already used up its nearby water sources: two reservoirs and pipelines to Lake Texana and the Colorado River. The shale boom meant industry wanted to expand. Today those plants use more water than all 500,000 residents of the surrounding 2 region.
Industry gave up on a private desalination plant because it was too expensive. A public plant, by contrast, qualified for cheap state loans. So the city changed its drought rules. Normally, when reservoirs run low, the city can impose 3, steep penalty rates meant to force conservation that can more than double industrial bills. Under the 2018 change, big industrial users could instead pay a fee of about 8 percent on their water bills all year. In return they were exempt from surcharges, and the fee would repay loans for the plant.
The cost spiral
2019: 10 million gallons a day, $140 million, fully covered by the fee.
2020: 20 million gallons a day, $220 million. The fee would cover two-thirds of the loan payments, and residents would pay the rest.
2024: three times the original size, $757 million. Debt service would be about $68 million a year, against about $6 million a year from the fee.
2025: the contractor's estimate was $1.2 billion.
Delays came from the pandemic, slow state permits, and frequent turnover in the city's elected leaders and water department.
The drought
Reservoirs fell below 20 percent. Residents lost lawn watering and car washing, but surcharges were never imposed, so industry was never asked to cut back. Officials debated pool hours that would save 20,000 gallons a day, while ExxonMobil's plastics plant uses 13.5 million gallons a day. In 2025 the council fired the contractor. It then approved more than $1 billion for seven other projects, mostly wells, and credit agencies downgraded the city's outlook.
Now
Heavy rain in July pushed reservoirs above 40 percent. In September the council rejected a new contractor's bid, even though quitting means repaying $235 million in state loans plus about $70 million in interest. In November, voters will decide on the 4, which would end industry's exemption. Every council seat is also on the ballot.
Industry spokesman Bob Paulison and Gov. Greg Abbott blame the city's foot-dragging. Activist Isabel Araiza blames industry's water use.
An investigation by Inside Climate News and The Texas Newsroom traces how Corpus Christi, Texas' eighth-largest city, nearly ran dry this spring. It also shows how a 2018 deal meant to make the city "drought proof" left residents with most of the bill for a 1 plant that still doesn't exist. The city has spent at least $50 million on the project. A November ballot measure would undo the deal.
Why Corpus Christi kept running short
The city sits on a semi-arid stretch of the South Texas coast and has spent four decades adding water sources. A 1984 drought forced a 25 percent cut in water use, which also hit the refineries. The city responded by building Choke Canyon reservoir. In the 1990s it built a 100-mile pipeline to Lake Texana, and after the 2010s drought it built another pipeline to the Colorado River. After that, the only large source not already claimed was the Gulf of Mexico.
At the same time, the shale boom was sending crude oil to the Port of Corpus Christi, the top U.S. port for crude exports. Refiners and chemical makers wanted to expand. Today large industrial users (OxyChem, Valero, Citgo, Flint Hills Resources and, since 2021, an ExxonMobil plastics plant) use more water than all 500,000 residents of the seven-county 2 region combined. Exxon's plant alone uses 13.5 million gallons a day.
How the deal worked
Starting in 2014, the industrial users considered building a private desalination plant for their own use. By 2016 they had concluded it was too expensive, partly because they would have had to build their own pipe network. A public plant could use the city's pipes and qualify for cheap state loans. Bob Paulison, who coordinated the industry group, told the council that "public ownership offers significant cost savings."
The financing they settled on in 2018 changed the city's 3. Normally, when reservoirs fall low enough, the city can impose 4, which could more than double rates for big users. Under the amendment, large industrial users could pay a "5" instead: an immediate rate increase of about 8 percent, paid all the time. In return they would be exempt from the surcharges. The fee money would repay loans for the desalination plant. The council approved it unanimously.
In effect, the companies paid a small premium in normal years in exchange for protection from rationing in bad ones. The model only works if the plant is built before the next drought.
How the price kept growing
2019: a plant producing 10 million gallons a day in the Inner Harbor, for $140 million. The fee would cover the loan payments, and the plant was due by early 2023, when Exxon's plant would raise demand.
February 2020: the target became 20 million gallons a day for $220 million. City staff said the fee would now cover only two-thirds of loan payments, with residential ratepayers paying the rest. The council applied for a $222 million state loan. Council member Gil Hernandez cast the only vote against, saying alternatives hadn't been compared.
Delays added to the cost: the pandemic, state environmental regulators who had not issued permits by 2022, and constant turnover. The mayor and council face election every two years, and the water department changed leaders several times. Paulison says the companies were less involved after the plan grew, and he doesn't know why it was enlarged.
The drought
The worst drought in the city's history began around 2021. Reservoirs fell toward 30 percent, the level at which surcharges could start. A draft presentation from water chief Mike Murphy in January 2023 suggested putting surcharges on large users. That idea was missing from the slides he actually showed the council. Reservoirs later fell below 20 percent. Residents faced bans on lawn watering and car washing, but the city never imposed surcharges. Critics pointed out that surcharging only residents would save little water while industry was exempt. Last summer officials debated cutting hours at public pools, which together use about 20,000 gallons a day. That is less than 0.2 percent of what Exxon's plant uses.
In September 2025, a council now dominated by skeptics fired the plant's contractor. It approved more than $1 billion for seven other projects, mostly groundwater wells, and some wells were drilled before permits were in hand. Credit agencies lowered their outlooks for the city because of the risk of running out of water. Industry, schools and hospitals sought permits for emergency wells.
Where it stands
Heavy rain in July 2026 sent more water down the Nueces River than flows over Niagara Falls for three days, and reservoirs rose past 40 percent. In September 2026 the council rejected a new contractor's slightly cheaper bid. Walking away still costs money: the city would have to repay $235 million in state loans, $50 million of it already spent, plus about $70 million in interest.
Activist Isabel Araiza's group gathered nearly 13,000 signatures to put the 7 on the November ballot. It would repeal the exemption and sharply raise what industry pays during droughts. Every council seat is also up for election.
Who is to blame
The two sides tell different stories. Paulison argues the companies provided funding and the city "kept dragging your feet." Gov. Greg Abbott says city leaders "squandered" state loans. Former mayor Joe McComb warns that the ballot measure could turn the city back into "a fishing village." Araiza argues industry's water use caused the crisis. The reporters' records show industry helped design the plan that failed. City manager Peter Zanoni wants federal funding and oversight.
What the story leaves open
The article doesn't compare the cost per gallon of groundwater wells and desalination. It doesn't say how much water the new wells can reliably supply, or how big the brine impact on Corpus Christi Bay would be. Nor does it say whether a fee sized for a 10-million-gallon plant could ever have paid for the supply that industrial growth required. The basic flaw is clear, though. The exemption gave industry protection from rationing right away, while the water meant to back that promise was years away.
Remember
Paying for supply with a rationing exemption gives industry protection right away, but the water behind it was years away.
As the plant grew from 10 to 30 million gallons a day, the fee's share of costs fell from 100% to under 10%.
Abandoning the project now means repaying about $305 million in state loans and interest.
January 2024: the plan was now three times the original size, and inflation pushed the estimate to $757 million. Annual 6 would be about $68 million, while the fee brought in about $6 million a year. The city applied for another $535 million state loan.