A Shaky Speed-Up and an 8.7-Second Well · Morning Gist
Tuesday, October 205 stories · 16 min
A Shaky Speed-Up and an 8.7-Second Well
A claim that warming has doubled gets a statistics check, seafloor geothermal makes its first seconds of power, and data centers keep reshaping how grids find supply.
Picked from 26 new articles across 13 sources · arrow keys for other days
Today in 30 seconds
30s left
Zeke Hausfather says a paper claiming warming doubled uses a test that flags false speed-ups in 22–34% of steady-warming simulations, not 5%. story 1 ↓
Endurance Energy drilled the first seafloor geothermal well, reaching 52 feet instead of 200, and made net power for 8.7 seconds. story 2 ↓
Google is paying Voltus for a 100-MW virtual power plant that takes over its PJM capacity obligation, reportedly a first. story 3 ↓
PJM and MISO each hold about 11.7 GW of firm data center projects; Southwest Power Pool, best prepared on rules, holds about 5%. story 4 ↓
China's exports jumped 36% in September, led by clean tech: battery EVs up 130%, plug-in hybrids over 200%, while home demand stayed weak. story 5 ↓
AEP, Amazon and X-energy signed a 960-MW Indiana nuclear deal; Amazon's long-term contract would cover construction and operating costs.
1/5The Climate Brink· Zeke Hausfather· Oct 19
Hausfather: new paper's evidence that warming doubled relies on flawed statistics
Climate scientist Zeke Hausfather tested a new paper's method on fake temperature records that warm at a steady rate. It falsely found acceleration in up to a third of them. The strictest test puts the real data just short of significance.
Why it matters · How fast the world is warming sets carbon budgets and decides whether aerosol cuts are speeding up warming. A method that over-detects change can mislead in either direction.
Know this first
Context from the editor, not the article · 31 sec
1 · Why acceleration is expected
Sulfate aerosols from burning coal and from ship fuel reflect sunlight and partly mask greenhouse warming. Clean-air rules have cut them sharply over two decades while greenhouse emissions stay near record highs, so faster warming is physically plausible.
2 · Statistical significance
A test at the 95% level should wrongly call pure noise a real effect at most 5% of the time. A p-value below 0.05 is the usual bar. Many choices made after looking at the data quietly raise that false-alarm rate.
3 · The 'hiatus' debate
Around 1998–2012 surface warming seemed to slow, and some papers claimed a significant 'pause'. Later reviews found little statistical support. Many of those claims rested on broken trend lines and break years picked after looking at the data.
2/5Heatmap· Katie Brigham· Oct 19
Startup drills first seafloor geothermal well, makes net power for 8.7 seconds
Seattle startup Endurance Energy drilled the first geothermal well on the seafloor, a mile down off Oregon. Its prototype generator, fed by a natural vent, produced about 2 kilowatts of net power for 8.7 seconds before failing.
Why it matters · Offshore geothermal could be a large source of firm, fuel-free power along the Pacific. This first field test shows how far the hardware still is from running continuously.
Know this first
Context from the editor, not the article · 28 sec
1 · How geothermal makes power
Hot water from underground carries heat to the surface. In a binary plant, that water boils a working fluid that vaporizes easily, such as a refrigerant. The vapor spins a turbine, and a pump sends the fluid back around the loop.
2 · Gross versus net power
A generator's own pumps and electronics use some of the electricity it makes. Net power is what remains after subtracting that internal load. A small prototype can make power and still end up with little or none to spare.
3 · Why offshore geothermal
Seafloor volcanic zones such as the Pacific "Ring of Fire" have hot rock, water and permeable ground close together. Until now, no one had drilled a geothermal well offshore.
3/5Utility Dive· Herman K. Trabish· Oct 19
Google pays for a 100-megawatt virtual power plant to cover its PJM capacity needs
Google is paying homes and businesses on the largest US grid to cut their demand at peak times, through a 100-megawatt virtual power plant run by Voltus. Voltus takes legal responsibility for Google's capacity obligation.
Why it matters · Data centers are pushing capacity prices to records while new power plants wait years to connect. Paying existing customers to cut peak demand may be the fastest new supply available.
Know this first
Context from the editor, not the article · 30 sec
1 · PJM and capacity markets
PJM runs the grid and wholesale markets for 13 states plus Washington, D.C. Its capacity market pays resources to be available at peak, years ahead. Suppliers serving customers must secure enough capacity to cover their share of peak demand.
2 · What a virtual power plant is
A virtual power plant (VPP) is software that pools many small resources, such as home batteries, rooftop solar, thermostats and factory loads. On signal, the pool cuts demand or exports power, so the grid sees it acting like one plant.
3 · The data center squeeze
4/5Utility Dive· Oct 19
Grid regions with the most data center demand are least ready for it
Enverus, an energy analytics firm, scored US grid operators against five reforms federal regulators demanded for connecting data centers. Southwest Power Pool scored best but has little demand. PJM and MISO have the most demand and only partial rules.
Why it matters · Where and how fast data centers can connect now depends on tariff rules that are still being written, and those rules decide who pays for grid upgrades.
Know this first
Context from the editor, not the article · 29 sec
1 · ISOs and RTOs
Independent system operators and regional transmission organizations run the high-voltage grid and wholesale markets across multistate regions, such as PJM in the mid-Atlantic and MISO in the Midwest. FERC, the federal regulator, oversees all of them except Texas's ERCOT.
2 · Load interconnection
Interconnection queues were built mainly for power plants. A single data center can draw hundreds of megawatts, as much as a city. Grid operators have to study whether the wires can carry that load and who pays for upgrades.
3 · Show-cause orders
A FERC show-cause order requires a utility or grid operator to explain why its current rules are still just and reasonable, or else propose changes. In June 2026 FERC issued such orders on large-load interconnection.
5/5Heatmap· Robinson Meyer· Oct 20
China's exports jumped 36% in September, led by EVs, batteries, solar
China's economy grew 4.5% in the summer quarter, and exports did much of the work. September exports were up 36% from a year earlier, driven by chips, ships, electric cars, solar panels and batteries.
Why it matters · Clean-energy hardware is now one of the main things holding up China's economy. That shapes prices and supply for electric cars, batteries and solar panels around the world.
Know this first
Context from the editor, not the article · 27 sec
1 · What 'new energy vehicles' means
China's official category for cars that don't run on petrol alone: fully battery-electric cars plus plug-in hybrids, which pair a battery you charge from the wall with a petrol engine. Chinese trade data reports the two separately.
2 · China's weak home economy
China's housing market crashed earlier this decade. That wiped out household wealth and building activity. Prices have since been falling (deflation), and consumers stay cautious, so factories rely on selling abroad.
3 · The oil-price backdrop
Heatmap has been arguing for months that the U.S. and Israeli war in Iran pushed oil prices up. Expensive fuel makes electric cars more attractive to buyers abroad, and it has also helped coal.
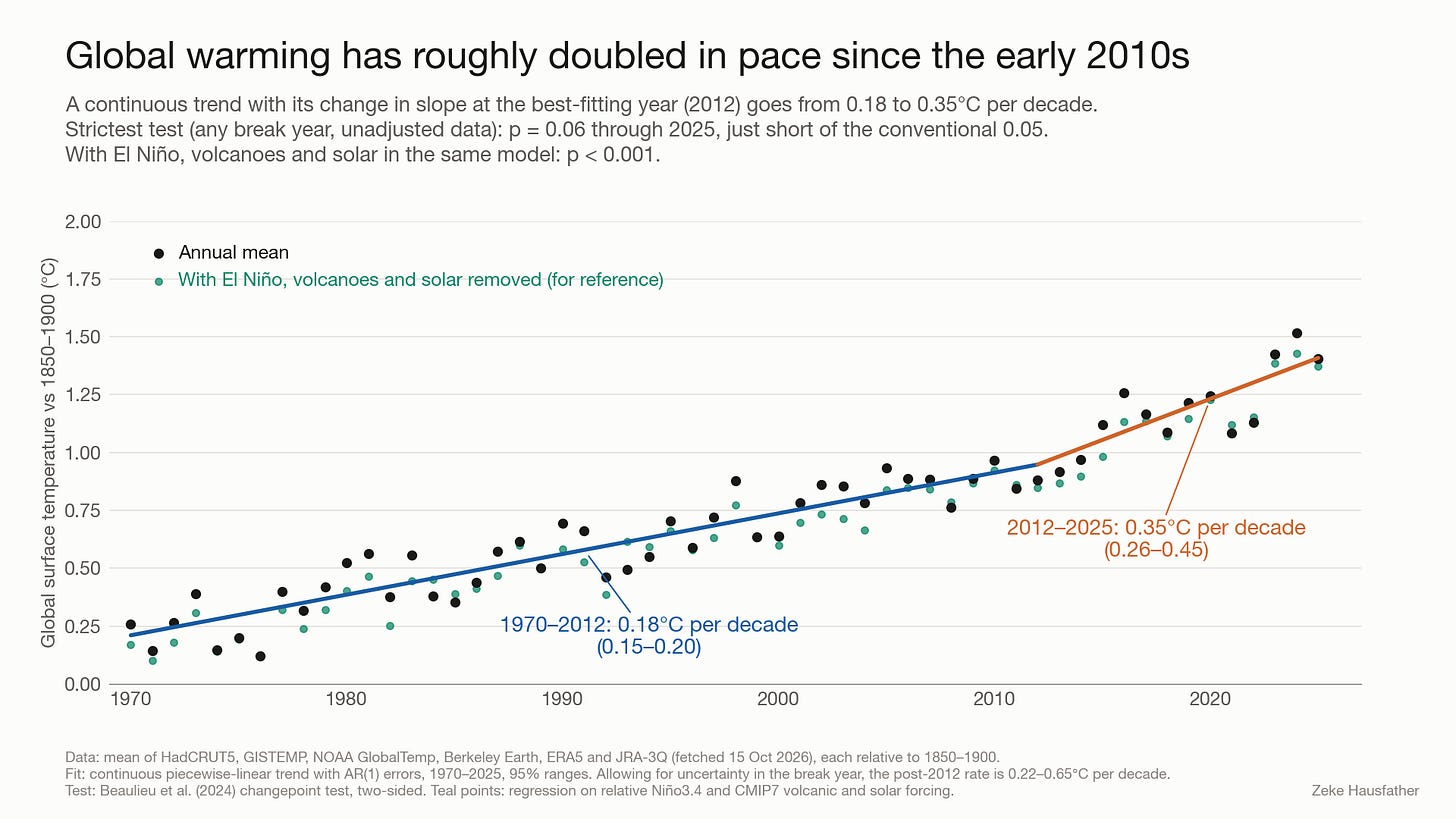
Global temperatures since 1970, with one continuous trend that steepens from 0.18 to 0.35°C per decade in 2012.1 / 3
A new paper by Jin and Pu in 1 says global temperature data through 2025 show a statistically significant doubling of the warming rate. Climate scientist Zeke Hausfather agrees that warming has probably sped up. But he shows that the paper's method finds acceleration in many simulated worlds where none exists.
The background
Physics supports a speed-up. Cooling aerosol pollution has dropped over two decades while greenhouse emissions stay near record highs. Fitting one continuous trend line that bends in the best-fitting year (2012) to an average of six temperature datasets gives 0.18°C per decade for 1970–2012 and 0.35°C for 2012–2025.
Proving the change isn't noise is harder, because 2 swings and volcanic eruptions push temperatures around from year to year. The strictest method is a 3. It lets the break fall in any year and raises the bar for significance to pay for that search. On raw data through 2025, Hausfather gets a 4 of 0.06 with it, just short of the usual 0.05 cutoff. The p-value falls below 0.001 once El Niño, volcanic and solar effects are modeled.
Two shortcuts
Jin and Pu report 0.40°C per decade for 2011–2025. Hausfather points to two problems with how they got there:
Broken trend. They fit two separate lines, and the recent one starts 0.11°C below where the earlier one ends, which makes it steeper. A continuous line bent at 2010 gives 0.32°C per decade.
Chosen split year. They tried every split from 1980 to 2015 and kept 2011 because it showed the biggest contrast. As far as the paper describes, they did not correct the significance test for that search.
The synthetic test
Hausfather generated 5,000 fake temperature records that each warm at a steady 0.20°C per decade, with realistic noise. He then ran the paper's procedure on each one. Between 22% and 34% came out as "significant" acceleration, depending on how the two trends were compared. A 95% test should do this at most 5% of the time. One fake record showed 0.19°C before 2012 and 0.36°C after, a "doubling" that looks almost exactly like the real data. The changepoint test produced false alarms only 5% of the time.
Why it matters
The same two shortcuts produced claims of a significant warming "pause" a decade ago. Later reviews found little statistical support for those claims. Hausfather argues that rigorous tests must be equally slow to confirm a speed-up. He still thinks acceleration is likely real, and expects that 2026, on track to be among the warmest years on record, may push the record past the threshold.
Zeke Hausfather, a climate scientist who writes The Climate Brink, has taken on a new paper by Jin and Pu in 1. The paper claims that global temperature data through 2025 show a statistically significant doubling of the warming rate. Hausfather agrees that warming has probably sped up. His objection is to the method: tested on simulated climates with no acceleration at all, it flags a "significant" speed-up far more often than it should.
The case for acceleration, and why proving it is hard
The physical argument is strong. Aerosol pollution, which cools the planet by reflecting sunlight, has fallen substantially over two decades, while greenhouse gas emissions remain near record highs. The observed warming rate over the past decade is roughly double that of the four decades before.
The problem is noise. Global temperature jumps around from year to year with 2 (a periodic warming of the tropical Pacific), volcanic eruptions and solar cycles. That noise is also persistent: a warm year tends to be followed by another warm year. With only about 13–15 years of "fast" data, telling a real change in slope apart from a run of warm years is hard.
Hausfather fits one continuous trend line to the average of six global temperature datasets from 1970 to 2025, and lets the slope change in whichever year fits best. That year is 2012. Warming was 0.18°C per decade (range 0.15–0.20) from 1970 to 2012, and 0.35°C per decade (0.26–0.45) from 2012 to 2025. If you also allow for uncertainty about which year the change happened, the post-2012 range widens to 0.22–0.65°C per decade. For comparison, the Indicators of Global Climate Change 2025 report, which Hausfather co-authored, puts human-induced warming over 2016–2025 at 0.27°C per decade.
What the strict test says
The demanding approach is a 3. It lets the break happen in any year, then raises the bar for significance to pay for that search. Beaulieu et al. (2024) used it on data through 2023 and found a warming surge "not detectable yet." Foster and Rahmstorf (2026) found the same for raw data through 2024. They did find acceleration at 98% confidence once El Niño, volcanic and solar effects were removed.
Hausfather ran the test on raw data through 2025. On the six-dataset average he gets a 4 of 0.06, just above the conventional 0.05 cutoff. Individual datasets range from 0.02 for NOAA to 0.13 for JRA-3Q, a 5 (a weather-model reconstruction of past climate). Only NOAA and NASA's GISTEMP fall below 0.05. If El Niño, volcanoes and solar are put into the same statistical model, the p-value drops below 0.001.
Two pitfalls in the Jin and Pu method
Jin and Pu report 0.40°C per decade over 2011–2025 against 0.20°C per decade over 1971–2025, significant in all five datasets they used. Fit a separate line to 2011–2025 and you get about the same: 0.41°C on Hausfather's average. He argues the trouble lies in how the comparison is built, and points to two traps that Rahmstorf, Foster and Cahill described in 2017.
The broken trend. Jin and Pu fit two independent lines, 1971–2010 and 2011–2025, and nothing forces the second line to start where the first ends. In the real data the recent line starts 0.11°C below the end of the earlier one. Starting lower and ending at the same recent temperatures makes it steeper. That free jump is also an extra adjustable parameter that the significance test doesn't account for. A continuous line that bends at 2010 gives 0.32°C per decade after the bend. That is still well above 0.18, but below 0.40.
The chosen split year. The authors tried every dividing year from 1980 to 2015 and picked 2011 because it gave "the largest and most statistically significant contrast." As far as the paper says, the test at 2011 makes no correction for that search. Here is an illustrative analogy: roll 36 dice, keep the highest, and then treat that six as surprising.
The synthetic test
To measure how much this matters, Hausfather generated 5,000 fake temperature records. Each warms at a steady 0.20°C per decade from 1971 to 2025, with year-to-year noise of the same size and persistence as the real record. He applied the Jin and Pu procedure to each one. He tried every split year from 1980 to 2015, kept the split with the biggest before/after contrast, and tested whether the recent trend was significantly faster at the 95% level.
One flagged example splits at 2012 and shows 0.19°C per decade before and 0.36°C after. That "doubling" looks almost exactly like the real record, but the true trend is constant. Across all 5,000 records, 22% to 34% are flagged as significant acceleration. The figure depends on the comparison rule: requiring the two 95% ranges not to overlap gives 22%, and testing the difference against 1.96 standard errors gives 34%. The correct rate is at most 5%. Both figures count only false accelerations, so including false slowdowns would push them higher. Hausfather used ordinary least squares trends, while Jin and Pu used 6, a method based on the median of slopes between pairs of points. Both used similar corrections for 7, the year-to-year persistence in the noise.
The changepoint test, run on the same synthetic records, gives false positives about 5% of the time, as designed. That rigor is exactly why it struggles to reach significance on real data despite a near doubling of the rate.
The hiatus in reverse
Hausfather notes the irony. A decade ago the same two shortcuts made a temporary slowdown look like a significant "pause." The tools developed in response, many by the researchers now finding acceleration, are why a later review found "little or no statistical evidence" for the slowdown and called broken trends a "common (but questionable) practice." His point is that applying those tools consistently means they will also be slow to confirm a speed-up.
What remains open
Hausfather still thinks acceleration is likely real. He points to physics and data agreeing, and to the raw record sitting at the edge of formal detection under the strictest test. He cautions that 0.05 is a convention, not a law. He describes the current result as a "~94% chance of acceleration". Strictly, a p-value is not the probability that a hypothesis is true, so that phrasing is looser than the test itself.
Two things keep the result fragile. Results depend on the choice of datasets: on Jin and Pu's five datasets the strict test gives p = 0.047, partly because the reanalyses Hausfather includes are noisier. They also depend on whether natural variability is removed first. With 2026 on track to be among the warmest years on record, Hausfather expects the question may settle soon, and plans to revisit it once the full-year data are in.
Remember
Picking a break year after looking at the data, without correcting for it, can push false alarms from 5% to over 30%.
Letting two trend lines jump apart at the break inflated the recent rate from 0.32 to about 0.40°C per decade.
With the strictest test, raw temperature data show a speed-up with p = 0.06, just above the usual 0.05 cutoff.
Seattle startup Endurance Energy has drilled what it says is the world's first 1. The site is about 300 miles off Oregon, a mile below the surface. Its prototype plant ran for 29 seconds and made about 2 kilowatts of 2 for 8.7 seconds. The goal had been to run its 100-kilowatt generator for a full year.
Where and how
The test took place at 3, an active underwater volcano. Per the article, it is the only place where a cluster of 4 (seafloor openings releasing superheated water) is wired to shore by fiber-optic cable, so the team could control the system from Seattle.
The ship was chartered for a fixed three-week window, and the team spent 11 days debugging a drill it had never used underwater. The finished well is about 2 inches wide, lined with pipe and cemented, and 52 feet deep, against a 200-foot target.
Water came up at about 260°C. That was hot enough, but the narrow, shallow bore couldn't deliver enough flow to run the generator. So the team connected the generator to a hotter natural vent instead.
"Net" here means turbine output minus the 7 to 8 kW used by the plant's own equipment, such as its 5. Gross output was therefore roughly 10 kW, about a tenth of the rated capacity. Then a software glitch tripped the battery safety system and shut the plant down. On restart, the pump's power cable failed, ending the mission.
A rough calculation (not from the article): the net energy came to about 0.005 kilowatt-hours, roughly what a 60-watt bulb uses in five minutes.
What's next
CEO Andrew Redd, a former SpaceX engineer, says the mission proved a well can be drilled and completed on the seafloor. He admits it missed his bar for success, which was leaving the generator running. The hardware is back in Seattle for software fixes, upgrades and new subsea-cable testing. Another mission, with a much deeper well, is planned for this winter.
The bigger milestone is a 2-megawatt plant off Tonga by the end of 2027, replacing expensive imported diesel. Endurance raised a $54 million 6 in June, led by Founders Fund.
The case, and the gap
Redd argues offshore geothermal needs no fuel, has nothing visible at the surface, and can sit near big cities around the Pacific "7." A conference paper by the geoscience firm 8 estimates about 6 terawatts of recoverable offshore resource, nearly twice the world's average electricity output.
But that is a resource estimate, not a cost estimate. Getting from 29 seconds to a 2-megawatt plant running continuously within about a year is a very large jump.
What happened
Endurance Energy, a Seattle startup about 21 months old, has drilled what it says is the world's first 1. The site is about 300 miles off the Oregon coast, roughly a mile below the surface. Its prototype power plant then ran for 29 seconds. For 8.7 of those seconds it put out about 2 kilowatts of 2.
The plan had been far bigger. Endurance wanted to run its 100-kilowatt generator on the seafloor for a full year. CEO Andrew Redd, a former SpaceX engineer, says the mission proved "a geothermal well could be drilled and completed on the seafloor." He also says it missed his own bar for success, which was leaving the generator on the seafloor still producing power. Heatmap's Katie Brigham describes the company's press release as unusually frank about what did and didn't work.
The site
The test took place at 3, an active underwater volcano. Per the article, it is the only place in the world where a cluster of 4 (seafloor openings that vent superheated water) is linked to shore by fiber-optic cable. That cable let the team monitor and control the system in real time from Seattle. This was the company's fifth deep-sea mission and its first attempt to drill its own well.
Why the ocean is hard
Saltwater corrodes equipment. Offshore infrastructure is expensive to build and harder still to maintain and repair. Redd says land-based geothermal gear can't simply be moved onto the seafloor: "Every component that you would use terrestrially now needs to be either modified or built completely from scratch." He argues the offshore wind, oil and gas industries have already solved much of the subsea engineering, and that what was missing was private-sector ambition.
The schedule added pressure. The ship was chartered for a fixed three-week window, so the team couldn't wait for everything to be ready. They spent the first 11 days debugging a drill they had never used underwater. "We were still working on that generator hours before it got on the seafloor," Redd said, comparing it to tweaking a rocket on the launchpad.
What actually happened on the seafloor
The team drilled two holes and finished the second as a well. It is about 2 inches wide, lined with pipe and sealed with cement. With so much time lost, it reached only about 52 feet, against a 200-foot target.
Water came up the well at about 260°C (around 500°F). That is hot enough. The problem was the amount. A geothermal well delivers heat at a rate set by flow rate times the temperature drop the plant extracts, and a 2-inch, 52-foot bore could not move enough water to run the generator.
So the team switched to a natural hydrothermal vent, which was hotter and flowed on its own. With that supply the generator ran for 29 seconds. The roughly 2 kilowatts it made for 8.7 seconds is net output: total turbine output minus the 7 to 8 kilowatts its own equipment used, such as the 5. The refrigerant pump implies a binary-cycle design, though the article doesn't describe the plant in detail.
Then a software glitch set off the onboard battery safety system, which shut the plant down. When the team tried to restart it, the power cable feeding the refrigerant pump failed, and the pump couldn't come back on. The mission ended there.
The numbers in perspective
A rough calculation (illustrative, not from the article): 2 kW for 8.7 seconds is about 17 kilojoules, or roughly 0.005 kilowatt-hours. That is about what a 60-watt bulb uses in five minutes.
Gross output was therefore around 9 to 10 kW, about a tenth of the generator's 100-kW rating. The plant's own equipment used most of what it made.
The original goal, 100 kW for a year, would have meant about 876 megawatt-hours.
None of this measures the resource. It measures how immature the hardware is. The well's water was hot, and the failures came from drilling time, well size, software and a cable.
What's next
Endurance has brought the system back to Seattle. It is fixing the software, refurbishing and upgrading the hardware, and changing how it builds and tests subsea cables. The next mission is planned for this winter, aiming for sustained power from a much deeper well.
After that comes a planned 2-megawatt project off Tonga by the end of 2027, selling electricity straight to a grid that depends heavily on expensive imported diesel. Redd expects subsea geothermal to match diesel's cost in that pilot. Later, he expects it to undercut natural gas for grids, industrial sites and data centers across the Pacific Islands, the U.S. West Coast and Northeast Asia. All of these sit along the 6, the belt of volcanic and tectonic activity around the Pacific.
Money isn't the immediate constraint. In June, Endurance raised a $54 million 7 led by Peter Thiel's Founders Fund, its second round in under two years.
The size of the prize, and the caveats
Redd's pitch: terawatts of potential, no fuel, sites near big Pacific cities, and nothing visible at the surface. He says the three things a good geothermal well needs (permeable rock, high heat and water) are widely available offshore. A conference paper presented last year by the geoscience firm 8 estimates about 6 terawatts of recoverable offshore geothermal power worldwide. That is nearly twice the world's current average electricity output.
That estimate describes resource potential, not what can be built at a given cost. The article doesn't address several open questions:
Getting power to shore. Running high-voltage subsea transmission from volcanic sites to cities is costly.
Maintenance. Corrosion and repairs a mile down could be expensive over decades.
Environmental effects. The impact on vent ecosystems isn't discussed.
Cost evidence. There is none yet. Endurance's cost claims rest on projections, since its longest run so far is 29 seconds.
The jump from about 2 kW for seconds to 2 MW running continuously within roughly a year is the step to watch. This winter's deeper well is the first test of whether the "make it exist, then make it good" approach can close that gap.
Remember
The well's 260°C water was hot enough; the flow from a 2-inch, 52-foot bore was too small.
The plant's own equipment used 7 to 8 kW of its roughly 10 kW gross output.
Endurance's cost claims rest on projections; a 2-megawatt Tonga plant is due by end of 2027.
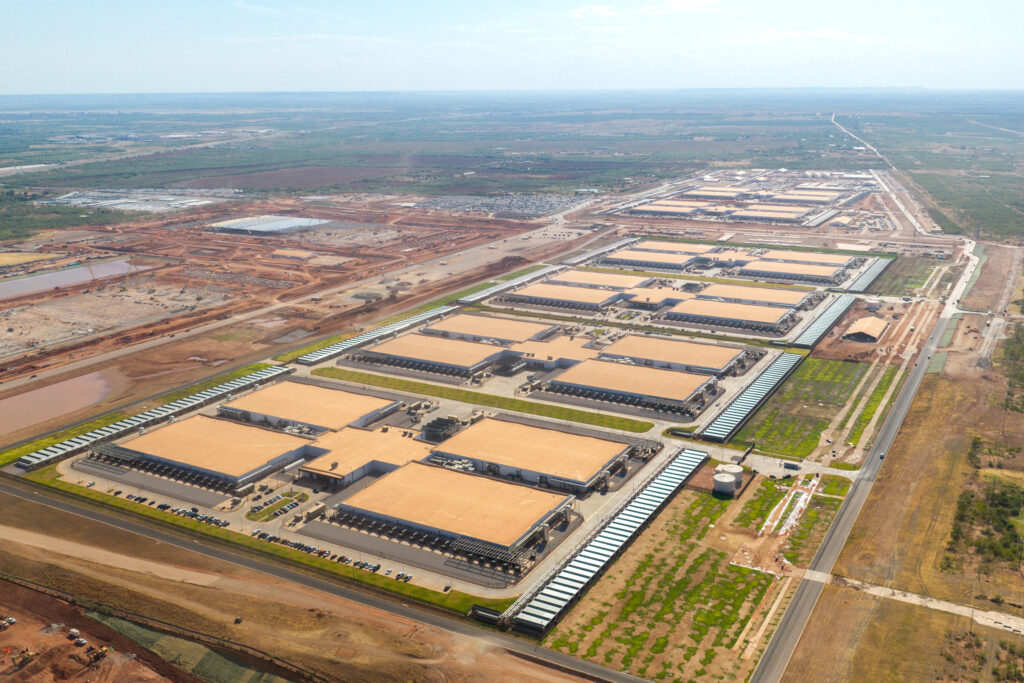
Data center growth is outrunning new supply in PJM, and capacity prices there have hit record highs. New generators wait years in the interconnection queue, the line for studies and approval to connect to the grid.
A data center in Springfield, Ohio, inside PJM, where data center demand has driven capacity prices to records.1 / 2
Google is paying for a 100-megawatt 1 in the 2, the grid operator for 13 Mid-Atlantic and Midwestern states plus Washington, D.C. A VPP is software that pools home batteries, rooftop solar and adjustable business loads so they act like one power plant. For three years, Google will pay homes and businesses to take part. Voltus, a company that aggregates small energy resources, runs the program.
What's new
Voltus takes responsibility for Google's 3: Google's legally required share of power that must be available at peak demand. A pool of customers carries that obligation instead of a power plant. Jon Wellinghoff, Voltus's regulatory chief and a former chair of the Federal Energy Regulatory Commission, calls it "bring-your-own-new-capacity" at utility scale.
Why now
Data centers have pushed PJM's capacity prices to records, and demand still exceeds supply. New generators wait years in 4 for approval to connect. Customer batteries and flexible loads are already in place, so they can be added much faster.
The numbers
100 MW is about 0.06% of PJM's record 168.2 GW peak on July 2. A 2025 Department of Energy study found distributed resources could meet up to 20% of US peak needs by 2030. Consultant Scott Vogt says a typical PJM home solar-plus-storage system cuts peak demand by about 6 kW, while the average home uses only about 3 kW at critical peaks. So each system covers its own share of the peak and roughly one neighbor's.
The catch
In California, Google is also funding SHARE, a Pacific Gas & Electric (PG&E) program that will enroll more than 20,000 customer devices. Jigar Shah, who ran the Energy Department's loan office under President Biden, says it is "not a success story." PG&E has more customer-side batteries than any other US utility but no state-approved way to pay their owners. PG&E blames state regulators and says Google's money got the program from idea to contract in months. New Jersey and Pennsylvania are also considering how to pay customers for cutting demand.
Money pouring in
Recent deals include:
Sunrun, Everyday Electric and Tesla promising more than 16 GW of flexible capacity.
Schneider Electric, Octopus Energy US and Uplight targeting 20 GW within five years.
Voltus raising $225 million and aiming for 20 GW by 2030.
Voltus's CEO compares these contracts to the power purchase agreements that financed wind and solar.
Most of the article's sources sell this product, and it reports no performance data for the Google deal. One battery executive warns that the market rules may not settle for a decade.
The deal
In June, Google agreed to fund a 100-megawatt 1 in the 2, the grid operator and wholesale market covering 13 Mid-Atlantic and Midwestern states plus Washington, D.C. A VPP is software that pools many small resources, such as home batteries, rooftop solar and adjustable business loads, so they act like one plant. For three years, Google will pay residential, commercial and industrial customers to take part. Voltus, a company that aggregates 3, will run the program.
The money is not the unusual part. The contract makes Voltus responsible for Google's 4. Capacity is PJM's word for a commitment to be available at peak, and buyers who add load must cover their share of it. Under this contract, a pool of homes and businesses carries that obligation instead of a gas plant or a grid battery. Jon Wellinghoff, Voltus's chief regulatory officer and a former chair of the Federal Energy Regulatory Commission (FERC), calls it "a turning point" that lets markets "treat distributed capacity like any other capacity resource." He calls the model BYOC, or "bring-your-own-new-capacity," at utility scale.
Why now
PJM's capacity prices have hit records because demand, led by data centers, is growing faster than supply. Even at those prices, demand for capacity still exceeds supply, says Mary Yang, chief operating officer of the consultancy 804 Advisory. Interconnection queues, the line new generators wait in to get studied and approved to connect, are years long at PJM and other regional operators. Experts quoted in the article say distributed capacity is faster and easier to bring online because the hardware is already in buildings or can be installed without a transmission study.
The rules are also changing. FERC recently rejected most of PJM's plan for connecting large loads. That plan would have exposed big new customers that did not bring their own capacity to a high risk of being curtailed, meaning cut off during shortages. The plan is gone, but the pressure on data centers to show up with supply remains.
Scale and economics
Scale matters here. 100 MW is tiny next to PJM's record peak of 168.2 GW, set on July 2. That is about 0.06%. A 2025 Department of Energy study found that distributed resources overall could meet up to 20% of US peak needs by 2030.
Scott Vogt, a consultant and former Commonwealth Edison (ComEd) strategy executive, gives a per-household example. In PJM, the average home solar-plus-storage system cuts the customer's peak-period demand by about 6 kW. The average home uses only about 3 kW during critical peaks. A worked reading of those numbers, ours rather than the article's: the household's peak draw falls to zero, and roughly 3 kW more flows back to the grid. One system therefore offsets its own share of the peak plus a neighbor's. That lowers the household's capacity costs and, Vogt says, the high capacity costs other ComEd customers pay. On those averages, about 17,000 such homes would add up to 100 MW. The article does not say how Voltus's portfolio is actually made up.
The PG&E controversy
A second Google-funded program shows the problems. In September, Pacific Gas & Electric (PG&E) launched SHARE (Smart Home Assets for Reliability and Efficiency) with Google and the nonprofit Rewiring America in the San Francisco Bay Area. It will enroll more than 20,000 existing customer-owned DERs, plus new heat pumps with built-in batteries, to relieve congestion on the grid. Google is paying for all of it: incentives, technology and delivery.
Jigar Shah, who ran the Energy Department's loan office under President Biden, wrote that SHARE is "not a success story." He pointed out that PG&E has more 5 batteries (batteries on the customer's side of the meter) than any other US utility. Yet it has no program approved by the California Public Utilities Commission (CPUC) to pay owners for the grid services those batteries already provide.
PG&E spokesperson Paul Doherty says the gap belongs to state regulators. They would need to set a compensation method, let DERs compete in wholesale markets and set performance standards. "SHARE is not us waiting for perfect rules," he said. With outside funding, "we moved from idea to contract in months, not years." The exchange points to a real tension. Hyperscalers (the largest cloud and AI companies) can fund programs faster than regulators can set rules, but a utility could end up relying on a tech company's budget instead of paying for grid services under approved tariffs.
The same regulatory question exists inside PJM. Yang says New Jersey and Pennsylvania are considering how to pay customers for demand-side value, but that would need new state programs and tariffs, and possibly state or federal approval.
The aggregators scale up
Recent deals show where the money is going:
Sunrun, Everyday Electric (formerly Renew Home) and Tesla agreed to supply more than 16 GW of flexible capacity to utilities and 6.
Schneider Electric, Octopus Energy US and Uplight plan to grow Uplight's portfolio to 20 GW within five years.
Branch Energy raised $33 million to move from Texas into PJM's capacity market.
Sunrun will supply Voltus with capacity from thousands of home solar and storage systems in PJM and 7, the Midcontinent grid operator, to back Voltus's hyperscaler contracts. Voltus also bought battery developer Brightfield.
Voltus raised $225 million in Series D funding and aims for 20 GW of distributed capacity by 2030.
Voltus CEO Dana Guernsey compares BYOC contracts to the power purchase agreements that let tech companies' balance sheets finance utility-scale wind and solar. She also argues that hyperscalers are choosing flexibility partly because of the public backlash against data centers, since these programs pay participating customers and, she says, lower bills for everyone. That second claim is hers, and the article gives no data to support it.
Caveats
The article's sources mostly sell distributed capacity, and the article contains no performance data from the Google–Voltus deal itself. Tom Hunt, CEO of Pivot Energy, which sells commercial and industrial-scale batteries, warns that with the industry consolidating, "the exact products and market mechanisms may not be certain for 10 years." Pier LaFarge, CEO of Sparkfund, which works on Xcel Energy's Capacity*Connect pilot in Minnesota, says distributed capacity "has arrived." He also says the grid still needs transmission, central generation, storage and flexible data center demand. He claims hyperscalers have learned that building off-grid power is "shockingly more expensive" than contracting for distributed capacity. The article gives no cost figures for that comparison.
Open questions remain. How will PJM verify and price a 100 MW pledge spread across thousands of sites? What happens when the three-year contract ends? And will states create standing compensation programs, so that grid value from customer equipment does not depend on a tech company choosing to pay for it?
Remember
Voltus taking on Google's capacity obligation lets customer devices count like a power plant in PJM.
One home solar-plus-storage system cuts about 6 kW at peak, roughly double what an average home uses then.
In California, tech money is moving faster than regulators can set up programs to pay for grid services.
Data center developers are building where grid rules are least settled. That is the main finding from Enverus Intelligence Research (EIR), the research arm of an energy-data company. EIR graded each US grid operator's readiness for very large loads against five reform areas. Those areas come from 1's June 2026 2, which require every operator under the Federal Energy Regulatory Commission to show its rules can handle the roughly 62 GW of new US data center capacity expected by 2030.
Note that this piece is sponsored content from Enverus, and it ends with a pitch for the company's grid-modeling tool.
The five reform areas
FERC lets each region design its own fixes, but it named five areas they must cover:
how applications are studied
who pays for upgrades (cost allocation)
co-location and 3 generation, meaning power plants built beside the load
flexible-load services
rules for generation that serves nearby loads
Region by region
4 (Southwest Power Pool) is the only region with FERC-approved large-load tariffs. Its frameworks pair new load with new generation and limit the costs passed to other ratepayers. A service called 5 connects a load almost immediately if it accepts non-firm power for 7 years while upgrades are built, along with the risk of being cut at peak demand. But SPP holds only about 5% of EIR's "high-confidence" pipeline. That means projects that are announced and have land, plus access to power, gas and fiber.
6 has the largest pipeline, about 11.8 GW, and 58% of it plans to run behind the meter so it can skip the grid queue. EIR's Amyra Mardhani says those projects still touch the grid at the margins, so they are "caught up in it too." PJM's Bring Your Own Generation process speeds up co-located projects.
7 has about 11.6 GW, 78% of it grid-connected. It has made progress in three areas: making large loads pay for upgrades upfront, allowing paired plants that never export to the grid, and connecting load in steps as upgrades finish. Some of these rules are still awaiting FERC approval.
NYISO, ISO-NE and CAISO (New York, New England and California) have little or nothing in place.
8, Texas's grid operator, is outside FERC's reach. It is moving from first-come, first-served studies to "Batch Zero," which studies groups of projects together. On August 3, Governor Greg Abbott called for a moratorium on new data center connections, which delayed the first batch.
What it means
FERC's orders put upgrade costs on the load itself, so siting now depends on detailed grid modeling. Mardhani says no one knows what each operator will finally adopt, or when. Her advice: "If speed matters more than location, SPP and PJM are the better bet." The article gives no letter grades or scoring method, so the "grades" here are qualitative.
Enverus Intelligence Research (EIR), the research arm of the energy-data company Enverus, has graded US grid operators on how ready they are to connect very large electricity loads, mainly data centers. Its headline finding: the regions drawing the most data center development are, almost without exception, the least prepared to connect it.
The yardstick is a set of 1 that 2 (the Federal Energy Regulatory Commission) issued in June 2026. A show-cause order requires a regulated entity to explain why its existing rules are still just and reasonable, or else change them. These orders require every grid operator under FERC's jurisdiction to show that its interconnection framework can handle the roughly 62 GW of new US data center capacity expected by 2030.
One caution: this is a sponsored article from Enverus. It closes with a pitch for the company's interconnection-modeling product. The regional assessments are still useful, but the article publishes no scoring method or letter grades.
Why large loads are a new problem
Interconnection processes at ISOs and RTOs (the independent operators that run regional grids and wholesale markets) grew up around power plants. A single data center campus can draw hundreds of megawatts, so the grid has to be studied for it much as it would be for a large plant. That raises questions the old rules never answered. Who pays for the upgrades? Can a load avoid the queue by building its own generation on site? Can it accept interruptible service in exchange for connecting sooner?
FERC chose not to impose a single solution. It asked each region to tailor reforms within five categories:
Application and study processes
Cost allocation
Co-location and 3 (BTM) generation, meaning generation sited at the load and partly or wholly bypassing the grid
Flexible-load services, meaning service that can be curtailed or phased in
Processes for generation that serves nearby or co-located loads
The result, the article says, is a patchwork of timelines, costs and risks. Utilities carry much of the burden. They have to rewrite operating playbooks, plan for short-term grid effects and unpredictable load behavior, and revise capital spending forecasts.
4: most prepared, little demand
The Southwest Power Pool (SPP) is the only region with FERC-approved large-load tariffs. It has two main frameworks. High Impact Large Load (HILL) covers the loads. High Impact Large Load Generation Assessment (HILLGA) studies new generation paired with them. According to EIR, together they reduce network-upgrade costs, ease co-location, limit how much of the cost is shared with other ratepayers and make studies more efficient.
SPP also has the most flexible fast-track option, the Conditional High Impact Large Load Service (5). A new or expanding load can connect almost immediately. In exchange, it accepts conditional, non-firm transmission service for 7 years while upgrades are built, plus the risk of being curtailed at peak demand. The trade is time to power against reliability of supply.
But SPP holds only about 5% of EIR's high-confidence large-load pipeline. EIR counts a project as high-confidence when it has been announced and the developer owns land and has access to power, gas and fiber.
6: biggest pipeline, many bypass attempts
PJM, which runs the grid across the mid-Atlantic and parts of the Midwest, has the largest high-confidence pipeline at about 11.8 GW. 58% of it is expected to be served behind the meter. EIR reads that as a sign developers value speed to power above almost everything else.
EIR's Amyra Mardhani says bypassing the grid should, in theory, speed things up. But BTM and co-located loads still draw from and feed into the grid at the margins, so "loads that expected to bypass both the policy uncertainty and the delays of a grid interconnection are now caught up in it too." They keep some advantage over fully grid-connected projects, she says, "but less than they were counting on."
EIR rates PJM stronger than most regions on co-location because of its Bring Your Own Generation framework, which includes an expedited process for co-located projects. PJM is partly ready in two other areas. One is BTM netting reform, which sets how on-site generation is subtracted from a load's grid demand. The other is interim NITS, or Network Integration Transmission Service, the standard way loads take transmission service, together with contract-demand arrangements.
7: steady progress on three fronts
MISO (the Midcontinent ISO) has about 11.6 GW in its pipeline, 78% of it expected to connect to the grid. EIR credits it with good progress in three of the five categories, though some policies are still in development or awaiting FERC approval:
Cost allocation: Contribution in Aid of Construction (CIAC) makes large loads pay for network upgrades upfront, which limits shifting costs onto other customers.
Co-location: A Zero-Export Generation Interconnection Agreement (ZGIA) pairs new load with new generation that is barred from exporting to the grid. That reduces the transmission it needs and speeds up connection.
Flexible load: Firm Step-Up Service lets a load ramp up in increments as upgraded equipment comes online.
The laggards, and Texas
NYISO (New York), ISO-NE (New England) and CAISO (California) have limited or no large-load frameworks. CAISO has some demand-response tools, but they line up poorly with FERC's categories.
8, Texas's grid operator, sits outside FERC's jurisdiction but is rewriting its own rules. Its Batch Zero process replaces sequential, first-come, first-served studies with batch studies of many projects together. Studying projects together makes it less likely that a new study invalidates an earlier one, and it could shorten timelines. On August 3, Governor Greg Abbott called for a moratorium on new data center interconnections until questions about energy, water and public funds are answered. That delayed the first Batch Zero projects.
What it means for siting
Because FERC's orders stress transparency and preventing cost shifts, the load now pays for the infrastructure that serves it. EIR argues that developers therefore need detailed transmission models to choose interconnection points that minimize delay, upgrade costs and curtailment exposure. The article's closing section promotes Enverus's own tool for this, a physics-based grid simulation and optimization engine.
Mardhani's practical advice: "If speed matters more than location, SPP and PJM are the better bet." SPP is the only region where regulatory timing and cost risk are largely settled, which could widen its lead.
What stays open
The core problem is that "no one knows exactly what each ISO will do or on what timeline," as Mardhani puts it, and developers and utilities don't want to commit capital before tariffs settle. Several questions remain:
Will SPP's readiness attract projects away from PJM and MISO?
How much will curtailment-based fast tracks like CHILLS actually get used?
Will FERC accept the differing regional answers?
The article doesn't give the size of the total pipeline or explain how the grades were assigned.
Remember
SPP is the only region with FERC-approved large-load tariffs but holds only about 5% of firm data center projects.
Behind-the-meter plans don't fully escape grid rules. They still touch the grid, so they inherit policy delays.
FERC's orders push upgrade costs onto the data centers themselves, which makes choosing a site depend on detailed grid modeling.
China's economy grew 4.5% in the summer quarter compared with a year earlier, according to official figures released Monday. That puts the country on track to hit its growth target for the year, though at the low end. Robinson Meyer, executive editor of the climate publication Heatmap, argues that the more telling figure is where that growth came from. Increasingly, it comes from clean-energy hardware sold abroad.
Exports doing the work
Spending at home is weak. Consumer confidence is low, and 1 (money spent building and buying homes) has not recovered from the property crash earlier this decade. Exports have filled the gap. In September they were more than 36% higher than a year earlier, driven by chips, ships, electric vehicles, solar panels and batteries. China is likely to record its largest 2 ever this year; a trade surplus is the amount by which exports exceed imports.
Electric cars sold abroad
Part of the export jump comes from the global boom in artificial intelligence, especially chips and to some extent batteries. The car numbers point to a second source. China's carmakers' trade association reports:
Sales of 3 were up more than 13% in September from a year earlier. New energy vehicles is China's category covering fully battery-electric cars and 4.
Exports of fully battery-electric cars were up 130%.
Exports of plug-in hybrids were up more than 200%.
Exports are growing much faster than sales, so foreign buyers are driving the growth. Heatmap has argued for months that the U.S. and Israeli war in Iran pushed oil prices up, which helps electric vehicles and clean energy (and also coal). Meyer reads the export figures as support for that view: higher oil prices are not hurting Chinese car exports.
The article gives only growth rates. It has no volumes, dollar values or destination countries, so it doesn't show how big these flows are.
Two economies, opposite problems
Meyer compares the two largest economies. The U.S. is in an investment boom that is propping up jobs and keeping inflation high. China has 5 (falling prices) and relies on exports to grow. In both countries consumers are gloomy.
He uses China as a caution against forecasts that AI could lift annual U.S. growth to 4%, 5% or even 7%. China leads in many technologies yet is still limited by ordinary supply and demand. He adds that if the U.S. economy stumbled, no foreign buyers would step in to rescue it, as they are now doing for China.
On Monday China published its economic figures for the summer quarter. Output was 4.5% higher than in the same quarter of 2025. In his evening newsletter for Heatmap, a climate and energy publication, executive editor Robinson Meyer argues that the figures show clean-energy exports are no longer a sideline for China. He calls them one of the brighter spots in the world's second-largest economy.
Growth that comes from abroad
At 4.5% growth, China will probably hit its official growth target for the year, though at the low end. Meyer points out what is missing from the picture: spending at home. Consumer confidence remains low. Residential investment, meaning money spent building and buying homes, has not come back since the property crash earlier this decade.
Exports are filling the gap. In September they were more than 36% higher than a year earlier. China looks set to record its largest 1 ever this year; a trade surplus is the amount by which a country's exports exceed its imports. Meyer names five product groups behind the jump: chips, ships, electric vehicles, solar panels and batteries.
Separating AI demand from the oil shock
The headline figure mixes two different sources of demand. Some categories are riding the global boom in artificial intelligence. Chips are the obvious one, and Meyer says batteries partly fit too. The car figures tell a different story. If rising oil prices were hurting global trade, you would expect vehicle exports to suffer. Instead, they are where the growth is concentrated.
The figures come from China's carmakers' trade association:
Sales of 2 rose more than 13% in September compared with a year earlier. New energy vehicles is China's category for battery-electric cars plus 3.
Exports of fully battery-electric cars rose 130%.
Exports of plug-in hybrids rose more than 200%.
Sales grew by about a seventh, but exports more than doubled for one type of car and roughly tripled for the other. So foreign buyers, not Chinese ones, are driving the car figures. That fits the argument Heatmap has been making for months. On its account, the U.S. and Israeli war in Iran pushed oil prices up, making electric cars and plug-in hybrids cheaper to run than petrol cars. That has helped electric vehicles and clean energy, and coal as well.
The article gives only growth rates, not volumes or dollar values. Readers cannot tell from it how large these export flows are or how much they contribute to the 36% total. Plug-in hybrids may also be growing from a smaller base, which would make their 200% jump look bigger than it is.
Two economies that mirror each other
Meyer then compares China and the United States. America is in an investment boom. In his account, it supports the job market and keeps inflation stubbornly high. China has the opposite problem: 4, meaning falling prices, with exports as its quickest route to growth. In both countries consumers are gloomy, even though Meyer judges American households to be in much better financial shape.
He then turns to forecasts about AI. Some forecasters, including some employees of Anthropic, the AI company, picture annual U.S. economic growth of 4%, 5% or even 7%. Meyer declines to make a forecast. He offers China as a caution instead: a country that leads in many technologies but is still bound by ordinary economics, where supply, demand and how confident consumers feel still set the limits. He makes a narrower point too. China can lean on foreign buyers when its own households won't spend, but if the U.S. economy stumbled, no outside source of demand would rescue it.
What to make of it
For anyone tracking the energy transition, the useful part is the car data. It suggests the oil shock is speeding up adoption of electric cars and plug-in hybrids mainly outside China, through Chinese exports. It also explains why China's trade surplus in clean technology keeps growing. The article does not say which countries are buying, how trading partners are responding with tariffs or other trade policy, or how long the jump might last if oil prices fall. Those are the questions to watch in the next few months of data.
Remember
China's exports of fully battery-electric cars rose 130% in September and plug-in hybrid exports rose more than 200%, far outpacing sales growth.
With spending at home weak, China's growth now depends on foreign buyers of chips, ships, cars, solar panels and batteries.
The article gives only growth rates, with no volumes or destination countries, so the size of these flows is unclear.