AI power demand is testing gas, batteries and public patience, while Massachusetts pushes storage and North American farms plow up grassland.
Picked from 28 new articles across 13 sources · arrow keys for other days
Today in 30 seconds
30s left
Off-grid gas plants for data centers would emit 63–80% more than grid power. The gap narrows only on coal-heavy grids like Cheyenne's. story 1 ↓
Massachusetts adds payments and faster permits to back its 10 GW battery goal, but grid hookup bills above $200 million are killing projects. story 2 ↓
Cropland is replacing about 1.8 million acres of North American grassland a year. Canada converts the most, and Mexico is growing fastest. story 3 ↓
Grid planners still doubt home-battery fleets can replace substations. They ask who covers the gap if the devices are gone in ten years. story 4 ↓
Local opposition to data centers dipped for the first time but is still 71%. Republican support rose from 23% to 34% since August. story 5 ↓
Experts say Lula's re-election makes it more likely Brazil ends Amazon deforestation, and it boosts confidence in a new global rainforest fund.
1/5The Climate Brink· Zeke Hausfather· Oct 26
Off-grid gas for data centers emits 63–80% more than grid power
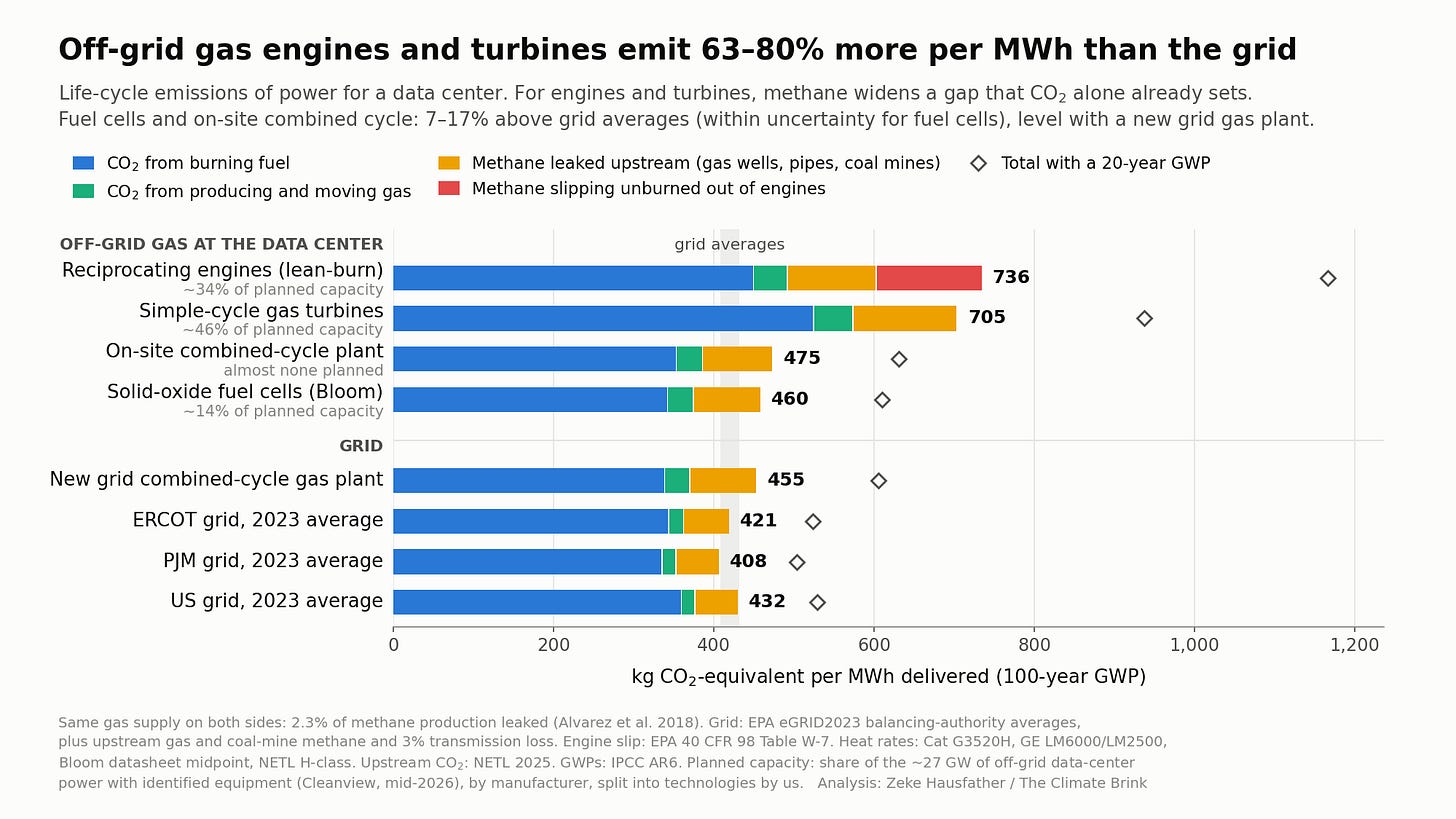
Zeke Hausfather compared emissions per megawatt-hour from on-site gas generators with grid power. The engines and simple turbines most off-grid data centers plan to use emit 63–80% more than the US grid average.
Why it matters · Data center demand is pushing developers to build their own gas plants, and these choices could lock in high-emitting generation for decades while the grid itself gets cleaner.
Know this first
Context from the editor, not the article · 29 sec
1 · Behind-the-meter generation
Power produced on site and used directly, without going through the utility grid. Data centers build it, often as gas generators, when grid connection queues run for years or the local grid lacks spare capacity.
2 · Simple vs combined cycle
A simple-cycle gas turbine burns gas and vents its hot exhaust. A combined-cycle plant uses that exhaust to make steam and drive a second turbine. That raises efficiency from about 35% to roughly 55–60%, so it burns less gas per megawatt-hour.
3 · Methane in CO2-equivalent
Methane that leaks or escapes unburned traps far more heat than CO2 over the short term. Climate accounting converts it to CO2-equivalent, so small leak rates add a lot to a gas plant's footprint.
2/5Canary Media· Sarah Shemkus· Oct 26
Massachusetts backs its 10-gigawatt battery target with payments and faster permits
Massachusetts wants 10 gigawatts of grid batteries by 2035, the highest target of any state. Peak-hour payments, state-level permitting and state-run purchasing are drawing large projects, but grid connection costs and local opposition are slowing them.
Why it matters · Massachusetts is testing whether policy alone can bring large-scale storage to a cold, expensive, old grid, which many non-sunbelt states would need to do too.
Know this first
Context from the editor, not the article · 27 sec
1 · Power versus energy
Battery size is quoted two ways: megawatts (MW) say how fast it can discharge, megawatt-hours (MWh) say how long. The article gives only MW, so it doesn't say how many hours each project lasts.
2 · Who runs New England's grid
ISO New England is the nonprofit grid operator for six states. Large projects must enter its interconnection queue, where studies decide which grid upgrades each one must pay for before it can connect.
3 · Why batteries pay
Grid batteries earn money by charging when power is cheap, often when solar output is high, and discharging at peak demand. They can also be paid for capacity and backup services. Thin margins make extra revenue streams decisive.
3/5Inside Climate News· By Georgina Gustin· Oct 26
Cropland is plowing up about 1.8 million acres of North American grassland a year
A new World Wildlife Fund survey of Mexico, the US and Canada finds about 1.8 million acres of grassland turned into cropland in 2023, mostly for corn, soybeans and wheat.
Why it matters · Grassland soils store a lot of carbon, and much of the US corn and soy grown on newly plowed land ends up as ethanol and biodiesel. That links biofuel policy to land-use emissions.
Know this first
Context from the editor, not the article · 28 sec
1 · Carbon underground
Prairie grasses keep most of their carbon in deep roots and soil, not in trunks and leaves as forests do. A grass fire leaves much of that store intact. Plowing breaks the soil open and lets microbes release the carbon as CO2.
2 · What Plowprint is
Plowprint is a report the World Wildlife Fund (WWF), a conservation group, has published every year since 2014. It uses land-cover data to map where intact grassland has been converted to cropland.
3 · Policy that shapes plowing
US farm policy changes the economics of breaking new ground. Federally subsidised crop insurance lowers the risk of farming marginal land, and biofuel blending mandates hold up demand for corn and soybeans.
4/5Latitude Media· Maeve Allsup· Oct 26
Grid planners still doubt home-battery power plants can stand in for substations
At an Austin conference, utility planners said they still can't trust networks of home batteries and smart devices to replace substations that take a decade to build. Companies selling those networks laid out how they plan to win that trust.
Why it matters · Demand from AI data centers is growing, and if home-device fleets can't count as long-term capacity, utilities will fall back on slow, expensive poles, wires and gas plants.
Know this first
Context from the editor, not the article · 26 sec
1 · What a VPP is
A virtual power plant (VPP) is software that links thousands of home batteries, thermostats, heat pumps and EV chargers. The grid can then call on them together to cut demand or supply power at peak times.
2 · Firm capacity
Grid planners must prove they have enough supply for the worst peak hours for years ahead. A resource counts as "firm" only if they can rely on it being there when called, year after year.
3 · Why now
US electricity demand is rising again, driven mostly by data centers for AI. Building new plants and substations takes years. Devices already sitting in homes could be enrolled within months.
5/5Heatmap· Robinson Meyer· Oct 26
US opposition to local data centers eases slightly, but 71% still object
A Heatmap Pro poll run by Embold Research finds 71% of Americans would oppose a data center near their home. That is down from 75% in August, the first sign the backlash may be levelling off.
Why it matters · Local consent is now a real limit on the AI-driven rise in electricity demand: $260 billion of proposed data centers were canceled this year after local opposition.
Know this first
Context from the editor, not the article · 28 sec
1 · Why data centers are an energy story
AI computing facilities draw huge, constant amounts of power. They are driving the first sustained growth in US electricity demand in decades, and they raise local worries about grid strain, power bills, water use, noise and land.
2 · Who ran the poll
Heatmap is a climate and energy news outlet. Heatmap Pro is its paid data service, which tracks local opposition to energy and infrastructure projects. Embold Research, a polling firm, ran this survey for it.
3 · Margin of error
A poll of a sample carries a margin of error. A change smaller than that margin could be sampling noise and not a real shift. The article does not give this survey's margin or sample size.
Emissions per megawatt-hour of four on-site gas technologies against ERCOT, PJM and US grid averages.1 / 2
Zeke Hausfather, a climate scientist who writes The Climate Brink, has estimated how much more an off-grid data center emits than one plugged into the grid. The answer: about 63–80% more for the gas equipment most of these projects plan to use.
He was prompted by a Catalyst podcast episode. On it, Olya Irzak of Frost Methane, a methane-abatement company, estimated that 50 GW of new 1 gas (on-site generation that bypasses the grid) could emit 380 million tonnes of 2 over 18 months once methane leaks are counted.
What developers are building
3 tracks planned behind-the-meter projects. Weighted by planned size, its data shows this mix of equipment:
simple-cycle turbines: about 46%
reciprocating (piston) engines: about 34%
fuel cells: about 14%
unidentified: about 6%
on-site combined-cycle plants: effectively none
Only about 30% of planned capacity has named equipment, so Hausfather treats the split as directional.
The numbers
He used national grid averages for 2023 from 4, the EPA's power-plant emissions database. These include the grid's own gas leaks, coal-mine methane and 3% line losses. Against them:
Reciprocating engines emit about 740 kg CO2e per MWh.
Simple-cycle turbines emit about 705 kg.
That is 63–80% above average power in 5 (Texas's grid), 6 (the mid-Atlantic grid) and the US overall. Methane leaks account for 70–190 kg/MWh of that gap. Even on CO2 alone, the gap is 31–63%, because this equipment turns gas into electricity inefficiently.
Engines add 7: about 2.8% of the fuel passes through unburned, against roughly 0.02% for modern turbines. Hausfather also calls his assumption of 2.3% upstream leakage generous to off-grid gas.
Fuel cells, mostly from Bloom, and on-site combined-cycle plants come within 7–10% of the US grid average. That is about what a utility would build to serve the same load. Few projects choose them, because build times are longer or equipment is scarce.
Location matters
Hausfather reran the comparison for seven data-center hotspots. He used 2025 grid data and leak rates measured from aircraft and satellites in each local gas basin. Engines and turbines beat the local grid's emissions in only one place. In the other six they emit 36–95% more.
The exception is Cheyenne, Wyoming, where coal still supplies nearly 60% of power. There, engines and turbines roughly match the grid average, but they still emit 55–64% more than a new grid-connected combined-cycle plant would.
The lock-in problem
Gas plants on the grid can throttle down when cheap renewable power is available. Isolated generators can't, unless they add solar or later connect to the grid. Developers would rather connect, since off-grid systems need extra backup capacity and cost more to run. They build off-grid because grid connections take too long.
Hausfather's fixes:
faster grid expansion with clean generation, transmission and storage
enforcing air-pollution rules on off-grid plants
adding on-site solar and batteries
cutting gas leaks, though the Trump administration has rolled back many leak rules
His code and data are on GitHub.
Zeke Hausfather, a climate scientist who writes The Climate Brink, has put numbers on a question raised by the data-center buildout. How much worse is it, in emissions terms, when a data center powers itself with on-site gas instead of connecting to the grid? For the equipment most developers are actually planning to use, his answer is about 63–80% worse than average grid power.
Where the question came from
Hausfather was prompted by an episode of the energy podcast Catalyst. On it, Olya Irzak of Frost Methane, a company that works on methane abatement, estimated that 50 GW of new 1 gas could produce 380 million tonnes of 2 over 18 months once methane leaks are included. Behind-the-meter gas means generation built on site and used directly, bypassing the utility grid.
Hausfather calls this a real problem with an achievable near-term fix. If data centers are going to be built, he argues, they should be connected to the grid rather than running on what he calls "dirty off grid gas generators."
The problem has three parts, and they stack:
Developers are choosing the least efficient kinds of gas generation.
Some of that equipment lets fuel escape unburned.
Many projects sit in gas-producing regions where upstream leakage is high.
What is being built
Hausfather drew on 3's tracker of behind-the-meter projects. Weighted by planned data-center size, the equipment mix is:
simple-cycle gas turbines: about 46%
reciprocating engines (large piston engines, like a scaled-up car engine): about 34%
fuel cells: about 14%
unattributed: about 6%
on-site combined-cycle plants: effectively 0%
Only about 30% of planned capacity has identified equipment, so he treats the split as directional rather than precise.
The efficiency difference matters. A simple-cycle turbine burns gas and vents its hot exhaust. A combined-cycle plant recovers that heat to make steam and drive a second turbine, so it needs much less fuel per megawatt-hour. Hausfather's heat rates, a measure of fuel burned per unit of electricity, come from manufacturer data sheets for the equipment that appears in the tracker.
The national comparison
For the grid side, he used 2023 averages from 4, the EPA's database of power-plant emissions, for three grids: 5 (Texas), 6 (the mid-Atlantic and Midwest grid operator) and the US as a whole. Those grid figures are deliberately conservative. They include:
the grid's own upstream gas leaks
methane from coal mines
3% transmission losses
All three push the grid number up. For off-grid gas, he assumed a national-average 2.3% upstream leak rate, based on Alvarez et al. 2018, a widely cited study of US oil and gas methane. He calls this assumption generous to off-grid gas.
On top of upstream leaks comes 7: fuel that passes through an engine without burning and leaves in the exhaust as methane. In reciprocating engines this happens in three ways:
Some fuel-air mixture gets trapped in small gaps around the pistons where the flame can't reach.
Some blows straight through while the intake and exhaust valves are both open.
The lean fuel mixtures these engines run to cut NOx (nitrogen oxide pollutants) burn less completely.
EPA reporting factors for four-stroke lean-burn engines put slip at about 2.8% of the methane going in. Modern gas turbines slip only about 0.02%. Slip rises when engines run at partial load, and Irzak said she has seen measurements as high as 12%. Off-grid data centers are expected to run near full output, so Hausfather uses the standard factor.
The results:
Option
kg CO2e/MWh
vs. grid
Reciprocating engines
~740
63–80% above ERCOT, PJM and US averages (with turbines)
Simple-cycle turbines
~705
63–80% above ERCOT, PJM and US averages (with engines)
Fuel cells / on-site combined cycle
not given
7–10% above US average
Methane, including slip, contributes 70–190 kg/MWh of the gap. Even ignoring methane entirely, engines and turbines emit 31–63% more CO2 than the grid, because they convert gas to electricity inefficiently.
Fuel cells and on-site combined-cycle plants come much closer. Fuel cells are mostly from Bloom Energy, about 14% of identified capacity. At 7–10% above the US average, they are comparable to what a utility would build to serve the same load. They are rarely chosen today because of longer build times or limited equipment availability.
Why the gap could widen
US grids are getting cleaner as renewables are added. Grid-connected gas plants can lower their 8 (how much of the time they run) when cheap wind and solar are available. An islanded generator serving a data center can't do that unless the site adds its own renewables or later connects to the grid. Hausfather sees a real risk that off-grid gas gets locked in for long periods while the rest of the system decarbonizes. If so, today's 63–80% gap understates the gap over a plant's lifetime.
The regional rerun
Off-grid projects cluster in a few regions, and both grid mix and gas leakage vary a lot by place. Hausfather redid the comparison for seven hotspots in Cleanview's tracker.
Grid side: 2025 averages from the EIA's hourly grid data, counted on a consumption basis so that imported power is included.
Gas side: a leak rate for each region, taken from aircraft and satellite surveys of the basin most likely to supply it. Sources include MacKay et al. 2026 and Varon et al. 2026. All basin leakage is charged to gas production, even where the gas comes up as a byproduct of oil wells.
Engines and simple-cycle turbines emit more than the local grid in six of the seven regions, by 36–95%.
The exception is Cheyenne, Wyoming, where coal still generates nearly 60% of grid power. There, engines and turbines roughly match the grid average. But they still emit 55–64% more than a new grid-connected combined-cycle plant would, and that is the realistic alternative for new load. Hausfather adds that large new loads can delay coal-plant retirements, which would make connecting there worse than the average suggests.
What he recommends
Hausfather notes that developers generally prefer grid connections. Off-grid systems need extra redundancy, and low-efficiency generators running constantly are an expensive way to make power. Developers go off-grid because interconnection takes too long or the grid lacks spare generation.
His prescriptions:
Long term: sturdier grids, with new low-carbon generation, modernized transmission and a lot of grid-scale storage.
Meanwhile:
hold off-grid plants to existing air-pollution rules
encourage on-site solar and storage alongside gas
pursue broader cuts to gas leakage, many of which he notes the Trump administration has rolled back
Open questions
The equipment mix rests on the 30% of capacity with identified hardware.
The post doesn't say which time horizon it uses to convert methane to CO2-equivalent. That choice strongly affects how much leakage counts.
It doesn't name the seven hotspots beyond Cheyenne in the text, or give each region's figures.
It doesn't reconcile Irzak's 380-million-tonne figure with its own per-MWh numbers.
Code and data are on Hausfather's GitHub.
Remember
Even ignoring methane entirely, off-grid engines and turbines emit 31–63% more CO2 than grid power, purely from inefficiency.
Fuel cells and on-site combined cycle come within 7–10% of the US grid, but few projects choose them.
Even in coal-heavy Cheyenne, off-grid engines emit 55–64% more than a new grid-connected gas plant.
Gov. Maura Healey celebrates the late-2024 climate law whose permitting reforms now cover large batteries.
Massachusetts is seeing a wave of large battery projects. Near Boston, Jupiter Power plans to start building its 700-megawatt Trimount facility next year, which would be far larger than any other battery in New England. Next door, a 250-MW project has closed $850 million in financing. Near the Rhode Island border, a 200-MW battery should be running by the end of this year.
The target
The state wants 5 gigawatts of battery storage by 2030 and 10 GW by 2035. Of the 13 states with storage targets, that is the highest. California leads on installed capacity, with about 23 GW. Massachusetts has been working on storage since a 2015 initiative under Republican Gov. Charlie Baker, and it beat that program's 1 GW goal with more than 1.6 GW installed. The state's case is that batteries can store cheap, clean power, often midday solar, and discharge it at demand peaks. That would reduce reliance on costly, dirty peak plants in a state with some of the nation's highest power prices.
What is driving it
1 (2020): the first program of its kind in the US. It pays storage and renewable owners for delivering power during peak hours. A battery-industry lawyer calls the credits "incredibly important" to financing.
State permitting: since July 1, the state 2 can approve projects of 100 MW or more, replacing separate town-by-town processes. It must decide within 15 months.
State procurement: in December 2025 the state picked four projects totalling 1.3 GW to negotiate long-term utility contracts. A second round drew 35 bids, and winners are due in February.
Developers say the stability of these rules matters most, because permitting and contracting take years.
What is getting in the way
Grid connection costs. A 125-MW battery in Tewksbury was cancelled in September after the required grid upgrades came to $65 million, about $520 per kilowatt. 3, the regional grid operator, studied a batch of proposed projects and found many upgrade estimates above $200 million. Advocates blame the region's old grid and expect a fight over who should pay.
Local opposition. Residents of Oakham are fighting a 180-MW project, fearing a fire could contaminate a drinking-water reservoir. Similar fears helped kill a project in Westfield last year. A state-energy-agency coalition argues that headline fires such as 4 in California involved older technology than current systems use.
The article gives sizes only in megawatts, not hours of storage, so it doesn't say how long these batteries could carry a winter evening peak.
Massachusetts is seeing a wave of large battery projects. Just outside Boston, Jupiter Power plans to start building its 700-megawatt Trimount facility next year, which would be far larger than any other battery in New England. One town over, another company has just closed $850 million in financing for a 250-MW battery. Near the Rhode Island border, a 200-MW project has broken ground and is expected to run by the end of this year. About half a dozen more projects are at various stages.
Canary Media's Sarah Shemkus reports that the pipeline follows from deliberate state policy. Massachusetts aims for 5 gigawatts of battery storage by 2030 and another 5 GW by 2035. Thirteen states have storage procurement targets, and Massachusetts' 10 GW is the largest of them. Installed capacity is a different ranking: California already has about 23 GW.
Why a cloudy state wants batteries
Massachusetts has aggressive clean-energy goals and some of the highest electricity prices in the US. The state's case is that batteries help with both. They charge when power is cheap and clean, such as midday solar surpluses, and discharge during demand peaks, when the grid would otherwise run its costliest and dirtiest plants. They can also reduce outages during extreme weather. Elizabeth Mahony, commissioner of the state Department of Energy Resources, describes storage as a tool to "manage our load" by deploying it at different times.
The effort is not new. In 2015, then-Gov. Charlie Baker, a Republican, launched the Energy Storage Initiative. Its target of 1 GW by 2025 was beaten, with more than 1.6 GW installed. Even so, reaching 5 GW by 2030 means roughly tripling that in about four years.
Three policies doing the work
Peak payments. The 1, in force since 2020 and the first program of its kind in the country, pays renewable generators and storage owners for delivering power during peak-demand hours. In practice it issues credits that utilities must buy. This adds revenue on top of the usual buy-low, sell-high margin. Aaron Lang, a partner at Boston law firm Foley Hoag who represents several battery developers, calls the credits "incredibly important to financing and developing these projects."
One permitting authority with a deadline. Since July 1, the state 2 can approve large energy projects, including storage of 100 MW or more. Developers no longer have to work through each municipality's separate permitting process, and the board must decide within 15 months of an application. Lang says this makes the state more attractive to developers.
State-run procurement. The state runs solicitations, meaning competitive bidding rounds whose winners negotiate long-term contracts with the major utilities. In December 2025 it picked four projects totalling 1.3 GW. A second round closed this month with 35 bids, and winners are due in February. A utility contract gives developers predictable income they can borrow against.
Hans Detweiler, Jupiter Power's vice president of development, says the main value of this framework is stability. Permitting and solicitations take years, so developers need to trust that the rules won't change partway through.
What is not working yet
Interconnection costs. This is the most pressing problem. In September, developers cancelled a 125-MW battery in Tewksbury after learning the grid upgrades needed to connect it would cost $65 million. That works out to about $520 per kilowatt of capacity, before any batteries are bought. Tewksbury was at the low end. 3, the region's grid operator, recently studied likely 4 costs for a batch of proposed projects, most of them Massachusetts batteries, and many estimates exceeded $200 million. Erin Smith, energy and grid policy director at the Environmental League of Massachusetts, says those figures were "quite a bit higher than developers anticipated." She points to New England's older grid, which genuinely needs upgrades to absorb a surge of batteries. Who pays is unsettled. Under the current approach the connecting developer usually bears most of the cost, and Smith expects a fight over whether that should change.
Local opposition. Residents of Oakham, in central Massachusetts, are fighting a proposed 180-MW battery. They fear a fire could contaminate a nearby reservoir that supplies drinking water to dozens of communities. Similar concerns helped sink a project in Westfield last year. Opponents often cite the 2025 fire at 5, California. Todd Olinsky-Paul of the Clean Energy States Alliance, a coalition of state energy agencies, argues these fears don't match current safety. He says the high-profile fires almost all involved a different technology from today's installations, and that safety protocols have improved. The article doesn't name the chemistries. The general industry shift has been from nickel-based lithium-ion cells to 6, which is less prone to runaway heating. Supporters hope transparency and public education will reduce opposition. The article offers no evidence yet on whether that works.
Open questions
The article leaves several things unresolved:
Overlap. The named projects total about 1.15 GW. Combined with the 1.3 GW of selected contracts and the existing 1.6 GW, the state could plausibly approach 5 GW. But the article doesn't say how much these figures overlap or which projects hold contracts.
Duration. All capacities are given in MW, with no MWh figures. It's unclear how long these batteries can cover a winter evening peak, which matters a lot in New England.
Upgrade costs. It isn't clear whether $200-million-plus upgrade bills will be spread across ratepayers, trimmed by better grid planning, or left to sink more projects like Tewksbury.
Lang says he is optimistic the challenges can be overcome. The 2030 target will show whether permitting reform and peak payments can outweigh the costs of an old grid.
Remember
Massachusetts' 10 GW storage target by 2035 is the largest of the 13 states with such goals.
Grid upgrade bills, often above $200 million per project in a recent study, are now the main bottleneck.
The state replaced town-by-town permitting with one state board and a 15-month decision deadline for projects of 100 MW or more.
The 1 has published its first survey of grassland loss covering all three North American countries. It runs from the Chihuahuan Desert in Mexico, across the US Great Plains, to Canada's 2. Using datasets built for each region, the researchers found that about 1.8 million acres of grassland became cropland in 2023, mostly for corn, soybeans and wheat.
Where the losses are
The survey is the latest edition of 3, WWF's yearly map of grassland converted to farmland. It is the first edition to cover all three countries, with data going back to the 1980s. Cropland expanded in every country, but at different rates and for different reasons:
United States: more than 2 million acres converted between 2020 and 2024, roughly half of it in the Great Plains, driven by corn and soybeans. The report says US expansion has slowed compared with earlier waves of farm expansion. The US has already lost about 70% of its grasslands to farming and development.
Canada: the largest area lost, 4.7 million acres between 2019 and 2023, mostly to wheat.
Mexico: the fastest relative growth, with more than 1 million acres lost, about 7%. The article doesn't say over which years.
Most of the US corn and soy goes to cattle feed or to ethanol and biodiesel. WWF analyst Sarah Olimb says most conversion happens on fertile land in the Great Plains and the 4, but 5 is being plowed too.
Why carbon is at stake
Great Plains grasslands hold about 34% of the region's carbon. Because most of it sits in deep roots, it is safer from fire than forest carbon. Cultivation is the bigger threat: these soils lose about 70% of their carbon once plowed. The article gives no figure for the emissions from the 2023 losses.
What advocates want
WWF and the 6, a group of conservation organisations formed in 2023, want stronger protections and fewer incentives to plow. They name the US Department of Agriculture's crop insurance program as one such incentive. They also back the 7, which would fund tribes to keep and expand bison herds. Bison grazing helps keep grassland healthy.
Caveats
The figures are hard to line up. The article calls 1.8 million acres "roughly twice the size of Chicago," but it is about 2,800 square miles, more than ten times Chicago's roughly 230. The country figures cover different multi-year windows and don't obviously add up to the yearly total. WWF plans maps at the state and provincial level, which may clear this up.
The 1 has published the first survey of grassland loss that spans all three North American countries. It covers the grass and shrub country from the Chihuahuan Desert in northern Mexico, across the US Great Plains, to Canada's 2. Using datasets built for each region, the researchers estimate that about 1.8 million acres of grassland were converted to cropland in 2023. Most of it went to three commodity crops: corn, soybeans and wheat. Inside Climate News reporter Georgina Gustin describes the work. The article is short and does not explain the report's methods in detail, so neither can this summary.
The problem: an ecosystem with few protections
The US has already lost about 70% of its grasslands to farming and development. Forests get legal and public attention; grasslands get much less, and advocacy groups call them the world's most imperiled ecosystem. Suzy Friedman, who oversees Great Plains policy at WWF, argues that grasslands are undervalued for what they provide: grazing for agriculture, carbon storage, water quality, wildlife habitat and recreation. They also underpin many rural and tribal communities.
Grasslands are hard to protect because the land is fertile, mostly private and easy to plow. Unlike clearing a forest, plowing a prairie leaves no stumps or smoke. One season it is pasture, the next it is a cornfield. Conversion can be steady and spread across thousands of farms without anyone noticing, which is why mapping it matters.
What the survey is
WWF has produced its "3" analysis every year since 2014. It tracks where intact grassland has been plowed for crops. The 2026 edition is the first to cover Mexico, the US and Canada together, and the first to use data going back to the 1980s. The article says each region was analysed with its own datasets. It does not name the satellite products or classification methods, or give error margins.
The numbers, country by country
Cropland grew in all three countries, but at different speeds and for different reasons.
United States. Corn and soybeans drove the conversion of more than 2 million acres between 2020 and 2024, about half of it in the Great Plains. That averages roughly 500,000 acres a year (my arithmetic, not the report's). The report says this pace is slower than "earlier periods of agricultural expansion." Most of that corn and soy feeds cattle or becomes ethanol and biodiesel. For an energy reader, that ties US biofuel policy directly to prairie loss. Sarah Olimb, a WWF spatial analyst, says conversion is concentrated in the Great Plains and 4, on the most fertile ground, as expected. Marginal land is being plowed as well, though: soil that is less productive and often less suited to crops.
Canada. Canada lost the largest area: 4.7 million acres between 2019 and 2023, mostly to wheat in the Prairie Provinces (Alberta, Saskatchewan and Manitoba). That is close to 1 million acres a year on average.
Mexico. Mexico lost more than 1 million acres of grassland to crops, a rate of about 7%. That is the largest relative change of the three, and the authors read it as a sign that industrial-scale farming is expanding quickly there. The article doesn't say which years the figure covers.
A check on the figures. The article says the 1.8 million acres is "roughly twice the size of Chicago." By my arithmetic, 1.8 million acres is about 2,800 square miles, more than ten times Chicago's land area of roughly 230 square miles and closer to the size of Delaware. The country figures also use different multi-year windows and don't obviously sum to the 2023 total. Read these as rough magnitudes until the full report's tables are checked.
The carbon mechanism
Grasslands in the Great Plains hold about 34% of the region's carbon. The way they store it matters. Prairie plants put most of their carbon into deep roots and the soil. Forests hold most of theirs in trunks and leaves above ground. So grassland carbon is relatively safe from wildfire: a fire burns off the grass, but the stock underground stays put.
Plowing is the opposite. Breaking the sod exposes buried organic matter to air, and soil microbes turn it into CO2. The article says these soils lose about 70% of their carbon once cultivated. It doesn't say over what period. Soil-carbon losses usually play out over years to decades, not all at once. The article also gives no estimate of the emissions from the 2023 conversions. To make one you would need carbon stocks per acre for each region, which the article doesn't provide.
Policy levers and alternatives
Advocates want two things: stronger protections for grassland and weaker incentives to plow it. They name the US Department of Agriculture's crop insurance program. Federally subsidised insurance lowers the financial risk of planting crops on 5, so it can make conversion pay. Friedman says the lack of attention to grasslands prompted the recent US Grasslands Campaign. That public awareness effort comes from the 6, a group of conservation organisations formed in 2023.
A second strand runs through tribal land, where much of the country's remaining bison herd grazes. The proposed 7 would fund tribes and organisations that keep buffalo and help tribes start new herds. That would expand the grazing land under protection. Friedman calls tribes "amazing stewards of bison," and bison grazing supports grassland health.
The article doesn't weigh the trade-offs. It doesn't say how much crop production, farm income or biofuel feedstock would be lost if conversion slowed, or what share of the conversion biofuel demand causes compared with feed or exports. It also doesn't say whether some converted land is later returned to grass, which would make the net loss smaller than the gross figures.
What comes next
WWF plans to make future editions more detailed, tracing what drives grassland loss in each state and province. It also plans interactive maps so users can pick an area and see trends over time. That data should help answer the questions this summary leaves open: which policies and markets push conversion where, and whether the slowdown in the US is lasting.
Remember
Canada lost the most grassland acreage (4.7 million acres in 2019–2023), mostly to wheat, not corn or soy.
Prairie carbon sits mostly underground, so it survives fire but loses about 70% once the soil is plowed.
Much US conversion feeds biofuels and cattle, so energy and farm subsidies shape how fast prairie disappears.
Residential 1 are software-linked fleets of home batteries, smart thermostats, heat pumps and EV chargers that the grid can call on together. Their backers argue that AI-driven load growth has opened a window for them. But at Latitude Media's Flex Summit in Austin this month, grid planners said the obstacles that have kept VPPs stuck in pilots haven't gone away.
The credibility gap
Brandy Chambers of Eversource, a New England utility, put the problem plainly. A substation takes about 10 years from idea to completion. Suppose a utility skips one and counts on 2, small devices on the customer side of the meter, and those devices aren't there in a decade. "We don't have a plan B," she said. "We cannot overnight build that substation." A substation lasts for decades. A VPP lasts only as long as thousands of households keep participating.
Josh Castonguay of Green Mountain Power in Vermont already uses home batteries to retire fossil "3" plants and defer transmission upgrades. He flagged a different risk: making sure renters, lower-income customers and less tech-savvy customers can take part. He argues programs must lower costs for everyone, not only device owners.
The industry's answers
The catch
Erika Diamond of EnergyHub, which runs VPP software without owning devices, said opening programs to every installer and brand costs data quality and speed, because partners vary in maturity. She still thinks the trade is worth it.
The article reports no data on how VPPs performed when dispatched, how fast customers drop out, or how much capacity planners would credit them with. Those are the numbers that would show whether the gap is closing.
The news
Residential 1 are networks of home batteries, smart thermostats, heat pumps and EV chargers that the grid can dispatch together. Their backers say this is their moment. US electricity demand is climbing again because of AI data centers, and customers are worried about bills. A VPP can grow in months, while a power plant takes years. Some large tech companies have even shown interest in paying for deployments.
At Latitude Media's first Flex Summit in Austin this month, grid planners said the main obstacles are still there. Those obstacles have kept residential VPPs stuck in pilot projects. Maeve Allsup's report from the event covers the planners' doubts and the industry's answers.
The core problem: a 10-year bet on devices that churn
Brandy Chambers, director of distributed energy solutions at Eversource Energy in New England, described what she called a credibility gap. A substation takes about 10 years to go from first idea to finished construction. Suppose a utility delays or cancels one because it is counting on 2, meaning small generation, storage and flexible loads on the customer side of the meter. Then those resources thin out: customers move, unenroll, or let devices fail. "We don't have a plan B," Chambers said. "We cannot overnight build that substation."
The difficulty is a mismatch in time. The physical asset lasts for decades and has a single owner. A VPP's capacity is the sum of thousands of household decisions, and any household can change its mind. Planners need to believe in the fleet's size ten years from now, not just today.
Josh Castonguay is chief innovation officer at Vermont's Green Mountain Power, one of the most aggressive users of home batteries. The utility already uses them to retire fossil "3", plants that run only during demand spikes, and to put off transmission upgrades. Even so, Castonguay pointed to an "underappreciated risk": access. Programs tend to reach homeowners who are wealthier and comfortable with technology. He argues that to last, a VPP has to lower costs for everyone on the system, not just the people who own a battery or smart thermostat.
The industry's playbook
Scale as the argument. Paul Dickson, chief revenue officer of Sunrun, a residential solar-and-battery company, said Sunrun installs as much peak power as a nuclear plant every 11 months. Nuclear plants commonly run around 1 gigawatt, though the article gives no figure. Each home adds only a few kilowatts, he said, but "when you do it a million times" it becomes a large resource. One caveat the article doesn't raise: matching peak power is not the same as matching energy. A home battery usually discharges for a few hours, while a nuclear plant runs around the clock.
Diversity for reliability. Ryan Hledik, a principal at the consultancy 4, said VPPs are moving toward a mix of device types. The more kinds of devices a fleet holds, the more grid problems it can solve. Batteries can shift energy, thermostats can trim air-conditioning peaks, and EV chargers can delay charging. Hledik said this goal is behind many of the current partnerships and acquisitions. His quote is cut off mid-sentence in the published article, so his full reasoning isn't available.
Enrollment by default. Two long-standing problems are slow enrollment and churn, meaning customers dropping out. To tackle them, aggregators (the companies that sign up and coordinate devices) are working through 5, the device manufacturers. Enrollment is built into the setup screens of products like smart thermostats, and customers have to actively opt out rather than opt in. Sarah Russell-Smith of Octopus Energy and Uplight said opt-out programs, including basic 6 (paying customers to cut use at peak times), have gained "a lot more momentum." She called them "a gateway drug" to more advanced flexibility programs.
Longer regulatory commitments. Answering the reliability worry, the article quotes Chambers saying regulators could draw in providers and manufacturers by offering "longer terms and more certainty." Her example was Connecticut, which guarantees incentives for residential battery storage for 10 years. "We hear all the time that the Connecticut model is much more conducive to development," she said. The logic is that a decade of guaranteed payments makes a decade of enrolled batteries more likely, which roughly matches the life of the substation being deferred.
The trade-off on inclusion
Erika Diamond, chief revenue officer at EnergyHub, said inclusion has a cost. EnergyHub is an "7" VPP provider: it runs the software and owns no devices. Opening programs to every installer and device brand means working with partners at very different levels of maturity. That can lower data quality and slow things down. Utilities that want inclusive programs, she argued, "have to then be willing to take some risks that not everything will show up in the same way," though she thinks there is "a lot to be gained."
What's left open
This is a conference recap, not a study. It gives no numbers on how well VPPs actually performed when dispatched, how fast enrollees drop out, or how much capacity planners will credit to a VPP compared with a substation. Those figures would decide whether the credibility gap is closing. The proposed fixes all aim to make device fleets look more like durable assets: default enrollment to grow them, device diversity to make them more dependable, and long-term incentives to keep them around. Whether planners will bet a substation on them is still unproven.
Remember
Planners' main worry isn't whether VPPs work today but whether enrolled devices will still exist a decade out.
Opt-out enrollment built into device setup is the industry's main tool against slow sign-ups and customer churn.
Connecticut's 10-year battery incentive guarantee is held up as the model for giving VPPs substation-length certainty.
Heatmap Pro polling on local data center support and opposition over time, showing the rapid swing.1 / 2
Seventy-one percent of Americans say they would oppose a data center built near where they live. That comes from a new 1 poll (Heatmap Pro is the climate outlet Heatmap's paid data service), run by the polling firm 2 in October 2026. The number is bad news for developers. Still, it is lower than August's 75%, and it is the first sign that one of the fastest swings in recent public opinion may be levelling off.
How fast opinion turned
In September 2025, about 43% of Americans told the same poll they would support a nearby data center, and the public looked roughly evenly split. Eleven months later, 75% said they would oppose one, which the article calls a 32-point shift. Data centers became a defining issue of this election cycle.
The backlash has real costs. Heatmap Pro's reporting suggests most data center projects now face some local opposition. More than $260 billion in proposed data centers have been canceled this year after running into it. Anthropic, the AI company, flagged the infrastructure slowdown in its 3 filing this week.
What changed since August
The drop is small, and the article says it only slightly exceeds the survey's 4. It does not say what that margin is. Almost all of the change came from people who "strongly oppose" data centers: that share fell by four points. In other words, some of the most intense opponents softened. The count of supporters barely moved.
The biggest movement was among Republicans:
Support rose from 23% to 34% after weeks of campaigning by President Trump.
Opposition fell from 66% to 58%.
Independents' views improved by nine points. Democrats are still largely united against data centers, and their improvement was just outside the margin of error. Among men, support rose from 21% to 28%.
Every group the poll tracks still opposes local data centers more than it supports them, across age, race, gender and party.
How to read it
This is one poll, and its change is barely beyond sampling noise. The trend that matters is the stall. Opposition is no longer climbing, but it remains above 70%. For utilities and grid planners counting on data center load, community consent is still a binding constraint. The Republican shift also suggests that how political leaders talk about these projects can move opinion within weeks.
A new 1 poll finds that 71% of Americans would oppose a data center being built near where they live. Heatmap Pro is the paid data service of the climate and energy outlet Heatmap, and 2, a polling firm, ran the survey in October 2026. That is an overwhelming rejection of the facilities behind the AI boom. It is also four points better for the industry than August's 75%. Heatmap's Robinson Meyer argues it suggests "one of the fastest shifts in public opinion in recent memory may be tapering off."
Why this poll matters for energy
Data centers, the warehouses of servers that train and run AI models, are the main reason US electricity demand is growing again after years of being roughly flat. Each large campus can draw as much power as a small city, around the clock. That puts them at the center of arguments about grid capacity, who pays for new transmission and generation, water use, and land. Utilities and grid operators have built forecasts around this load. If communities block the projects, those forecasts and the generation planned to serve them are at risk.
Meyer calls the data center boom the largest infrastructure buildout in recent US history. Local permission has become one of its tightest bottlenecks.
The backlash, in numbers
Heatmap Pro has asked the same question over time, so the trajectory is visible:
September 2025: about 43% would support a nearby data center. Americans looked broadly split.
August 2026: 75% would oppose one, which the article calls a 32-point shift in eleven months.
October 2026: 71% oppose.
The swing helped make data centers a defining issue of this election cycle, and it has changed the projects' economics. Heatmap Pro's reporting suggests the overwhelming majority of data center proposals now face some community opposition. More than $260 billion in proposed data centers have been canceled this year after local pushback. Anthropic, the AI company, flagged the infrastructure slowdown in the 3 filing it made this week, an offering widely expected to be among the largest ever.
What actually moved
The headline change is modest. Meyer notes the drop "only slightly exceeds the survey's 4." The article gives neither the margin nor the sample size, so readers can't judge how solid the shift is. The detail inside the drop matters more. It came from a four-point fall in "strongly oppose" answers. Some of the most intense opponents moved to milder positions, and the total opposed fell with them. Supporters didn't suddenly multiply.
The partisan breakdown shows where the movement happened.
Republicans changed most. In August, 23% said they would support a nearby data center. Now 34% do, an 11-point gain, and opposition fell from 66% to 58%. The article ties this to "weeks of campaigning by President Trump." That points to 5, meaning signals from trusted political leaders, as the driver, though the poll can't prove cause.
Independents improved their view of data centers by nine points over the same period. The article doesn't say exactly how that figure was measured.
Democrats remain largely unified against data centers. Their improvement was just outside the margin of error.
By gender, men warmed noticeably: support rose from 21% to 28%. The article gives no comparable figures for women.
Every demographic group in the poll still opposes local data centers more than it supports them, across age, race, gender and party.
How to weigh it
Read with care, the poll shows a plateau, not a reversal. Three points of caution:
One data point. A four-point move barely beyond the margin of error could partly be noise. A second poll showing the same direction would make the case much stronger.
Movement in intensity, not sides. Softer opposition still counts as opposition when a zoning board meets. A plateau above 70% leaves developers facing local hostility in most places.
Politically driven change can reverse. If Republican views moved because of presidential messaging, they could move back if the messaging changes or if local concerns such as power bills grow.
The poll also doesn't say why people object. Plausible reasons include electricity rates, water, noise, and doubts about the local economic benefit. Each points to a different fix: developers paying for their own grid upgrades, closed-loop cooling that reuses water instead of evaporating it, or community benefit agreements. The article doesn't explore these.
What's still open
For energy planners, the question is whether the stall turns into recovery or holds near 70%. If it holds, the rate of cancellations will shape how much new load actually reaches the grid, and therefore how much new generation and transmission gets built. The $260 billion in cancellations this year is the clearest measure so far of how much public opinion is already reshaping the buildout.
Remember
Opposition to nearby data centers went from a roughly even split in September 2025 to 75% in August 2026.
This month's four-point easing came almost entirely from fewer people saying they 'strongly oppose' data centers.
Republican support rose from 23% to 34% after Trump campaigned. Democrats barely moved.
Scale. Sunrun's Paul Dickson said the company installs as much peak power as a nuclear plant every 11 months, a few kilowatts at a time. One caveat: peak power isn't round-the-clock energy, since home batteries typically run for only a few hours.
Device diversity. Ryan Hledik of the 4 said mixing device types lets a VPP solve more grid problems. He said this is driving much of today's deal-making.
5. Aggregators are building enrollment into device setup screens with manufacturers (6), so customers have to choose to leave. Sarah Russell-Smith of Octopus Energy and Uplight called opt-out programs "a gateway drug" to deeper flexibility programs.
Long-term incentives. Chambers pointed to Connecticut's 10-year incentive guarantee for home batteries, which she said developers find much more workable. That timeline roughly matches the life of the projects VPPs would replace.