Blame the Gas, Not the Green Levies · Morning Gist
Wednesday, October 285 stories · 16 min
Blame the Gas, Not the Green Levies
Today: what actually drives UK energy bills, record ice loss in Greenland, shrinking climate pledges, a US battery boom, and a rising climate death toll ahead of COP31.
Picked from 29 new articles across 13 sources · arrow keys for other days
Today in 30 seconds
30s left
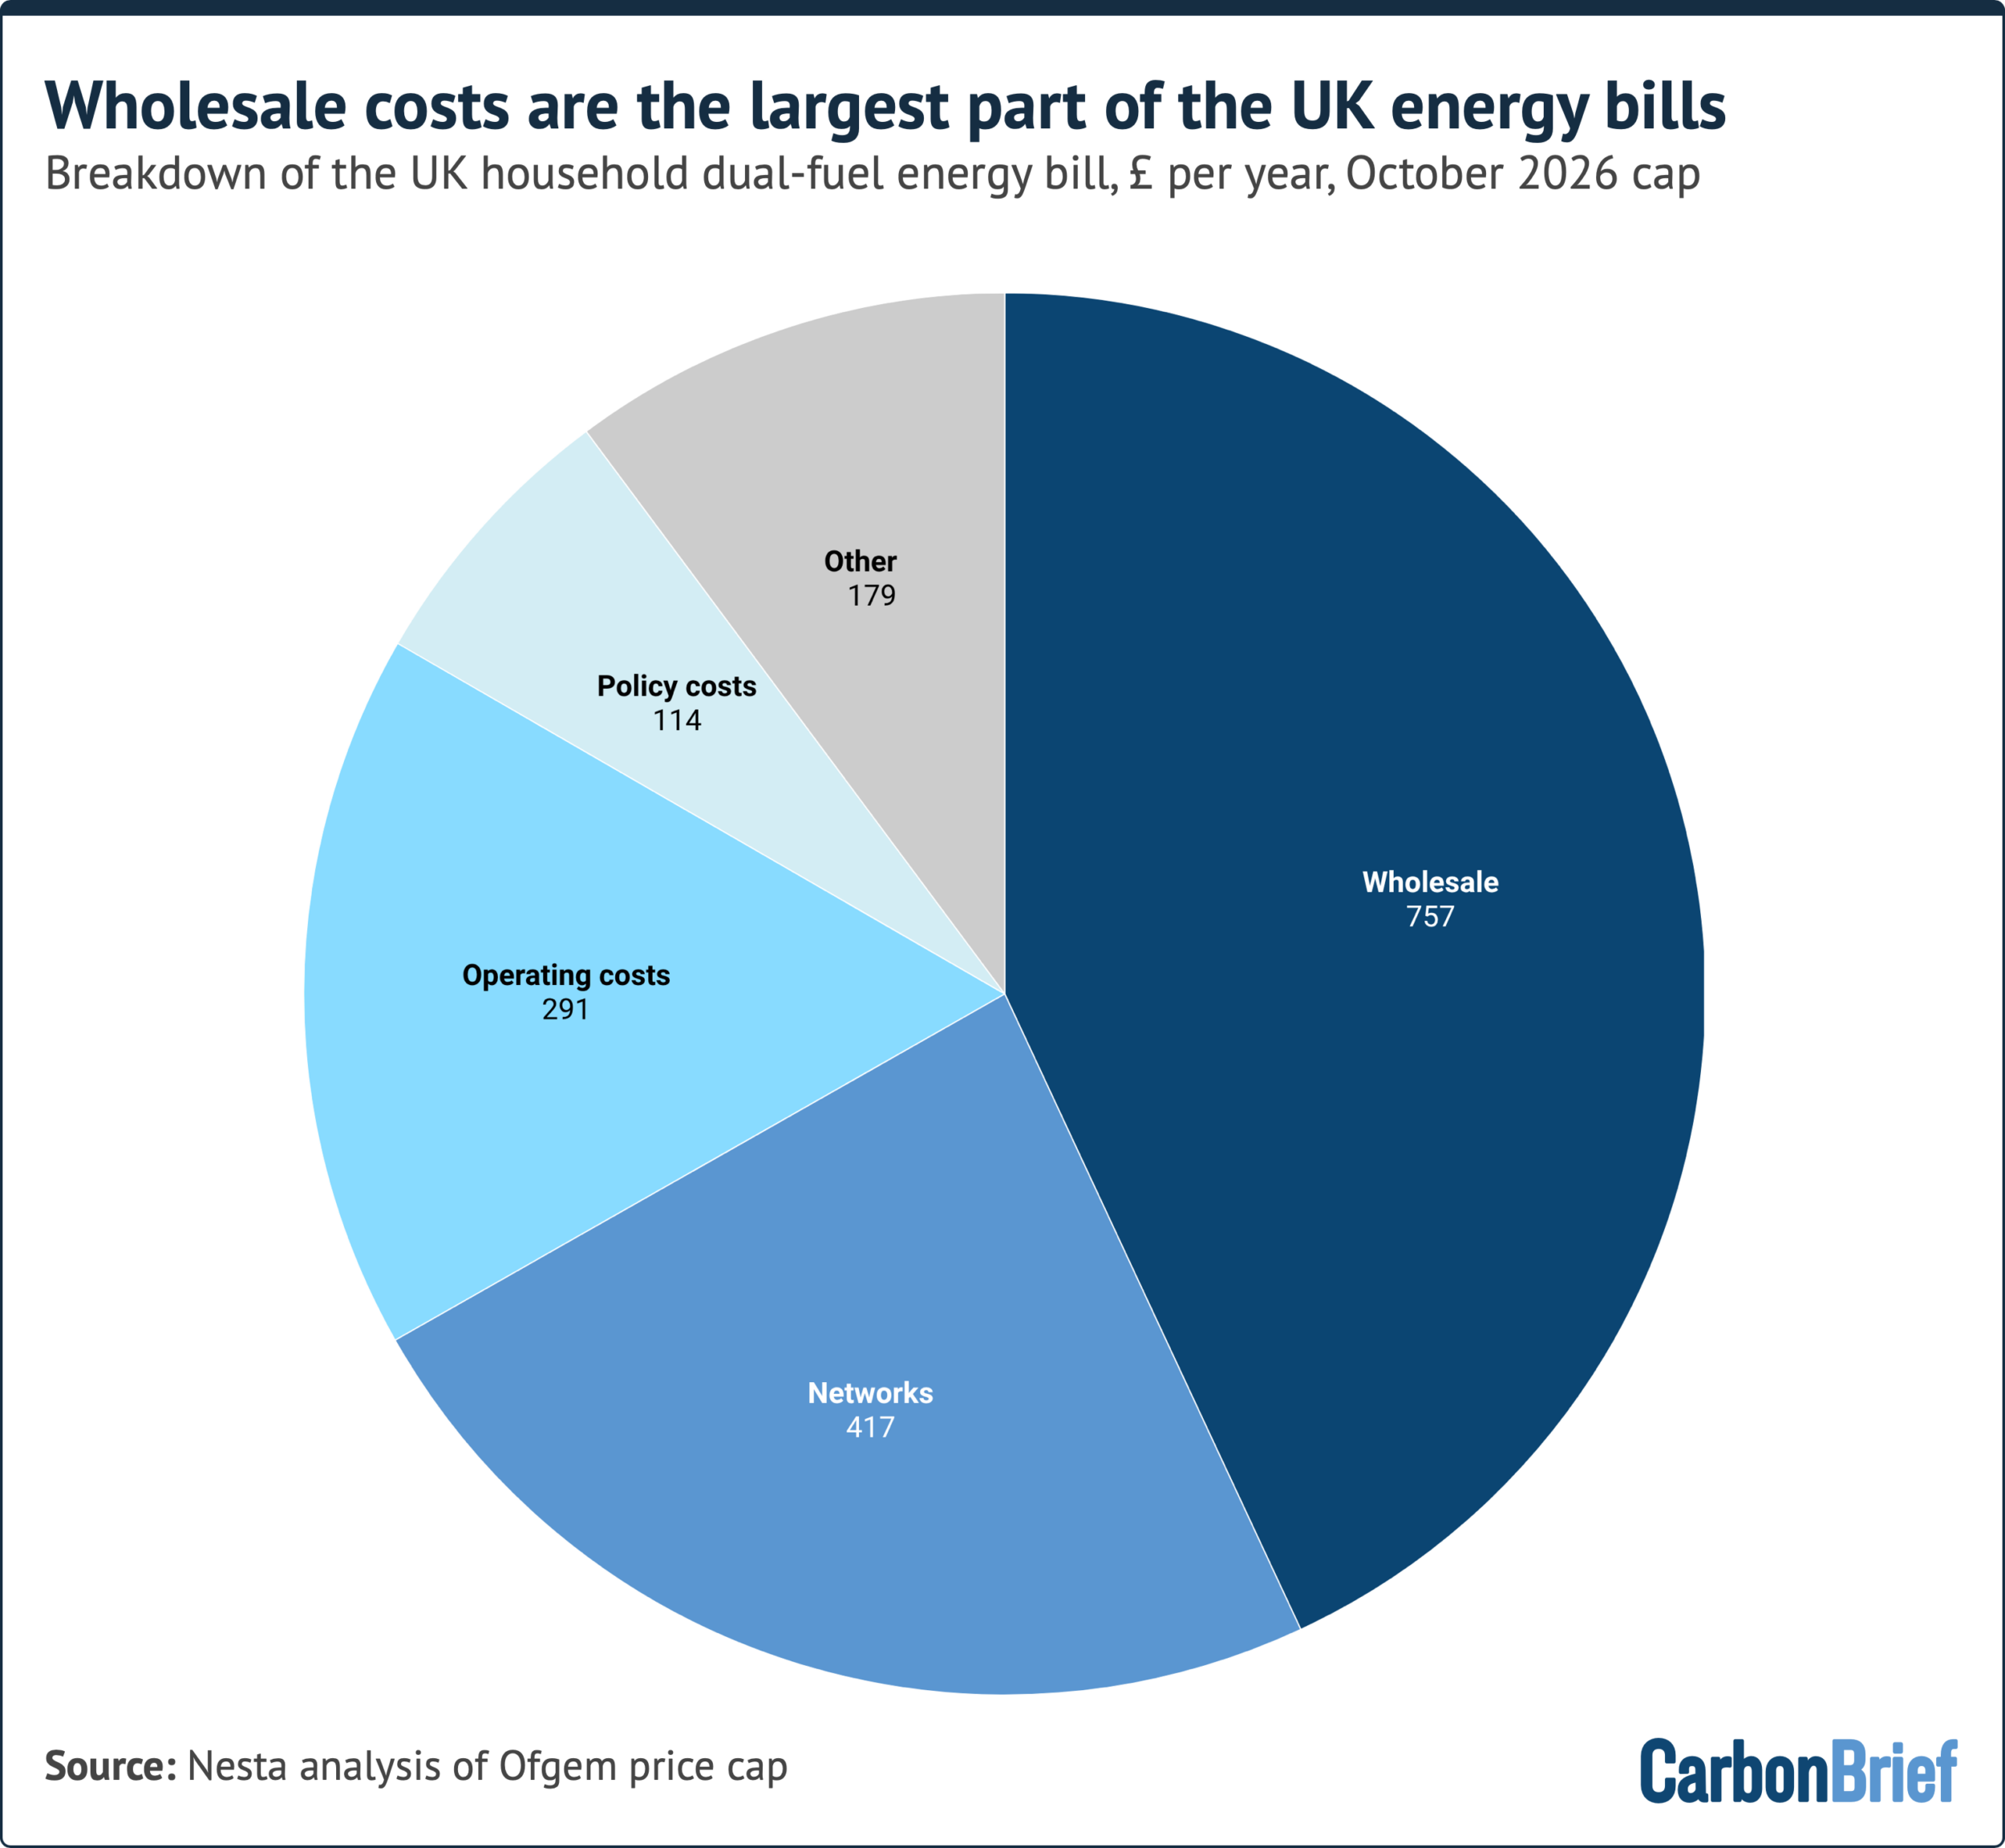
Gas-linked wholesale costs make up 44% of the typical £1,723 UK energy bill. Policy costs are just 7%. story 1 ↓
Greenland lost 135–173bn tonnes of ice, its 30th straight year of loss, despite heavy snowfall and a mild summer. story 2 ↓
UN tally: plans now cover 154 countries, but the projected 2035 cut fell from 12% to 6% below 2019 levels. story 3 ↓
BloombergNEF raised its 10-year US battery forecast by 30%, despite a 40.9% duty on Chinese batteries. Solar pairing and data centres drive demand. story 4 ↓
Lancet: heat killed a record estimated 710,000 people in 2023, and over 70% of those deaths are attributed to human-caused warming. story 5 ↓
EPA proposes easing methane leak rules for oil and gas operators, saving them billions and potentially adding to warming for decades.
1/5Carbon Brief· Carbon Brief Staff· Oct 27
Expensive gas, not green levies, drives most of the rise in UK energy bills
A Carbon Brief analysis finds that gas prices caused more than 80% of the rise in UK household bills since 2020. Grid upgrades come second. Moving levies into taxation, plus electrification, are the main fixes on the table.
Why it matters · The budget debate turns on whether climate policy is pushing bills up. This analysis breaks the bill into its parts, with numbers for each, so the claims can be checked.
Know this first
Context from the editor, not the article · 30 sec
1 · The UK price cap
Ofgem, the energy regulator, caps the unit rates and standing charges suppliers can charge households, and resets the cap every quarter. Headline figures such as £1,723 a year are for a typical home using both gas and electricity.
2 · Marginal pricing
In UK power markets, the last and most expensive plant needed to meet demand sets the price for every generator. That is usually a gas plant, so electricity prices follow gas prices even when most of the power comes from wind.
3 · Two gas shocks
Russia's 2022 invasion of Ukraine sent gas prices soaring, and the government spent more than £60bn supporting consumers. In 2026 the Iran war and the Hormuz crisis more than doubled UK wholesale gas prices again.
2/5Carbon Brief· Carbon Brief Staff· Oct 27
Greenland's ice sheet lost ice for a 30th straight year, despite a mild summer
Danish Meteorological Institute scientists estimate Greenland lost 135–173bn tonnes of ice in the year to August 2026. The summer was not extreme, but losses at the coast outweighed heavy snowfall. Greenland's last net gain was in 1996.
Why it matters · A loss of more than 100bn tonnes in a mild year shows the ice sheet's decline no longer depends on bad weather. That matters for sea-level planning everywhere.
Know this first
Context from the editor, not the article · 27 sec
1 · What 'mass balance' means
An ice sheet's mass balance is snow gained minus ice lost. Losses come from surface melt, icebergs breaking off (calving) and warm seawater melting glacier fronts. A negative balance means the ice sheet is shrinking and sea level is rising.
2 · Why 30 years matters
Climate scientists normally use 30-year periods to tell a real climate trend apart from natural year-to-year swings in weather. A 30-year record running in one direction is hard to blame on chance.
3 · Tonnes to sea level
As a general rule, about 360bn tonnes of ice added to the ocean raises global sea level by roughly 1mm. One year of Greenland losses therefore adds a fraction of a millimetre.
3/5Climate Home News· Matteo Civillini· Oct 27
National climate plans now promise half the 2035 cuts the UN projected last year
The UN's yearly tally of national climate plans now projects global emissions only 6% below 2019 levels by 2035, half last year's 12%. The US exit from the Paris Agreement and weak new pledges drove the drop.
Why it matters · This is the main official scorecard of what governments have promised. Here it shows the gap to 1.5C widening even as more countries file plans.
Know this first
Context from the editor, not the article · 30 sec
1 · What an NDC is
Under the 2015 Paris Agreement, each country submits a nationally determined contribution (NDC): its own emissions target and plan. A new round, with targets for 2035, was due in early 2025. Nothing compels a country to meet its target.
2 · The UN's yearly tally
Each year the UN climate secretariat adds up all submitted NDCs. It estimates where global emissions would land and how much warming that implies. This shows the 'ambition gap' between what has been pledged and what science says is needed.
3 · 1.5C and the IPCC
The Intergovernmental Panel on Climate Change (IPCC) assesses climate science for governments. Its pathways for limiting warming to 1.5C require deep, fast emission cuts this decade and next. Paris set 1.5C as its stretch goal.
4/5Utility Dive· Brian Martucci· Oct 27
BloombergNEF raises its 10-year US battery storage forecast by 30%
BloombergNEF now expects the US to install 30% more energy storage over the next decade than it forecast six months ago, reaching 434 gigawatts by 2036. Batteries paired with solar plants and data center demand drive the increase.
Why it matters · In the US, batteries are now growing faster than solar, and tariffs have not stopped them. That changes how grids will absorb solar power and supply new data center load.
Know this first
Context from the editor, not the article · 29 sec
1 · Power versus energy
Storage is quoted in two numbers. GW (gigawatts) is how much power a battery can deliver at once. GWh (gigawatt-hours) is how much energy it holds. Dividing GWh by GW gives the battery's duration in hours at full output.
2 · Who BloombergNEF is
BloombergNEF (BNEF) is Bloomberg's energy research arm. It publishes an energy storage outlook twice a year, and investors, utilities and policymakers use it as a reference forecast. Each edition revises the previous one.
3 · The 2025 tax law
The One Big Beautiful Bill Act, signed in 2025, cut back many clean energy tax credits. Solar loses eligibility later this decade, but storage keeps its credits through 2035. The law also limits supply chains that involve China.
5/5Inside Climate News· By Keerti Gopal· Oct 28
Lancet report: climate-linked deaths have risen faster since the Paris Agreement
The 10th Lancet Countdown report, written by 146 scientists with the World Health Organization, finds climate harms to health grew faster in the decade after Paris than before. Cleaner air saved lives in only about half of countries.
Why it matters · It puts the gap between clean-energy progress and rising climate damage into deaths and dollars, just before COP31, where countries will negotiate over emissions and money.
Know this first
Context from the editor, not the article · 28 sec
1 · What the Lancet Countdown is
An annual scientific report tied to the medical journal The Lancet. It tracks dozens of indicators linking climate change to health, such as heat deaths, drought exposure and air pollution. Running it every year lets researchers compare trends over time.
2 · How deaths get attributed
Researchers model deaths under the observed climate and under a simulated climate with no human-caused warming. The difference is the share attributed to climate change. These figures are statistical estimates, not counts of death certificates.
How the £1,723 price cap divides into wholesale, network, operating and policy costs.1 / 4
From October 2026 the UK cap on household energy bills is £1,723 a year for a typical home, the highest since 2022. Forecasts put January 2027 about 25% higher again, close to £2,200. Ahead of the 28 October budget, Carbon Brief used figures from the thinktank Nesta to test which explanation for high bills holds up.
Gas is the main driver
Wholesale electricity and gas make up 44% of the bill. Network charges take 24%, supplier operating costs 17% and policy levies 7%. Wholesale electricity tracks gas because of 1: the most expensive plant running, usually gas, sets the price for all power. According to Nesta, gas-driven wholesale costs explain more than 80% of the rise in bills since 2020.
Network charges are the second-largest driver. 2, the regulator, has approved up to about £90bn of grid investment to 2031, which will lift charges from £222 to £330 a year by 2030. But Ofgem says three-fifths of that rise is routine maintenance after decades of under-investment. Only £30 goes on expanding transmission. 3 come to just £35 a year. These are payments to switch off windfarms when the grid can't carry their power, and to switch on gas plants instead. Unpaid bills recovered from all customers now add about £60.
What's been done
The government moved 75% of a legacy renewables subsidy into general taxation and closed a bill-funded efficiency scheme. Together these save households £134 a year. It also removed VAT on electricity for six months, worth about £45. Rising gas prices have swallowed both. Clean power is also holding bills down: the Energy and Climate Intelligence Unit estimates wind cut wholesale power prices by about a third in 2025.
The options
Move more levies into tax. More than 120 groups say this would take total government savings to about £250 a year. The Treasury has resisted.
Move levies from electricity onto gas. This would narrow the "4", the ratio of electricity to gas prices, which is now 3.3. A lower ratio makes heat pumps cheaper to run than gas boilers.
Get more out of the existing grid through flexibility and 5.
The "slow down" argument
The Institute for Fiscal Studies and the Tony Blair Institute argue that slowing the 2030 clean-power target could cut costs. A Conservative-backed report claims £320bn in savings, but Carbon Brief and industry critics say it assumes gas stays cheap. UK gas prices have more than doubled since the Iran war began, and the UK has had nine price spikes in a decade.
Electrification
Parties broadly agree on electrifying homes and transport. One electric system replacing gas, electricity and petrol spreads the grid's fixed costs over more demand. The Climate Change Committee, the government's climate adviser, finds electrified homes are already cheaper to run, even after counting the upfront cost of the equipment.
From October 2026 the UK cap on household energy bills is £1,723 a year for a typical home, the highest since 2022. That is £60 more than the previous cap and 47% higher in real terms than in October 2020. Forecasts put January 2027 around 25% higher again, close to £2,200. The government is about to set its budget on 28 October, and the argument over who is to blame has turned political. Some say climate levies and grid spending are the cause. Others say the problem is dependence on gas. Carbon Brief, working from figures by the thinktank Nesta, has broken the bill down to see which story holds up.
What's in a bill
The current cap divides up as follows:
Wholesale electricity and gas: 44%. Both track gas prices, because under 1 the most expensive plant running, usually gas, sets the power price.
Network charges: 24%. These pay to run, maintain and expand the gas and electricity grids.
Supplier operating costs: 17%.
Policy costs: 7%.
The article doesn't break down the rest, which includes VAT. The direction of change matters more than the split. According to Nesta, wholesale costs driven by gas account for more than 80% of the rise in dual-fuel bills since 2020. That cuts against much of the UK media and political coverage. Network costs are the second-largest contributor.
The grid bill, examined
At the end of 2025 2 approved £29bn of upfront investment in national gas and electricity transmission and in local gas distribution. This is part of a programme worth up to about £90bn to 2031. As a result, network charges for a typical dual-fuel home are expected to rise about 50% between 2025 and 2030, from £222 to £330. That figure leaves out local electricity distribution, whose next spending package Ofgem will approve by the end of 2027.
Grid spending is often blamed on connecting distant windfarms, but most of it is not about renewables. Ofgem says about three-fifths of the £108 rise per household is "business-as-usual" maintenance, and only £30 goes on expanding electricity transmission. The Energy Networks Association, the grid companies' trade body, says up to 80% of electricity grid investment goes on maintaining existing assets after decades of under-investment.
3 are another common complaint. These arise when the grid can't carry windfarm output, so the windfarms are paid to switch off and gas plants are paid to switch on instead. They have risen steeply, partly because gas is expensive, but they still come to just £35, or 4% of a typical electricity bill. They trace back partly to "connect and manage", a 2010s policy of connecting generators before building the grid capacity to carry their power. The National Energy System Operator (4), which runs the grid, projects that balancing costs could rise from £2bn to £8bn by 2030 if grid building is delayed. Its central estimate is £3–4bn.
"Bad debt" is the third pressure. When households can't pay, suppliers recover the money from everyone else's bills. This now adds about £60 to a typical bill, up £40 since 2020, which is more than half the rise in operating costs. Energy UK, the suppliers' trade body, says it could add another £10–15 next year.
What has been tried
Labour promised to cut bills by £300 a year by 2030, compared with late 2023. In the 2025 budget it closed the energy company obligation (ECO), an efficiency scheme funded through bills. It also moved 75% of the 5, the subsidy for older renewable projects, into general taxation. Together these were worth £134 a year to a typical household, or £154 for homes with electric heating. Prime minister Andy Burnham removed VAT from electricity bills for six months from 1 October, saving about £45. Richard Carmichael of the UK Energy Research Centre says rising wholesale prices have "masked" these cuts.
Clean power is also holding bills down, though the effect gets less attention. Record wind and solar output has saved about £5.9bn in gas imports since the Iran war began. The Energy and Climate Intelligence Unit (ECIU) estimates that windfarms cut wholesale power prices by about a third in 2025, through the 6: cheap wind displaces the most expensive gas plants, so the price-setting plant is a cheaper one. University College London puts wind's net saving to consumers at £104bn over 2010–2023, after subsidies. Nesta finds electricity prices rising "much more slowly" than gas this year, an early sign that the two are decoupling.
The options
The "slow down" case
The Institute for Fiscal Studies warns that rapid decarbonisation "risks increasing costs". It relies on 2024 Neso modelling made before gas prices rose further. Its own deputy research director concedes that higher gas prices favour renewables, but notes that capital costs have also risen. The Tony Blair Institute now argues for "cheaper power by 2030". The Conservatives back a report from the thinktank Onward claiming £320bn of savings. Carbon Brief and industry critics say that figure rests on optimistic assumptions about the price of gas and nuclear.
Against that, UK gas prices were already about three times their pre-Ukraine level and have more than doubled since. RenewableUK, the renewables trade body, counts nine gas-price spikes in a decade. The 2015 "cut the green crap" policy shift added £22bn to bills, according to earlier Carbon Brief analysis.
Delivery is also a problem. Consultancy LCP Delta expects 83% clean power by 2030 against the 95% target, with the target reached only around 2035. The government says it won't buy more clean power unless doing so lowers bills.
Electrification
There is more political agreement on electrification. Households today pay for three energy systems: gas, electricity and petrol. Moving all three onto electricity spreads the grid's fixed costs over more demand. EVs and heat pumps are also far more efficient, and EVs cost up to nine times less to run than petrol cars. The Climate Change Committee (CCC), the government's climate adviser, finds that an electrified home is cheaper even today, after spreading the upfront costs of the equipment over its life. The article doesn't say how widely those savings apply to different kinds of home.
Remember
Policy levies are 7% of the bill. Wholesale costs tied to gas are 44% and drove more than 80% of the rise since 2020.
Most of the coming grid investment pays for routine maintenance. Expanding transmission adds only about £30 a year to household bills.
Bill cuts so far, worth about £180 a year, have been swallowed by gas prices that more than doubled after the Iran war.
Daily and cumulative surface mass balance for 2025–26: gains until May, then losses, compared with the average and the 2012 record low.1 / 4
Greenland's ice sheet lost more ice than it gained for the 30th year in a row. In the 12 months to August 2026 it shrank by about 135bn tonnes, according to Martin Stendel and Ruth Mottram of the 1 (DMI). A second method gives a larger figure of 173bn tonnes. The last year with a net gain was 1996.
A good year at the surface
At the surface, the year looked healthy. 2 is snowfall minus surface melt. It came to 519bn tonnes, the sixth highest in 46 years of records and about 178bn tonnes above the 1981–2010 average.
The southern half had a dry winter, with about 40bn tonnes less snow than normal. Then a cool, cloudy and snowy June held melting back. The melt season started on 5 June, nine days later than average. July turned warm, and on 22 July melt covered 74.9% of the ice sheet. The record is 81.2%, set in July 2025. Fresh snow from June reflected sunlight, and much of the meltwater soaked into the snowpack and refroze instead of running off.
The authors link the mild summer to a "blocked" 3 shaped like the Greek letter Ω. That pattern brought heatwaves to Europe and North America but put Greenland in a cool zone. If the pattern had sat half a wavelength to one side, they say, Greenland could have seen record melt.
Why it still shrank
The total mass balance adds in losses at the coast: icebergs breaking off (4), glacier fronts melting in warm seawater, and some melting at the base of the ice. Calving and glacier retreat have caused roughly two-thirds of Greenland's ice loss to date.
On 4 August, a 76 km² "5" about 150m thick broke off the floating tongue of Petermann glacier in north-west Greenland. It was the biggest calving event in the Arctic since 2020. Two more pieces, of about 94 and 84 km², are expected to break away. Floating ice doesn't raise sea level when it breaks off. But these floating tongues act as brakes that slow the flow of ice from the interior to the sea.
The longer record
The worst year on record is still 2012, with about 458bn tonnes lost. Yet the past two "quiet" years each lost more than 100bn tonnes. The authors say 30 straight years of decline now let scientists attribute Greenland's ice loss to climate change with confidence.
A new combined assessment, 6, merges 42 independent estimates of how much ice each sheet is gaining or losing. It finds Greenland lost 6,215bn tonnes between 1972 and 2023, more than Antarctica's 4,780bn. Together the two ice sheets cause almost a quarter of observed sea-level rise. Antarctica holds about 10 times as much ice, though, and the authors argue it is now showing processes long seen in Greenland, a trend they call "Greenlandification".
Greenland's ice sheet has now lost more ice than it gained for 30 consecutive years. In the ice year from 1 September 2025 to 31 August 2026, the world's second-largest ice sheet lost around 135bn tonnes. That figure comes from Martin Stendel and Ruth Mottram of the 1 (DMI), writing for Carbon Brief. A new, more observation-based method puts the loss higher, at 173bn tonnes. The last year with a net gain was 1996.
What stands out is that 2025–26 was not an extreme year. Summer started cool, surface melt was below recent years, and snowfall was well above average. The ice sheet shrank anyway.
Two ways to keep the books
Scientists track Greenland's ice using two related measures.
2 (SMB) is the snow that falls on the ice sheet minus the ice that melts and runs off its surface. The ice sheet gains mass from autumn to spring and loses it from about mid-June. Over a full year the SMB has always come out positive, because the surface still collects more snow than it loses to melt.
3 adds the losses that happen at the coast and at the base of the ice. The coastal part, called the 4, covers icebergs breaking off (5) and glacier fronts melting where they meet warm seawater. The basal mass balance is a small amount of melting under the ice. Coastal losses now regularly outweigh the surface surplus, and that is why the total has been negative every year since 1996.
The 135bn-tonne figure uses the same method as DMI's earlier annual reports, an average of three climate models. This year DMI also published a second estimate for the first time. It combines one climate model with readings from automatic weather stations, satellites, GPS and aircraft. That method gives 173bn tonnes. The authors say estimates differ because scientists don't fully know how thick the ice is, how fast it moves or how fast it melts, and each method handles those gaps differently.
How the surface year played out
The surface side ended at 519bn tonnes. That is the sixth highest in a 46-year dataset and about 178bn tonnes above the 1981–2010 average of roughly 350bn. Getting there took several turns.
Dry start. Winter and early spring were unusually dry in the south, leaving about 40bn tonnes less snow than normal. Thick winter snow usually shields the ice early in summer, so a thin layer normally means heavy melt later.
Cool June. Frequent snowfall and cloud cover kept the sun from warming the surface during the weeks when sunlight is strongest. The melt season began on 5 June, nine days later than the 1981–2010 average. (It counts as started on the first of at least three days in a row with melt over more than 5% of the ice sheet.)
Warm July. From late June, warm sunny weather took over. For the first 20 days of July melting was well above average, and on 22 July it covered 74.9% of the ice sheet. The record, set in July 2025, is 81.2%.
The buffer held. Fresh June snow is brighter than old glacier ice, so it reflects more sunlight. Much of July's meltwater also seeped into the snowpack and refroze. As a result the cumulative SMB stayed almost flat from mid-June to mid-July and was only slightly lower by the end of August.
Snowfall was heavy in south-east Greenland, as usual, and also unusually heavy on the west coast north of Nuussuaq. The authors note that more snow and more melt are both expected as the climate warms, because warmer air holds more water vapour.
Why Greenland stayed cool
The authors tie Greenland's mild summer to the same pattern that brought heatwaves to southern Europe and North America. When high-pressure systems get stuck in place, the 6, the fast west-to-east winds high in the atmosphere, bends into the shape of the Greek letter Omega (Ω). Heat builds under the high-pressure centre, while the "feet" of the Ω are cool and wet. This year Greenland sat in a cool zone. The authors argue that if the pattern had shifted by half a wavelength, Greenland would probably have had record melt.
Losses at the edges
The most dramatic loss came at the coast. On 4 August a tabular iceberg broke off the floating tongue of Petermann glacier in north-west Greenland. This kind of iceberg, called an "7", is flat-topped with steep sides. It covered more than 76 km² and was about 150m thick, enough frozen water to cover greater London to a depth of 6.65m. It was Petermann's largest loss of floating ice since 2012 and the biggest Arctic calving event since 2020. Cracks had been growing for years, and two more pieces of about 94 and 84 km² are expected to follow. Together the three would remove about 22% of Petermann's remaining floating ice.
Ice that is already floating doesn't raise sea level when it breaks off. But Petermann is one of Greenland's largest glaciers that end in the sea, and its tongue slows the flow of ice from the interior. Losing that brake can speed up the flow. Calving and glacier retreat have caused roughly two-thirds of Greenland's total ice loss to date.
Why 30 years matters
A single year mostly reflects the weather. Climate scientists usually use 30-year periods to separate a real trend from natural variation. Greenland's ice budget has been negative every year since 1996, whether the year was warm, cold or snowy. The worst year remains 2012, at about 458bn tonnes lost. Even the "quiet" past two years lost more than 100bn tonnes each. The authors say this record lets scientists say with confidence that Greenland's ice loss is caused by climate change.
The global sea-level picture
The Ice Sheet Mass Balance Intercomparison Exercise (8) is a project that combines 42 independent estimates of ice-sheet change into one record. Its latest assessment was published in Scientific Data in September, and DMI's surface estimates are among its inputs. It finds Greenland and Antarctica together lost 11,309bn tonnes between 1979 and 2023. That raised sea level by about 32mm and makes up almost a quarter of observed sea-level rise.
Greenland lost 6,215bn tonnes from 1972 to 2023, an average of 119bn tonnes a year. About two-thirds came from faster flow of ice into the sea and one-third from more surface melt. Annual losses climbed from about 60bn tonnes in the 1980s to 264bn in the 2010s. Antarctica lost 4,780bn tonnes over the same period, adding about 13mm of sea level. All of that came from ice flowing into the sea, mostly in West Antarctica. East Antarctica has been fairly stable and has even gained a little mass recently thanks to record snowfall.
That balance between the two is expected to change. Antarctica holds roughly 10 times as much ice, and IMBIE notes that its losses are driven by glaciers ending in the sea, whose stability is the hardest to predict. The authors argue that processes seen in Greenland for decades are now appearing in Antarctica: more surface melt, shrinking sea ice, loss of ice shelves and seasonal retreat of glaciers. They call this "Greenlandification". The article doesn't say how fast that could change Antarctica's contribution to sea level. It also leaves unresolved the gap between the 135bn and 173bn estimates.
Remember
Surface snowfall was sixth-highest on record, yet calving and melting glacier fronts still pushed Greenland's total into a loss of 135–173bn tonnes.
Calving and glacier retreat have caused about two-thirds of Greenland's ice loss, so a mild summer doesn't stop the decline.
Greenland has lost more ice than Antarctica since 1972, but Antarctica holds about ten times as much ice.
The UN's annual assessment of national climate plans now projects global emissions only about 6% below 2019 levels by 2035. Last year's edition projected 12%. Each plan is a 1, a country's self-set emissions target under the Paris Agreement.
The drop came even though coverage grew: 154 countries have filed plans, up from 113, and they account for about 71% of global emissions.
How the tally works
Countries with an NDC are modelled as if they hit their targets. Countries without one are modelled on 2, the measures actually in force, which usually mean higher emissions. Moving a large emitter from the first group to the second can shift the whole result.
The US effect
That happened to the United States, the world's second-largest emitter. Last year's tally counted the Biden-era pledge to cut emissions 61–66% by 2035. Since the US formally left the Paris Agreement, its pledge is excluded and its emissions are projected from current policy, which points far higher.
According to the article, US emissions grew significantly last year. Electricity demand rose, and the Trump administration rolled back clean-energy support. Part of the halving is arguably the accounting becoming realistic: the earlier figure credited a pledge US policy was never set to deliver.
Weak new pledges
The roughly 40 NDCs filed since last year are less ambitious than earlier modelling assumed.
India (third-largest emitter): 3, an independent group that rates national plans, finds India's plan allows emissions to reach 6.3 billion tonnes by 2035, almost 64% above 2023. That target is weaker than India's current policies and could be met by 2030.
Saudi Arabia: no 2035 target. Its only goal is to "reduce, avoid or remove" 335 million tonnes a year by 2040, against a baseline it hasn't disclosed. CAT rates it "critically insufficient."
About 30 countries, including Egypt, Vietnam and Argentina, still haven't submitted updated plans more than 18 months after the deadline.
The gap
The 4, the UN's science assessment body, says emissions must fall about 60% by 2035 to hold warming to 1.5C, a limit now expected to be breached at least temporarily. Pledges deliver a tenth of that. The new plans imply 2.1C–3.2C of warming by 2100, up from last year's 1.9C–3.0C. The range depends on what countries do after 2035.
UN climate chief Simon Stiell called collective progress insufficient and uneven. He looks to 5 in Antalya, Türkiye, for stronger outcomes on cuts, adaptation and finance.
The news
Each year the UN climate secretariat publishes an assessment that adds up countries' climate pledges. This year's edition says those pledges would cut global emissions only half as much by 2035 as last year's edition projected. Counting the 154 countries that have filed a nationally determined contribution (NDC, a country's self-set emissions target under the Paris Agreement), the assessment projects global emissions about 6% below 2019 levels by 2035. Last year the figure was 12%, based on 113 countries.
So more countries are covered and the projected cut has halved. The two main reasons are the US withdrawal from Paris and a batch of new plans that are weaker than modellers had hoped.
How the tally works
The assessment splits the world into two groups:
Countries with an NDC are modelled as if they meet their stated targets. The 154 countries this year account for about 71% of global emissions.
Everyone else is modelled on 1, meaning the laws and measures actually in force, which usually point to higher emissions than pledges do.
So the result depends on which group a country falls into. When a big emitter moves from the first group to the second, the projection changes even if its real emissions haven't moved yet.
The US effect
That is what happened with the United States, the world's second-largest emitter. Last year's tally included the Biden administration's pledge to cut emissions 61–66% by 2035. Now the US has formally left the Paris Agreement, so its NDC no longer counts. Its emissions are projected from current policies instead, and those point to far higher pollution.
The article reports that US emissions grew significantly last year. It gives two causes: rising electricity demand, and Trump administration policies that rolled back support for clean energy and backed fossil fuels.
Our reading, not the article's: part of the drop from 12% to 6% is the accounting becoming more realistic. Last year's figure credited a US pledge that current policy was never on track to deliver. The rest is a real worsening, because emissions are rising where the earlier model assumed steep cuts.
Weak new pledges
About 40 NDCs have arrived since last year's update, and as a group they are less ambitious than the earlier modelling assumed. The article highlights two.
India (third-largest emitter, submitted April 2026). According to 2, an independent research group that rates national climate plans, India's NDC would let emissions rise to 6.3 billion tonnes by 2035. That is almost 64% above 2023 levels. The targets are weaker than India's current policies, and the country could meet them as early as 2030. A target that is already exceeded on paper does nothing to cut emissions further.
Saudi Arabia (submitted end of 2025) sets no 2035 target. Its only goal is for 2040: to "reduce, avoid or remove" 335 million tonnes a year against a baseline it doesn't disclose. Without that baseline, nobody can work out what emissions level the target implies. CAT rates the plan "critically insufficient" and estimates Saudi 2035 emissions at anywhere from 13% below to 18% above 2019 levels.
About 30 countries, including Egypt, Vietnam and Argentina, still haven't submitted an updated NDC, though the deadline passed more than a year and a half ago.
The size of the gap
The IPCC says emissions need to fall by about 60% from 2019 levels by 2035 to limit warming to 1.5C. The article notes that 1.5C will now inevitably be breached, at least temporarily. Pledges deliver 6%, a tenth of what's needed.
Illustrative scale, using approximate general figures rather than the report's: global greenhouse gas emissions in 2019 were somewhere around 55–60 billion tonnes of CO2-equivalent. A 6% cut removes roughly 3–4 billion tonnes a year by 2035. A 60% cut would remove around 35 billion.
On warming, the latest NDCs put the world on course for 2.1C to 3.2C by 2100, up slightly from last year's 1.9C–3.0C. The range is wide because it depends on what countries do after 2035, which current plans mostly don't specify.
What the UN says
UN climate chief Simon Stiell said the assessment shows again that collective progress is insufficient, that transitions are very uneven across countries, and that many face substantial barriers to delivering their pledges. He pointed to 3, the UN climate summit in Antalya, Türkiye, as a chance to close gaps. He listed hoped-for outcomes on emission cuts, adaptation, climate finance and 4 (support for workers and regions that depend on fossil fuels). He also named presidency-led initiatives on electrification, methane and zero waste. Related Climate Home reporting notes that only 77 heads of state or government are scheduled to speak at COP31, a third fewer than at the COP28 peak.
What remains open
Pledges versus delivery. The tally measures promises. India's case shows a pledge can be weaker than real policy, and the US case shows the opposite. The article doesn't say how the gap between pledges and current policies has changed across the whole world.
The missing 30. It isn't clear how much new plans from the remaining countries would shift the global figure. Given the countries named, probably not much.
After 2035. The upper end of the warming range, 3.2C, depends on decisions that no current NDC covers.
Remember
Coverage rose from 113 to 154 countries, yet the projected 2035 cut halved: who counts as pledging matters.
India's new target is weaker than its existing policies, so on paper it requires no extra effort.
Pledges deliver about 6% of cuts against the roughly 60% the IPCC says 1.5C requires.
1, Bloomberg's energy research arm, now expects the US to install 30% more energy storage over the next 10 years than it forecast six months ago. Its new outlook puts cumulative US deployments at 213.9 GW by 2030 and 434.4 GW by 2036. Globally, it expects 3,098 GW / 11,106 GWh by 2036, about 10 times today's level. The first figure (GW) is the power a battery can deliver at once; the second (GWh) is the energy it stores.
Why the forecast went up
BNEF names two near-term drivers. The first is the economics of 2 storage, meaning batteries built at the same site as solar or wind farms. The second is demand from data centers. Both rose even though the US has what BNEF calls "world-leading" trade barriers. Batteries for stationary storage imported from mainland China face a combined duty of 40.9%, and imports of power-conversion equipment are restricted.
Policy also helps. The 3, a 2025 tax law, keeps storage eligible for federal tax credits through 2035 but ends solar's eligibility later this decade. BNEF says that supports a pipeline of 83.7 GW / 166.1 GWh of storage paired with 149.2 GW of solar.
Storage is catching up with solar
Worldwide, the ratio of installed solar capacity to installed storage fell from 94:1 in 2016 to 7:1 in 2026. BNEF expects it to settle at about 4:1 by 2030. By the end of 2025 the US had 20.7 GW / 66.4 GWh of storage sharing sites with 41.3 GW of solar.
Data centers
Batteries installed at data center sites are still a small share of the market, but the share is growing quickly. BNEF expects 4.9 GW / 7.4 GWh this year, up from 500 MW / 1.4 GWh in 2025, and 36 GW / 66 GWh cumulatively by 2036. Most of that will be on three grids: 4 (Texas), 5 (the Mid-Atlantic region) and 6 (the Midwest). BNEF says data centers in PJM are more likely to use batteries than on-site gas generators to shift their power use in time, because emissions limits on power plants there are stricter. Examples include a 2.6 GW battery that NextEra Energy plans to build next to a 2 GW gas plant at a proposed Kentucky computing campus, and a $300 million contract for on-site batteries that Fluence Energy signed with a data center operator.
Chemistry
7 batteries stay dominant, but BNEF expects 8 to reach 9% of new deployments by 2036. Its backers say it can be cooled passively and may last longer. Google and other data center operators are testing longer-duration chemistries, including a 300 MW / 30 GWh iron-air battery in Minnesota. BNEF considers these too early to include in its forecasts.
The article doesn't give BNEF's previous numbers or say exactly what the 30% upgrade is measured against.
1, Bloomberg's energy research arm, has raised its US energy storage forecast. Its latest outlook, published twice a year, says the US will install about 30% more storage capacity over the next 10 years than BNEF expected six months ago. Cumulative US deployments are now forecast at 213.9 GW by 2030 and 434.4 GW by 2036, according to BNEF senior energy storage analyst Isshu Kikuma, speaking to Utility Dive. Globally, BNEF expects 3,098 GW / 11,106 GWh installed by 2036, about ten times today's level.
The article does not give the previous forecast numbers. It also doesn't say whether the 30% applies to the 2036 cumulative total or to installations over the decade, so it isn't possible to reconstruct the old figure precisely.
Reading the numbers
Storage is quoted as two figures. GW is power: how fast a battery can push electricity onto the grid. GWh is energy: how much it holds. The ratio between them is the battery's duration. Our own arithmetic on BNEF's figures shows that duration varies a lot by use:
The 2036 global fleet works out to roughly 3.6 hours on average.
US storage 2 with solar at the end of 2025 (20.7 GW / 66.4 GWh) is about 3.2 hours. That is enough to move midday solar output into the evening demand peak.
On-site data center batteries expected this year (4.9 GW / 7.4 GWh) average only about 1.5 hours. They are built to supply power quickly for short periods, not to run for many hours.
The iron-air project Google is backing in Minnesota (300 MW / 30 GWh) would run for about 100 hours.
These differences explain much of the rest of the story.
What's pushing the forecast up
BNEF names two near-term US drivers. The first is favorable economics for colocated storage, meaning batteries built at the same site as solar or wind plants, where they can share the grid connection and store power that would otherwise be curtailed. The second is data centers' growing demand for storage both "3" (on the customer's side of the utility meter, serving the site directly) and "front of meter" (connected to the grid and serving the wider system).
The trend is clear in the ratio of installed solar to installed storage. Worldwide, that ratio fell from 94:1 in 2016 to 7:1 in 2026. BNEF expects it to stabilize around 4:1 by 2030, with annual additions holding near 3:1 after that as the industry matures. Storage is still smaller than solar, but it is growing much faster.
Federal tax policy is pushing in the same direction. The 4, the 2025 budget and tax law, extended tax credit eligibility for storage through 2035 while ending it for solar later this decade. BNEF says this will support a pipeline of 83.7 GW / 166.1 GWh of storage paired with 149.2 GW of solar. One reading of that split is that developers are racing to finish solar while it still qualifies and attaching storage, which keeps its credits longer. In the first nine months of 2026, about 4 GW of storage was colocated with solar in the US.
Growth despite tariffs
The forecast increase comes alongside trade restrictions that BNEF calls world-leading. Stationary storage batteries imported from mainland China face a combined duty of 40.9%. There are import restrictions on foreign-made power conversion systems (the inverters and related equipment that connect batteries to the grid), and recent broad limits on imports of bulk power system equipment. The report says the US has made "the most aggressive" efforts to favor its domestic battery industry and restrict supply chains involving China. BNEF still expects higher deployment, which suggests demand is strong enough to absorb higher costs. The article mentions cost inflation but does not put a number on how much these measures raise project costs.
Data centers: small share, fast growth
On-site storage at data centers is still a small part of US deployment. But BNEF expects 4.9 GW / 7.4 GWh this year, up from 500 MW / 1.4 GWh in 2025, which is roughly a tenfold rise in power capacity. It forecasts 6.3 GW / 8.4 GWh in 2027 and 36 GW / 66 GWh cumulatively by 2036. Most of that will be on three grids:
5, the Electric Reliability Council of Texas
6 Interconnection, the grid operator covering much of the Mid-Atlantic and parts of the Midwest
7, the Midcontinent Independent System Operator
BNEF says PJM data centers are more likely to use batteries for load shifting (moving when they draw grid power) than on-site gas generation, because the region restricts power plant emissions more tightly.
Several deals show the trend:
NextEra Energy plans a 2.6 GW battery array next to a 2 GW gas plant at a proposed $100 billion Brookfield Asset Management computing campus in Kentucky.
Fluence Energy signed a $300 million contract with a data center operator for behind-the-meter batteries.
e-Storage, a Canadian Solar subsidiary, will deliver 500 MW / 2.5 GWh to an unnamed "major U.S. utility" in 2027 to support grid infrastructure for data centers.
On the day of the report, Google said it would expand the battery-backed 8 it is developing with Voltus in PJM tenfold, to more than 1 GW. A virtual power plant is a network of distributed batteries and flexible loads that a grid operator can dispatch together, like a single plant.
Chemistry: LFP holds, 9 enters
10, the cheap and thermally stable lithium chemistry that already dominates grid storage, will remain dominant for the next decade, BNEF says. Sodium-ion batteries are expected to take 9% of new deployments by 2036. Their proponents argue that sodium-ion cells can be cooled passively, which cuts the "parasitic" power a battery site uses for its own cooling, and may last longer over a 20-year service life. Sodium-ion maker Peak Energy just closed $108 million in financing from General Motors and others, with a goal of deploying nearly 5 GWh by 2030.
Longer-duration chemistries are further away. Google and other data center operators are trying projects such as a proposed 10 MW / 100 MWh zinc battery in West Virginia (about 10 hours) and the Minnesota iron-air battery. BNEF considers these too early to include in its forecasts.
What stays open
The article raises several questions it doesn't answer:
How much of the upgrade comes from data centers and how much from colocated solar.
How sensitive the forecast is to further trade actions.
Whether the solar pipeline supported by the tax credits holds up after solar's credits end.
The solar-to-storage ratio settling at 4:1 is BNEF's projection. It is not an observed fact.
Remember
Worldwide, installed solar outnumbered storage 94:1 in 2016. The ratio is 7:1 now, and BNEF expects it to settle at about 4:1 by 2030.
On-site data center batteries average about 1.5 hours of output, compared with about 3 hours for batteries colocated with solar.
A 40.9% combined duty on Chinese storage batteries hasn't stopped BNEF from raising its US forecast.
The 2015 Paris Agreement aims to hold warming to 1.5°C if possible. A UN Loss and Damage Fund was agreed in 2022 to pay vulnerable countries for climate harms they cannot adapt to.
Image: Inside Climate News
The 10th annual 1 report came out Tuesday. It is a yearly scientific audit of how climate change affects health, written this time by 146 researchers from more than 30 countries, led by University College London with the 2 (WHO). Its main finding is about speed. Climate-driven harm to health grew faster in the decade after the 2015 3 than in the decade before it.
Heat is the biggest number
Heat was linked to an estimated record 710,000 deaths in 2023, the latest year with complete data. That is more than HIV or malaria killed that year. The report attributes over 70% of those deaths to human-caused warming. Researchers get that figure by comparing deaths under the real climate with deaths modeled for a climate without human warming. From 2016 to 2023, the report estimates climate change caused almost 3 million heat deaths.
Heat also cost about $1.07 trillion in potential income, because it was too hot for people to work. Southeast Asia and Africa lost the most, and agriculture and construction were the worst-hit sectors.
Drought, rain and 4
More than half the world's land had extreme drought for at least a month last year. Only 2023 was worse. Since Paris, extreme drought has increased more than 700% faster than in the previous ten years, according to the report. Extreme rainfall is also more common, which raises the risk of floods, landslides and waterborne disease. A climate-boosted El Niño, the periodic Pacific warming that shifts global weather, is expected to make this year and next worse.
Clean energy helps, unevenly
Cleaner air prevented an estimated 323,000 deaths a year between 2016 and 2023 in a little over half the countries studied, mostly in China and the U.S. Rising pollution deaths in the other 46% of countries offset that gain. Lead author Marina Romanello blames record greenhouse gas emissions, rising energy demand and continued reliance on fossil fuels.
Money lags damage
The UN 5 was set up so wealthy nations could help poorer ones absorb climate harm. Four years after it was created, it has approved its first emergency payout. Nepal is getting $20 million after an August flood that killed at least 1,500 people. That is less than 1% of the $2.7 billion in initial losses.
The authors want the WHO and its member states to declare climate change a global health emergency, and they want health put at the center of 6, the UN climate summit in November. The U.S. pulled out of the Paris Agreement for the second time this year. Jeni Miller of the Global Climate and Health Alliance argues that no health system can prepare enough to cope with runaway warming, so cutting fossil fuels has to come first.
The article doesn't describe the report's methods, so the attribution estimates should be read as modeled figures.
The 10th annual 1 report came out Tuesday. The Countdown is a yearly scientific audit, linked to the medical journal The Lancet, that tracks how climate change affects human health. This edition was written by 146 researchers from more than 30 countries, led by University College London and produced with the 2 (WHO). Its central finding is about speed. Ten years after the 3, the 2015 treaty that aims to limit warming to well below 2°C and ideally 1.5°C, climate-driven harm to health is growing faster than it did in the decade before the treaty.
"Climate change is not only getting worse, but it's getting worse a lot faster than it used to," said Marina Romanello, the Countdown's executive director. She ties this to greenhouse gas emissions reaching new records year after year. The report also comes as the world looks set to pass 1.5°C of warming within the next few years.
Heat: the largest and clearest signal
Heat was linked to an estimated record 710,000 deaths in 2023, the most recent year with complete data. That is more than HIV or malaria killed in the same year. The report attributes more than 70% of these deaths to human-caused climate change.
That share comes from 4. Researchers estimate deaths under the climate that actually happened, then estimate deaths for a simulated climate with no human warming. The difference is what gets attributed to climate change. These are statistical estimates, not counts of death certificates that list "heat." The article does not describe the Countdown's specific models or uncertainty ranges.
The report puts climate-caused heat deaths from 2016 to 2023 at almost 3 million. A quick check shows the trend. Seventy percent of 2023's 710,000 is roughly 500,000 deaths. Three million spread over eight years averages about 375,000 a year. So 2023 was well above the average for the period, which fits the claim that the trend is accelerating.
Heat also hurts the economy. The report estimates that high temperatures cost $1.07 trillion in potential income, because people couldn't work safely or productively. Southeast Asia and Africa were hit hardest, and agriculture and construction were the worst-affected sectors. These are outdoor, physical jobs where cooling usually isn't an option.
Water: too little and too much
More than half the world's land had extreme drought for at least a month last year. That is the second-highest share on record, after 2023. Drought affects food security and sanitation, not just crops. The report says extreme drought has increased more than 700% faster in the decade since Paris than in the ten years before. The article doesn't break down the exact baseline behind that figure, so treat it as a sign of a much steeper trend, not a precise multiplier.
At the other extreme, heavy rainfall is becoming more common, which raises the risk of floods, landslides and waterborne disease. Romanello warned about the coming months. 5, the periodic warming of the tropical Pacific that shifts weather patterns worldwide, is developing and is being amplified by background warming. It is likely to bring more deaths this year and next. She urged countries to prioritize early warning systems and to make sure health systems are ready to respond.
What clean energy has bought, and where it hasn't
The report gives some credit to the energy transition. From 2016 to 2023, cleaner air prevented an estimated 323,000 deaths a year in a little more than half of the countries surveyed. China and the U.S. saw the biggest gains, as falling coal use and pollution controls cut fine-particle pollution. The other 46% of countries saw air-pollution deaths rise, which offset those gains at the global level.
This is the energy story behind the health story. Where countries have replaced dirty combustion, the benefits show up quickly as lives saved. But rising energy demand, continued reliance on fossil fuels and a slow clean-energy build-out elsewhere mean the global response is not keeping up with the scale of the hazards, the authors say. The harms are also unequal. They fall hardest on lower-income countries that have contributed relatively little to cumulative emissions.
Finance: a test case
The UN 6 was agreed in 2022 so that wealthier nations could help vulnerable countries cope with climate damage too severe to adapt to. Four years later, it has made its first approved emergency allocation, this month. Nepal is getting $20 million after an August flood that killed at least 1,500 people and left thousands missing. That is less than 1% of the $2.7 billion in initial losses Nepal reported.
Diana Picon Manyari of Health Care Without Harm, a network working to cut healthcare's environmental footprint, says climate finance for health systems is both too small and hard to access. "The commitments are not enough [and] whatever is out there is very difficult to access," she said. She wants healthcare covered on both fronts: 7, meaning preparing for impacts, and mitigation, meaning cutting the sector's own emissions.
The ask for 8
The authors are calling on the WHO and its member states to declare climate change a global health emergency. They also want health placed at the center of negotiations on emissions and moving away from fossil fuels. The next venue is COP31, the 31st UN climate summit, in November. The U.S. won't be part of the Paris framework there: President Donald Trump withdrew the country for the second time at the start of this year. WHO director-general Tedros Adhanom Ghebreyesus called the evidence "undeniable."
Jeni Miller of the Global Climate and Health Alliance argues that adaptation alone cannot solve the problem. "There is no universe in which healthcare systems can become so resilient and so prepared that we would be able to take care of people if we allow for runaway climate change," she said. She describes the COP process as frustrating, because emissions keep rising while the outcomes fall short. She still considers it necessary, though not enough: "We need all of the processes."
What remains open
The article reports the headline estimates but not their uncertainty ranges or methods. It doesn't separate how much of the rise in heat deaths comes from warming and how much from aging, growing urban populations. It also doesn't explain why air quality got worse in nearly half of countries. Those details are in the full report, not in this summary.
Remember
Cleaner air saved about 323,000 lives a year in roughly half of countries, but rising pollution elsewhere offset that gain.
Heat-related lost labor cost about $1.07 trillion, concentrated in outdoor work in Southeast Asia and Africa.
The Loss and Damage Fund's first emergency payout covers under 1% of Nepal's $2.7 billion flood losses.
Move more levies into taxation. More than 120 businesses, trade bodies and charities want the Sizewell C nuclear levy, the warm home discount and legacy feed-in tariffs paid from tax. They say this would bring the government's total household savings to about £250 a year. Consultant Kate Mulvany calls this, with bad debt, "in all likelihood the fastest route". The Treasury has resisted in the past.
Rebalance levies from electricity onto gas. A parliamentary committee proposes this to shrink the "7", the ratio of electricity to gas unit prices. A lower ratio makes heat pumps and EVs cheaper to run than gas boilers and petrol cars. The ratio was 4.3 in April 2026, is 3.3 now and could fall to 3.0 in January.
Use the grid harder. Options include demand flexibility and 8, which let cables carry extra load for short periods when conditions allow.
Targeted relief. Social tariffs risk a "cliff edge" for households just above the cut-off. Rising-block tariffs, which give a cheap block of essential use, could discourage electrification. Nesta's plan to scrap gas standing charges would save £27 a year.
Structural change. Some groups propose putting gas plants into a strategic reserve so they stop setting the power price.