When 0.6 Percent Gets Reported as 30 · Morning Gist
Tuesday, November 35 stories · 16 min
When 0.6 Percent Gets Reported as 30
Today's stories turn on who counts and who pays: permitting models, methane metrics, utility batteries, China's data centers and the COP31 divide.
Picked from 21 new articles across 13 sources · arrow keys for other days
Today in 30 seconds
30s left
Rhodium modeling finds the bipartisan permitting bill cuts US emissions up to 4% or leaves them flat; faster transmission outweighs added pipelines. story 1 ↓
A Greenpeace-commissioned analysis finds accounting choices could let a 0.6% real livestock methane cut be reported as 30%. story 2 ↓
Exelon weighs up to $8 billion for 2–4 GW of utility-owned batteries; New Jersey regulators decide the first 500 MW next spring. story 3 ↓
China expects computing centers to use about 800 TWh by 2030 and pairs the boom with an 80% renewable power target. story 4 ↓
Finance and stalled emissions talks split nations before COP31 in Antalya; 150 parties, covering three-quarters of emissions, have filed new climate plans. story 5 ↓
Mitsubishi Electric is spending $1.4 billion on PCI Energy Solutions, whose platform manages about 60% of US power generation.
1/5Heatmap· Emily Pontecorvo· Nov 2
Modeling finds bipartisan permitting bill would cut US emissions up to 4%, or leave them flat
Rhodium Group modeled key parts of a bipartisan US permitting bill. By 2040, emissions fall as much as 4% or stay flat, because faster power line construction offsets the climate cost of more gas pipelines.
Why it matters · Permitting reform helps fossil and clean projects alike, so this offers an early numerical test of who gains more, and whether climate advocates' support for the trade is justified.
Know this first
Context from the editor, not the article · 28 sec
1 · Why permitting affects emissions
Large US energy projects need multiple approvals and can face years of reviews and lawsuits. Easing those steps helps pipelines as well as power lines and solar farms, so the climate effect depends on which projects benefit most.
2 · Why transmission matters
Wind and solar are often best built far from cities, so they need high-voltage lines to reach customers. Slow line construction can strand cheap clean power and leave costlier, often fossil, plants running.
3 · How policy models work
Energy-system models compare a policy against a projected status quo under assumed fuel prices and technology costs. Their results are differences between imagined futures, not forecasts, so assumptions about prices can matter as much as the policy.
2/5Inside Climate News· By Georgina Gustin· Nov 2
Methane accounting choices could hide most of livestock's climate impact, reports say
Two new analyses show that methane metrics swing livestock's numbers dramatically: one accounting method could turn a 0.6 percent cut into a reported 30 percent, while a 20-year timescale doubles a beef meal's footprint.
Why it matters · Methane cuts are among the fastest ways to slow warming, so the choice of metric can decide whether countries' reported progress reflects real reductions in emissions.
Know this first
Context from the editor, not the article · 28 sec
1 · Comparing greenhouse gases
Countries report gases in carbon dioxide equivalents. Global warming potential, or GWP, converts a tonne of gas into the CO2 mass causing similar warming over a chosen period, usually 20 or 100 years.
2 · Why methane is different
CO2 builds up over centuries, so each tonne adds lasting warming. Methane is far stronger per tonne but breaks down in about 12 years, so its warming depends heavily on whether emissions are rising, flat or falling.
3 · The Global Methane Pledge
This is a voluntary international commitment to cut methane emissions 30 percent by 2030 from 2020 levels. Livestock is the largest human-caused methane source, largely from cattle belches, which makes the pledge sensitive to how farm emissions are counted.
3/5Utility Dive· Ethan Howland· Nov 2
Exelon weighs up to $8 billion in utility-owned batteries for tight grid
Exelon says its utilities could spend up to $8 billion building as much as 4 GW of batteries paid for by customers, arguing that lower capacity prices and tax credits would offset the cost.
Why it matters · It tests whether regulated utilities should build batteries when the market is short of supply, a choice that shifts cost and construction risk from private investors to electricity customers.
Know this first
Context from the editor, not the article · 27 sec
1 · PJM and its capacity market
PJM Interconnection runs the grid across 13 states and Washington, D.C. Through auctions, it pays power plants and batteries to commit to being available in future years, and customers' bills carry that cost.
2 · Why PJM is short
Data center growth and slow additions of new supply have tightened PJM. Its December 2025 auction cleared at the capped price of about $333 per MW-day, roughly 6.6 GW short of its reliability target.
3 · Regulated versus competitive
In much of PJM, utilities deliver power while independent companies own generation and bear its market risk. A regulated asset is different: customers pay for it through rates, and the utility earns an approved return.
4/5Inside Climate News· By Andrew Liu· Nov 2
China Pairs AI Data Center Boom With an 80% Renewable Power Target
China is steering new data centers toward renewable power in its sparsely populated west to speed AI build-out, while the US leans on new gas plants. Whether China's supply can keep pace remains untested.
Why it matters · Data centers are becoming a major driver of power demand, and these two approaches will influence how much new fossil capacity gets built and kept running for decades.
Know this first
Context from the editor, not the article · 27 sec
1 · Why power limits AI
AI data centers draw large, nearly constant loads. New sites often wait years for grid connections, so developers increasingly seek on-site or directly supplied power to get running sooner.
2 · Gigawatts versus terawatt-hours
Gigawatts measure maximum output at a moment; terawatt-hours measure energy over time. Wind and solar run below their rated output much of the time, so a gigawatt of them yields less annual energy than a gigawatt of gas.
3 · China's power geography
China's best wind and solar resources lie in its thinly populated north and west, while much of its demand sits near the eastern coast. Moving power requires long transmission lines; moving computing to the resource is the alternative.
5/5Carbon Brief· Carbon Brief Staff· Nov 2
Finance and stalled emissions talks divide nations before UN's COP31 climate summit
Carbon Brief analysed around 100 documents to track what countries want at the COP31 talks in Antalya. The main fights are over who pays, how to run a just transition, and whether emissions talks continue.
Why it matters · Knowing the dividing lines before Antalya helps separate real negotiated outcomes from side pledges, and shows that formal talks on cutting emissions are among the weakest parts of the process.
Know this first
Context from the editor, not the article · 26 sec
1 · How COP talks work
COP means Conference of the Parties, the yearly summit of countries under the UN climate convention, the UNFCCC. Decisions generally need consensus, so a few determined parties can block or dilute text.
2 · The Paris plan cycle
Under the 2015 Paris Agreement, countries set their own climate plans and update them every five years. A periodic global stocktake assesses collective progress, and is meant to inform the next round of plans.
3 · Why finance dominates
Paris Article 9.1 says developed countries shall provide finance to help developing ones. Much of the argument is over how much, from which budgets, and whether wealthier emerging economies should also contribute.
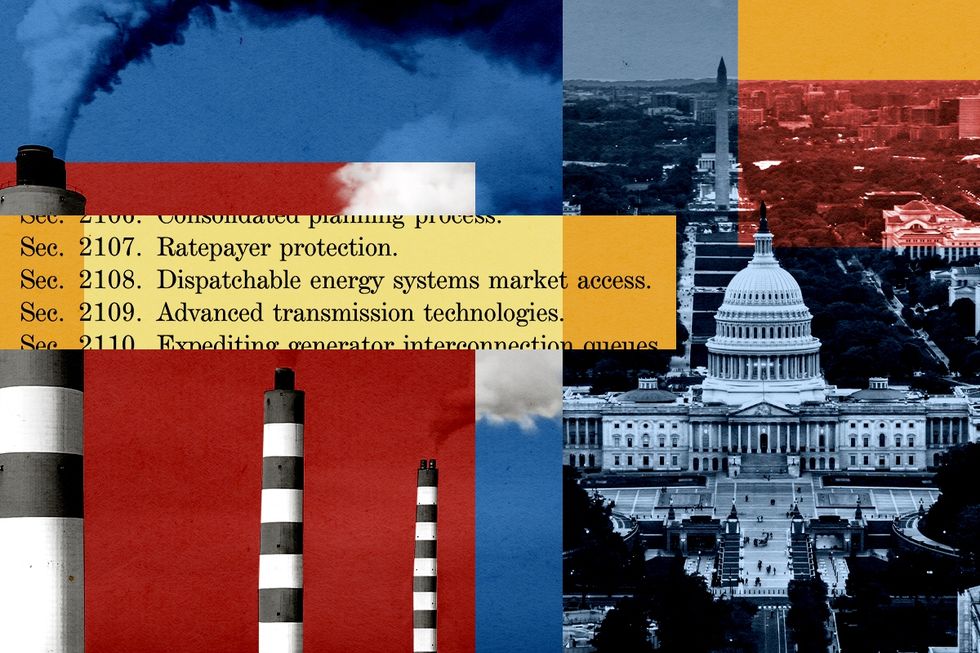
The bipartisan permitting reform bill would likely cut US greenhouse gas emissions slightly by 2040, or at worst leave them on their current path, according to new modeling by the 1, an independent research firm.
The climate trade-off
The 2, or BAAJA, aims to clear federal bottlenecks for building nearly anything. It would make long-distance power lines easier to approve, helping clean energy reach customers. It would also ease gas pipelines, which can expand fossil fuel production. The climate question is which effect wins.
Rhodium modeled the transmission and pipeline permitting provisions, assuming easier approval makes projects cheaper and faster. It then simulated how the energy system would respond, from a best case where clean energy easily beats gas to a worst case where gas prices collapse.
The numbers
Compared with status quo policy in 2040:
Emissions: up to 4% lower economy-wide, or unchanged.
Energy bills: up to $78 a year lower in the best case.
Clean capacity: 17 to 249 gigawatts more.
Transmission: 1.9 to 2.6 3 added yearly through 2040, up from about 0.7 over the past decade. A 1,000-mile line carrying 1 gigawatt would count as 1 terawatt-mile.
More pipelines do raise emissions in isolation. In the worst case, new gas capacity rises 4%, though gas-fired generation grows less than 1%. Rhodium's Ben King says the transmission benefits outweigh those increases on net, and calls the results directional rather than precise.
A narrower power-sector study from the think tank 4 also found modest gains: 6% lower electricity emissions and $350 billion in lower power bills through 2041.
What the model misses
The analysis skips the bill's contentious 5 provisions, which Democrats first sought to stop President Trump's campaign against wind. It also omits measures for geothermal energy and 6, networks of small devices that act like one plant. Those omissions could mean fewer emissions than modeled.
Other gaps cut the opposite way, or are unknown. The base case assumes all data centers connect to the grid, though many plan to use inefficient off-grid gas plants. 7 exports rise 8% to 15%, but effects abroad aren't counted. The model also can't see where lines actually run or where the grid is congested, a real weakness since transmission drives the favorable result.
Data centers
Rhodium also tested data centers taking more than a quarter of US electricity by 2040, up from about 5% today and 17% in its base case. BAAJA makes connecting easier but about 10% costlier for a 1-gigawatt facility, and Rhodium didn't predict how developers would respond. Even if gas met most of that demand on the grid, emissions would be 30% lower than with off-grid gas plants.
The bipartisan permitting reform bill is likely to trim US greenhouse gas emissions slightly by 2040 and lower energy bills, according to new modeling by the 1, an independent research firm. At worst, the firm finds, emissions stay on the path they are on today.
The bill is the 2, or BAAJA. Rhodium calls its analysis directional rather than a precise accounting, and it covers many provisions but not all. Heatmap describes it as the most comprehensive account of the bill's emissions effects so far.
Why the bill is hard to score
Recent partisan energy laws pointed in clearer climate directions: the 3 (IRA), President Biden's 2022 climate law, and President Trump's tax and spending bill, which repealed many IRA provisions. BAAJA's effects are more ambiguous and often work against each other. Its purpose is to clear federal bottlenecks for building almost anything, including highways, power lines, solar farms and pipelines.
That creates the central question. Easier approval of long-distance transmission helps clean energy reach the grid. Easier approval of natural gas pipelines can expand fossil fuel production. Only a model of the whole energy system can estimate which effect wins.
How Rhodium modeled it
The authors limited the core analysis to provisions that speed permitting for transmission lines and gas pipelines. They assumed that easier approval makes both kinds of project cheaper and quicker to build. They then asked how the energy system would respond: whether more power plants would be built, whether gas production would rise, and where that gas would go.
They ran this across a range of economic assumptions. In the best case, clean energy gets cheaper and easily outcompetes natural gas. In the worst case, gas prices collapse and cheap gas keeps dominating the energy system.
The results
Compared with status quo policy in 2040, the range looks like this:
Emissions: a cut of up to 4% economy-wide in the best case, and no change in the worst case.
Energy bills: up to $78 a year lower in the best case.
Clean capacity: 17 to 249 gigawatts more than without the bill, a spread of nearly 15-fold.
Transmission: an average of 1.9 to 2.6 4 added per year through 2040, against about 0.7 per year over the past decade.
Terawatt-miles measure capacity multiplied by distance. As an illustration, a 1,000-mile line carrying 1 gigawatt counts as 1 terawatt-mile. Rhodium's range works out to about 2.7 to 3.7 times the recent pace, which Heatmap summarizes as nearly tripling.
The pipeline side pushes the other way. Changes to the 5 and the 6, the law requiring federal environmental reviews, would enable more pipeline development. In isolation, that raises oil and gas production, and with it methane and CO2 across the fossil supply chain. Under the worst case, new gas capacity rises 4%, although gas-fired generation grows by less than 1% in 2040.
"On net, the emissions increases that we see there are outweighed by the emissions benefits that come from the transmission provisions of the bill," Ben King, an energy and climate director at Rhodium, told Heatmap.
The bill lowers costs mainly because a larger grid lets more low-cost generators connect. A requirement that data centers pay the full cost of connecting also puts downward pressure on rates.
A separate, narrower study points the same way. 7, a think tank, looked only at the power sector and found a 6% cut in electricity emissions and $350 billion in lower power bills through 2041.
A precursor, not a climate bill
A 4% best case may sound small, but BAAJA was not designed to reduce fossil fuel use. Heatmap explains that Senate climate advocates prioritize it because grid expansion is a precondition for faster decarbonization. After the IRA passed, Princeton researchers estimated that more than 80% of its potential emissions cuts by 2030 would be lost unless the US more than doubled its rate of transmission expansion.
With many IRA provisions repealed, the extra transmission will not drive as much clean energy as those researchers expected. King describes the bill as "an important down payment" for anyone who wants climate policy later.
What the model leaves out
The caveats cut in both directions.
Omissions that could mean fewer emissions. Rhodium did not count support for geothermal energy, 8 (coordinated household and business devices that act like a power plant) or 9 (hardware that gets more capacity from existing lines). Nor did it count the bill's reductions in grid congestion.
Assumptions that could understate emissions. The base model assumes every data center built through 2040 connects to the grid, though many now plan to run on inefficient off-grid gas plants.
Effects outside the US.10 exports rise 8% to 15%, but the authors did not assess how that gas changes energy use or emissions abroad.
The biggest gap on the politics. The analysis skips the bill's 11 provisions. Democrats first sought these to stop President Trump's campaign against wind, and they have become one of the bill's thorniest sections. The article doesn't estimate what they would do to emissions.
The model also treats transmission crudely. It sees economic inputs such as supply and demand, not where lines run or where bottlenecks sit. That matters because transmission is what drives the favorable result, and the assumed link from easier permitting to cheaper, faster lines is itself an input rather than a finding.
The data center stress test
Rhodium's base case has data centers rising from about 5% of US electricity use today to about 17% by 2040. Two further scenarios push that share above a quarter.
BAAJA pulls developers in two directions here. It makes grid connection easier, but its ratepayer protections make it more expensive, by roughly 10% for a 1-gigawatt data center. Rhodium did not try to predict which way developers would go, so it modeled the extremes: all additional demand on the grid, or none of it.
On the grid, the mix of gas and cleaner supply depends largely on relative prices. Even if gas met most of that demand, emissions would be 30% lower than if off-grid gas plants met it. The on-grid versus off-grid decision could therefore matter a great deal, and the bill's net push on it remains an open question.
Remember
The favorable result rests on transmission, the very thing Rhodium's model represents most crudely.
Emissions outcomes depend heavily on relative gas and clean energy prices, not just the bill's provisions.
Whether new data centers join the grid or run off-grid on gas could significantly change their emissions.
Two new analyses argue that methane accounting choices can drastically change livestock's apparent climate record. One, commissioned by Greenpeace International, finds that big exporters could cut real methane by 0.6 percent by 2030 yet report a 30 percent reduction.
The counting problem
Countries report emissions in 1, using global warming potential, or GWP: a gas's warming over a set period relative to CO2. 2 uses 100 years and 3 uses 20.
Methane complicates this. CO2 accumulates for centuries, while methane is about 80 times as powerful over 20 years but breaks down after about 12. One conversion factor fits both gases poorly.
What 4 changes
About a decade ago, University of Oxford scientists developed GWP* ("GWP star"), which equates rates of methane emissions to single pulses of CO2. Steady emissions are roughly offset by natural breakdown, so they add little new warming. Cuts can therefore show up as "negative" emissions.
Climate scientists quoted in the article call the science legitimate. Their objection is to its use for national or industry targets, because it effectively treats today's high emissions as the baseline. Earlier this year, 42 prominent climate scientists warned that it allows "5" targets that undercut methane cuts. New Zealand, where livestock makes up nearly half of emissions, adopted such a target last year.
What the report found
The modeling, by the consultancy 6, covers the top 10 livestock exporters that signed the 7, a commitment to cut methane 30 percent by 2030. They include the US and Brazil.
If those countries really did cut 30 percent, they could claim 898 million metric tons of "negative" CO2 under GWP*. The remaining emissions would still equal 640 million tons under GWP100. That 1,538-million-ton gap exceeds Indonesia's total 2025 emissions.
Two cautions apply. Greenpeace is a campaign group, and it calls GWP100 "atmospheric reality," although that is also an accounting convention. The gap measures the distance between two metrics, not something observed in the air. The article also has some apparent number problems, such as a US figure of "218 metric tons" that almost certainly means 218 million.
A second study: timescale alone
A separate study in Frontiers in Sustainable Food Systems compared GWP20 and GWP100 across 222 food items. Its authors are University of California, Los Angeles, researchers and a campaigner from the Center for Biological Diversity. Beef-based meals went from about 3,500 grams of CO2 equivalent to more than 7,000, while most other foods barely changed. The authors want policymakers to use more than one metric.
Together, the studies show how far metric choice alone moves livestock's number, from negative to double. What the article leaves open is how UN reporting rules would treat GWP*-based claims, and whether other governments will follow New Zealand. Industry groups did not respond to requests for comment.
Two new analyses argue that the way methane is counted can drastically change the apparent climate record of livestock, especially beef. One, commissioned by Greenpeace International and published Oct. 29, finds that big livestock exporters could cut actual methane by 0.6 percent by 2030 and still report a 30 percent reduction. The other, by University of California, Los Angeles, researchers and a Center for Biological Diversity campaigner, finds that a beef meal's footprint roughly doubles when counted over 20 years instead of 100.
Both land just before the UN climate summit, known as the Conference of the Parties or COP, in Turkey. They also follow a UN report that said the chance of limiting warming to safe levels is vanishing and that methane must fall fast.
Why methane is hard to count
Climate reporting needs a common unit, the carbon dioxide equivalent. The conversion factor is global warming potential, or GWP: the warming a gas causes over a set period, relative to the same mass of CO2. 1 uses 100 years and 2 uses 20. Over 20 years, methane is about 80 times as powerful as CO2.
No single factor fits both gases well. CO2 accumulates for centuries, so every tonne adds warming that persists. Methane gives a burst of warming and then breaks down after about 12 years. Scientists have long argued that GWP100 doesn't reflect that behavior.
What 3 does
About a decade ago, University of Oxford scientists developed GWP*, pronounced "GWP star." Rather than converting each tonne of methane into CO2 equivalents, it equates rates of short-lived emissions to single pulses of CO2. The reasoning is that steady methane emissions are offset by natural breakdown, so they hold the atmospheric level roughly constant rather than adding to it. The method also reflects that methane from cow belches originates in vegetation that had already removed CO2 from the air.
Here is an illustration using one published version of the formula, not the report's own calculation, whose parameters the article doesn't give. It computes warming equivalent as (4.53 × current emissions − 4.25 × emissions 20 years ago), expressed in GWP100 units. Take a herd emitting 100 million tons of CO2 equivalent a year under GWP100:
Flat for 20 years: 453 − 425 = 28 million tons
Up 30 percent: 589 − 425 = 164 million tons
Down 30 percent: 317 − 425 = −108 million tons
So a steady herd keeps only about a quarter of its GWP100 number, and a substantial cut turns negative. This isn't physically absurd, because falling methane emissions really do reduce warming relative to the recent past. Climate scientists cited in the article call the underlying science legitimate.
The fight is over how it is used. The livestock industry, including in the US, has embraced a "4" underpinned by GWP*, which treats long- and short-lived gases separately. Earlier this year, 42 prominent climate scientists warned that the method threatens essential methane cuts because it lets countries or industries set "5" targets. New Zealand, where livestock accounts for nearly half of greenhouse gas emissions, became the first country to set such a target last year. Top climate scientists had also warned its prime minister in an open letter.
Sophie Nodzenski of Greenpeace states the core objection: "As long as you are not causing more warming than your very recent baseline, you're essentially fine." High emitters effectively get their current level treated as the starting line, and Greenpeace argues methane is already too high.
What the Greenpeace report found
The modeling, by the consultancy 6, covers the top 10 livestock exporters that have signed the 7, a commitment to cut methane 30 percent by 2030. They include Brazil and the US. Comparing GWP100 and GWP* for 2030 against 2020 emissions, it reports:
A 0.6 percent real cut in methane could be reported as a 30 percent reduction under GWP*.
With a real 30 percent cut, the group could claim 898 million metric tons of "negative" CO2 under GWP*.
The remaining 70 percent of emissions would still equal 640 million tons under GWP100.
The gap is therefore 1,538 million tons in a single year, which the report says exceeds Indonesia's total 2025 emissions.
For US livestock, the claim would be 218 "negative" tons against 178 million tons still emitted.
The report calls this a "bookkeeping trick." Jennifer Molidor of the Center for Biological Diversity compares it to tactics from fossil fuel companies and Big Tobacco.
Reading the numbers carefully
Several figures as printed deserve caution. The US "218 metric tons" is almost certainly a typo for 218 million, since the stated gap equals 86 million cars. The article also gives 640 million tons for both the cut needed to hit 30 percent and the remaining 70 percent, and those can't be the same number. The 1,538 total works only with 640 as the remainder. The vehicle comparisons don't match either: about 2 tons per vehicle globally against about 4.6 tons in the US example.
Then there is the framing. The report describes the gap as being between GWP* and "atmospheric reality," but GWP100 is also an accounting convention. The 1,538 million tons measures the distance between two metrics, not a quantity measured in the air. The commissioning body is also a campaign group, and industry groups did not respond to the reporter's requests for comment.
The second study: timescale alone
The study in Frontiers in Sustainable Food Systems, published Oct. 11, tests a different choice. The Intergovernmental Panel on Climate Change uses both GWP20 and GWP100, but food analyses mostly use GWP100. The authors applied both across 16 food categories and 222 items.
Beef-based meals came to about 3,500 grams of CO2 equivalent under GWP100 and more than 7,000 grams under GWP20. Most other foods barely moved. "Over 100 years you're basically averaging out the really high potency of methane," said co-author Jennifer Jay. The authors say policymakers and negotiators should rely on more than one metric.
What remains open
The two studies pull in opposite directions on purpose: GWP20 raises livestock's number, GWP* can make it negative, and GWP100 sits between them. Each answers a different question, whether about near-term warming or about the change in temperature from today's baseline. The article doesn't address whether any government beyond New Zealand plans to report this way, or how UN reporting rules would treat such claims. Nor does it give industry's defense beyond the "split gas" statement.
Remember
GWP* is not disputed as science; the fight is over using it for national targets and progress claims.
Baseline choice does the heavy lifting: anchoring to recent emissions rewards countries that already emit large amounts of methane.
GWP20 roughly doubled beef meals' footprint but barely moved most other foods, so beef drives the metric sensitivity.
Exelon, which owns six U.S. utilities serving close to 11 million customers, told investors on Friday that it could build 1.5 GW to 3.5 GW of 1 for $3 billion to $7 billion. A proposed $1 billion, 500-MW project in New Jersey comes on top of that, which brings the headline figure to as much as $8 billion and 4 GW.
The problem
The projects sit inside 2, the operator of the grid across much of the Mid-Atlantic and Midwest. CEO Calvin Butler said PJM's slow pace in adding generation is the biggest issue facing consumers there.
Two PJM fixes have stalled after the 3, the U.S. grid regulator, only partly approved them: a backstop procurement of capacity and a proposal called the 4. Butler said neither would have solved the problem, though both were steps forward. The article doesn't describe how either would work.
Exelon's case for owning batteries
Three of Exelon's states (New Jersey, Maryland and Delaware) let utilities own storage to bolster grid resiliency. CFO Robert Kleczynski said regulated ownership gives "certainty that projects get built," and described it as one option alongside competitive development, not a replacement.
He said customers would benefit in two ways:
Lower capacity prices. PJM's 5 pays resources to be available in future years, and more supply should reduce that price.
6. These federal credits offset part of a project's cost, and passing them through would ease the effect on rates.
The first project is Atlantic City Electric's 500-MW battery, developed with 7. It would be the largest in PJM. Exelon projects more than $700 million in net customer benefits, and New Jersey regulators are expected to decide late in the first quarter of next year.
The numbers in context
All of these figures work out to about $2,000 per kilowatt. That is hard to judge because the article doesn't give battery durations, and a kilowatt of four-hour storage costs far more than a kilowatt of two-hour storage.
Scale is also a limit. Exelon counts 11 GW of "high-probability" large new loads, such as data centers, and 9 GW of that is in Illinois, which isn't among the three states named. Its longer-term pipeline slipped from 25 GW to 23 GW; the article doesn't say why.
Jefferies analysts called the spending potential favorable but warned that regulatory uncertainty in 2027 could offset the added earnings. The $700 million benefit is Exelon's own estimate, and the article doesn't give its assumptions. Regulators' review will be its first public test.
Exelon, the Chicago-based owner of six U.S. utilities with close to 11 million customers, said on its Friday earnings call that those utilities could spend $3 billion to $7 billion on 1.5 GW to 3.5 GW of 1. A $1 billion, 500-MW project already proposed in New Jersey is additional. Together, that is $4 billion to $8 billion for 2 GW to 4 GW, so the $8 billion in the headline is the top of a range, not a commitment.
The supply crunch behind it
The utilities sit within 2, the grid operator for much of the Mid-Atlantic and Midwest. CEO Calvin Butler said PJM isn't adding generation quickly enough and called that the biggest issue facing consumers in its footprint.
He also pointed to two delayed PJM initiatives: a backstop capacity procurement plan and the 3 proposal. Both were held up because the 4, the U.S. regulator of interstate power markets, approved them only in part. "Neither proposal would have solved the reliability and affordability challenges facing our customers, but both represented important steps forward," Butler said. The article doesn't describe how either would work or which parts were approved.
Butler argues that storage and transmission can help fill the gap, and both happen to be assets a utility can earn a return on. That doesn't make the argument wrong, but it's worth keeping in view when reading the company's benefit claims.
Why utility ownership is the contested part
Across much of PJM, utilities deliver power while independent companies build generation and carry its market risk. Under a regulated model, customers pay for the asset through their rates and the utility earns an approved return. New Jersey, Maryland and Delaware allow Exelon's utilities to own storage to bolster grid resiliency, CFO Robert Kleczynski said.
His pitch is about control: "With regulated storage, we have certainty that projects get built, and control over when and how they're deployed." He added: "We view utility-owned storage as one option alongside competitive development, not a replacement for it."
The trade-off follows from the model. Certainty for the builder generally means that customers, rather than private investors, carry more of the risk that a project costs too much or earns less than expected. The article doesn't report any response from independent developers or consumer advocates.
How customers are supposed to come out ahead
Kleczynski named two mechanisms. The first is the flow-through of investment tax credits, federal credits that cover part of a project's capital cost. Passing them to customers would ease the effect on rates.
The second is lower capacity prices. PJM's 5 pays resources to commit to being available in future years, and one clearing price generally applies across the supply it buys. That is why a modest addition could matter. As an illustration using made-up price movement: if added supply cut the price by $1 per MW-day across about 135,000 MW, buyers would save around $49 million a year.
Two caveats apply, and both are the editor's reading rather than the article's. First, PJM's auction held in December 2025 cleared at its price cap while falling about 6.6 GW short of its reliability target. In a market pinned at a cap, new supply may first narrow the shortfall before it lowers the price. Second, capacity savings can spread across a wider area than the single utility whose customers pay for the battery, unless local grid constraints keep them closer to home.
The New Jersey test case
Atlantic City Electric, Exelon's southern New Jersey utility, developed its 500-MW proposal with 6, a private energy developer. It would be the largest battery installation in PJM. Exelon expects more than $700 million in net customer benefits and a decision from the New Jersey Board of Public Utilities late in the first quarter of next year.
The $700 million is the company's figure. The article doesn't give the time period, discount rate or capacity price assumptions behind it, so the regulatory review is where it can be tested.
The cost figures are remarkably uniform: both ends of the proposed range and the New Jersey project work out to about $2,000 per kilowatt. Without durations, that can't be benchmarked. A kilowatt of four-hour storage would imply about $500 per kilowatt-hour, while a longer-duration system would imply less. The article doesn't state the duration of any project.
How large this is against demand
Exelon's "high-probability" large load additions, meaning big new users of power such as data centers, held flat at 11 GW: 9 GW in Commonwealth Edison's (ComEd's) northern Illinois territory and 2 GW in the Mid-Atlantic. Its less certain future pipeline fell to 23 GW from 25 GW, with 14 GW at ComEd and 9 GW in the Mid-Atlantic. The article doesn't explain the decline.
There's a geographic mismatch here. Most of the near-term load is in Illinois, which isn't among the three states named as allowing utility-owned storage. Batteries can also be credited with less than their nameplate capacity in PJM's market, so 4 GW of storage wouldn't count as 4 GW of firm supply.
Transmission is the bigger spending line. Exelon's plan has $16.3 billion for it through 2029, and the company sees another $12 billion to $17 billion of opportunity, including for 7. By this digest's arithmetic, storage and transmission upside combined comes to $16 billion to $25 billion, or about 38% to 60% of the current $41.7 billion capital plan, if all of it is additive and approved.
Results and the open questions
Third-quarter net income fell to $729 million from $875 million, partly because of higher rate-case writeoffs (costs disallowed in a utility's pricing proceeding), storm costs and interest expenses. Revenue rose to $7.3 billion from $6.7 billion. Adjusted earnings rose to 87 cents a share from 86 cents, and year-to-date adjusted earnings of $2.20 a share were up 1%. ComEd's weather-normalized electric sales rose just 1.3%, a reminder that the large-load growth is still mostly a forecast.
Jefferies analysts called the results and spending potential "favorable" but warned that regulatory uncertainty in 2027 could offset the extra earnings. The first signal comes next spring in New Jersey. The article leaves open whether Maryland and Delaware would follow, and when the rest of the 1.5 GW to 3.5 GW would actually be proposed.
Remember
All of Exelon's battery figures imply about $2,000 per kilowatt, but no project durations are given to benchmark them.
Most of Exelon's near-term large load, 9 of 11 GW, is in Illinois, outside the three storage-ownership states named.
Possible storage and transmission spending could add 38% to 60% to Exelon's $41.7 billion capital plan, if fully additive and approved.
In August, 1, the world's second-largest wind turbine supplier, began operating a data center campus in Ulanqab, Inner Mongolia, fed by renewable electricity delivered directly to the site. It plans to expand past 2 gigawatts (GW) and says the campus could become the world's largest standalone AI data center. It also says customers can lock in rates 20% below grid prices for a decade. Those are company claims, and the article doesn't explain how the site stays powered when wind and sun drop.
The campus fits a national policy. China wants renewables to supply more than 80% of the electricity used by new data centers in its major computing hubs. The US has moved the other way: the Trump administration scrapped a requirement that AI data centers on federal land be paired with clean generation.
Can the supply cover the demand?
China's computing centers used about 170 2 (TWh) in 2025, or 1.6% of national electricity. Beijing expects roughly 800 TWh, about 6%, by 2030, as AI computing capacity grows more than sixfold. Annual renewable generation is planned to rise from 4,000 to about 6,000 TWh.
Those figures imply that data center growth of 630 TWh equals about a third of the added renewable output. That is a big claim on new supply, but China has form: its 2021–2025 renewable generation ran roughly 20% above target.
Build speed is the advantage
China added an estimated 540 GW of generating capacity in 2025, more than 80% of it renewable. The US added 54 GW, 60% renewable. Because wind and solar produce less energy per gigawatt than gas, the tenfold gap overstates the difference in actual electricity.
David Fishman of the 3, an Asia-Pacific energy consultancy, argues that this building capacity is what makes the green requirement affordable: China can restrict data centers to renewables because it can readily build everything else.
Siting helps too. "4," a program launched in 2022, steers computing toward less populated western regions rich in renewable resources. Fishman says Chinese data centers haven't raised retail power prices or drawn a comparable public backlash, though that rests on his assessment.
The US path
US data centers used 176 TWh in 2023, about 4.4% of national electricity, and could reach 325–580 TWh by 2028, according to 5. 6, an energy research firm, projects 13.2–16.4 GW of new gas capacity a year from 2026 through 2035, more than triple the 2023–2025 average. A recent poll found 72% of Americans oppose data centers in their communities.
Kyle Chan of the 7 says the US still leads in AI models and chip efficiency. Whether that offsets China's lead on power, and whether China's renewables can keep pace with its computing plans, remains open.
In August, 1, the world's second-largest wind turbine supplier, began operating a data center campus in Ulanqab, a city in Inner Mongolia. The site runs on renewable electricity supplied directly rather than through a conventional grid connection. Envision plans to expand it beyond 2 gigawatts (GW) and says it could become the world's largest standalone AI data center. The company also says customers can lock in rates 20% below grid prices for ten years.
The project illustrates a bet China is making at national scale: that its wind, solar and battery industries can deliver cheaper power to data centers and get them online faster. Beijing is targeting renewables for more than 80% of the electricity used by new data centers in its major computing hubs. The US has moved in the opposite direction. The Trump administration scrapped a requirement that AI data centers on federal land be paired with clean generation.
"China doesn't want a trade-off between having faster data center build-out but sacrificing on the energy transition," said Kyle Chan, a fellow at the 2, a Washington think tank.
The size of the load
China's computing centers consumed about 170 3 (TWh) in 2025, 1.6% of national electricity use. Beijing estimates about 800 TWh by 2030, or roughly 6%, as it expands AI computing capacity more than sixfold. That is a 4.7-fold rise in electricity in five years, or about 36% a year compounded.
The same plan calls for annual renewable generation to climb from 4,000 to about 6,000 TWh, a 50% increase. Some rough arithmetic from those numbers, which is ours rather than the article's and uses rounded percentages:
Total demand: 170 TWh at 1.6% implies a national total near 10,600 TWh. And 800 TWh at 6% implies about 13,300 TWh in 2030, a rise of about 2,700 TWh.
Data centers' share of growth: the added 630 TWh is about a quarter of that rise and about a third of the 2,000 TWh of new renewable output.
Renewables' share of supply: it would move from about 38% to about 45%.
So the plan is not obviously out of reach, but data centers would absorb a large slice of new clean power that could otherwise displace other generation. China's record helps its case: annual renewable generation between 2021 and 2025 ran roughly 20% above target.
A single campus shows why directly supplying these loads is an engineering problem. A 2 GW site running flat out for all 8,760 hours of a year would use about 17.5 TWh, roughly 2% of the 2030 estimate. As an illustration, if a wind and solar mix delivered 30% of its rated output on average (a measure called the 4), matching that energy would take nearly 7 GW of generators, plus storage to cover the hours when output falls short. The article gives no figures for Ulanqab's generation or storage.
Why China can afford the condition
In testimony to the US House Select Committee on Strategic Competition with China in April, Chan described a divide: the US leads in large AI models and advanced chips, while China has the edge in building power plants quickly and at scale.
The 2025 numbers support the second half of that. China added an estimated 540 GW of generating capacity, more than 80% of it renewable. The US added 54 GW, 60% of it renewable. That is a tenfold gap in capacity, though less in energy terms, since wind and solar produce less per gigawatt than gas and China's additions lean more heavily on them.
David Fishman, a principal at the 5, a consultancy on Asia-Pacific power and gas markets, argues that this capacity is what makes the green requirement possible. "You can enjoy this luxury of saying, 'We want green data centers,'" he said, because China already builds conventional power assets so readily. Chan adds that fast solar construction and large battery manufacturing make it easier to secure power, which he considers a key reason China is building data centers faster.
Siting and the absence of backlash
Location is deliberate policy. "6," launched in 2022, steers computing infrastructure toward less densely populated western regions with abundant renewable resources. Inner Mongolia, about 1.7 times the size of Texas, is a clear fit. A regional vice chairman said in June that it holds 57% of China's wind power resources and 21% of its solar resources. Those figures describe potential rather than output, and they come from a local official promoting the region.
Fishman says data centers haven't raised Chinese retail electricity prices or provoked a comparable backlash, partly because many sit far from population centers and are only one of several sources of demand growth. The article cites no Chinese polling, and it's worth knowing that China's retail tariffs are largely government-set, so bills there don't respond to local demand the way many US bills do.
The American path
US data centers used 176 TWh in 2023, about 4.4% of national electricity, according to 7, a federal research lab. Its 2024 report projected 325–580 TWh by 2028. The two countries' current totals look similar, but the years differ and "computing centers" and "data centers" may not be counted identically.
8, an energy research firm, projects 13.2–16.4 GW of new gas-fired capacity a year from 2026 through 2035, depending on demand, which is 132–164 GW over the decade and more than triple the 2023–2025 annual average. A Sierra Club analysis, reported by Bloomberg, projects that emissions from new 9 alone could match Mexico's total annual emissions by 2030. The Sierra Club is an environmental advocacy group, and the article doesn't give the analysis's assumptions.
Local politics adds friction. A Washington Post-ABC News-Ipsos poll found 72% of Americans opposed building data centers in their communities, with electricity bills an issue ahead of the midterm elections.
What remains open
The article reports targets and company claims more than outcomes. It doesn't say what grid price Envision's 20% discount is measured against, how the Ulanqab site handles calm, dark periods, or whether the 80% target means physically delivered power or some form of accounting. It also doesn't address coal, which still generates more than half of China's electricity and is a major industry in Inner Mongolia itself.
Chan argues the US keeps an edge in AI models and chip efficiency, and says "both countries are trying to play to their strengths." The US has to add supply quickly while managing costs and community opposition. China has to show that its renewable build-out can keep up with its computing ambitions.
Remember
By these figures, data center growth equals about a third of China's planned 2,000 TWh renewable increase by 2030.
China's tenfold capacity lead in 2025 overstates its energy lead, because wind and solar produce less per gigawatt than gas.
Envision's 20% discount is a company claim; how the site covers low wind and sun goes unreported.
Delegates are about to meet in Antalya, Turkey, for 1, this year's UN climate summit. Carbon Brief has analysed around 100 documents and built an interactive table of what each country and negotiating bloc wants, rating positions from "priority" to "oppose". It will be updated during the talks.
The summit has an unusual setup: Australia leads the negotiations while Turkey hosts and runs its own side programme.
Who pays
Climate finance is again the sharpest dispute. Developing countries won a place on the agenda for a "work programme" on finance. They see it as a way to press developed countries for public money under 2 of the 3, and some propose formal "burden sharing".
Developed countries would rather focus on improving access to existing funds and widening the pool of donors. Some small-island states back those goals too. All this comes as major donors cut aid budgets and the Trump administration presses 4, the publicly backed lenders such as the World Bank, to drop climate objectives.
Just transition and adaptation
At COP30 in Brazil last year, nations agreed to create a mechanism for a "5", meaning a shift to a low-carbon economy that protects affected workers and communities. Key aspects were settled in June, but its scope and any link to finance remain disputed. Civil society groups call getting it running a "key expected outcome".
The "6", meant to drive preparation for climate impacts worldwide, has 59 agreed indicators. A taskforce must refine them before COP32 in Addis Ababa. June's talks failed to settle the details, and developing countries want money for adaptation, not just tracking, plus reassurance on last year's pledge to "triple adaptation finance".
Emissions: the weak spot
The 7 is the only formal agenda item about cutting emissions. It made no progress in June, and parties disagree on whether it should continue or simply close.
New national climate plans, called 8 (NDCs), cover the period to 2035 and were due in 2025. Only 150 parties, responsible for three-quarters of global emissions, have filed. Iran, Vietnam, Egypt and Argentina have not, and the US has withdrawn its plan.
COP31 also launches the second 9, a review of collective progress that concludes in 2028.
Outside the formal talks
Turkey's "action agenda" pushes global targets for electrification, waste and building emissions. Australia may try to capture some, such as the electrification goal, in a "10", an overarching summit decision. Separately, 105 parties signed a letter seeking to embed ocean action in UN climate structures.
The party-by-party ratings sit in the interactive table, not in the accompanying text, so this summary can only describe the broad camps.
Delegates will soon gather in the Turkish resort city of Antalya for 1, the annual UN climate summit, against what Carbon Brief describes as a backdrop of war, energy crisis and climate extremes. To track who wants what, Carbon Brief analysed around 100 documents and built an interactive table of countries and negotiating blocs.
The table has four columns: party, topic, specific issue, and position. Positions run from "priority", meaning a party is likely to push an issue, to "oppose", meaning it is likely to push against it. An invented row, for illustration only, might read: a negotiating bloc, climate finance, the finance work programme, priority. Carbon Brief calls the table a "living document" and will update it during the summit.
The party-by-party ratings sit in the table rather than in the accompanying text, so what follows describes the issues and broad camps, not individual countries' scores.
The summit's structure is also unusual. Under a joint presidency, Australia leads the negotiations while Turkey hosts the conference and promotes its own priorities outside the formal talks.
Just transition: agreed in name, unsettled in detail
At COP30 in Brazil in 2025, nations agreed to establish a practical mechanism to drive a "2", a shift to a low-carbon economy that protects affected workers and communities. It is called the Belém-Antalya mechanism (BAM), and often the just transition mechanism (JTM).
Key aspects were agreed at the June negotiations, under the talks' "just transition work programme". Many details are still missing. Parties disagree on the mechanism's scope and on whether it should be tied to the provision of finance. Civil society groups have called getting it running a "key expected outcome" of COP31.
Climate finance: who pays, and from which budget
Developing countries have successfully pushed for a "work programme" on climate finance to appear on the agenda. They see it as a lever for securing more public money from developed countries under 3 of the 4, the provision on developed countries' finance obligations. Some propose a "burden sharing" arrangement, which would address how the provision of finance is divided up.
Developed countries prefer a broader focus: improving access to existing finance and widening the range of donors. The camps are not perfectly tidy, since some developing countries, including small-island states, support those goals as well.
The politics are getting harder. Major donors are cutting aid budgets, and the Trump administration is pressing 5, the publicly backed lenders such as the World Bank, to drop their climate objectives.
A second finance track concerns Article 2.1c of the Paris Agreement, which is about making all global "financial flows" consistent with climate action. Countries are discussing it under the "6". Views differ on what it involves, with developing countries again trying to keep the focus on developed countries' responsibility to support them financially.
Adaptation and mitigation: two stuck tracks
The "7" (GGA) is intended to drive adaptation worldwide. COP30 agreed a list of 59 indicators for assessing progress, and nations must refine them before COP32 in Addis Ababa, Ethiopia. A taskforce is working out how to use and track them, which Carbon Brief describes as a highly technical process. June's talks failed to agree the details of the goal.
Developing countries broadly stress finance to fund adaptation, not merely to measure it. They also want reassurance about last year's pledge to "triple adaptation finance".
The 8 (MWP) may be the more telling case. It is the only formal agenda item concerning cuts to greenhouse gas emissions, and negotiators made no progress on it in June. Among other disagreements, parties are split on whether it should run for the next few years or simply close.
Stocktake and national plans: partial coverage
The first "9" (GST), completed in 2023, assessed the state of climate action under the Paris Agreement. Its mitigation package included "transitioning away from fossil fuels", tripling renewable energy and "halting and reversing deforestation" by 2030. Parts of that package remain contentious, particularly among large developing countries and fossil-fuel exporters. Developing countries have persistently argued that they need more finance to deliver it.
National climate plans, known as 10 (NDCs), were meant to be updated by 2025, informed by the stocktake, and cover the period to 2035. So far 150 parties, responsible for three-quarters of global emissions, have submitted. Iran, Vietnam, Egypt and Argentina are among those without new plans, and the US has withdrawn its plan under the Trump administration.
Some parties, including the EU, want the missing plans filed before COP31 and all plans aligned with the 1.5C temperature limit. The figures given measure how many plans exist, not how ambitious they are, so the three-quarters number says nothing about alignment.
COP31 will also launch the second global stocktake, which concludes in 2028.
The action agenda: outside the formal text
Turkey's "action agenda" is a complementary track where governments and non-state actors can advance specific, real-world solutions. Its priorities include global targets for electrification, reducing waste and reducing building-sector emissions.
Those targets are not automatically negotiated outcomes, but there is a possible bridge. Australia intends to pursue a "11", an overarching summit decision, that may capture some of them, such as the electrification goal.
A presidency effort dubbed the "climate implementation bridge" is meant to turn NDC goals into an "investable project portfolio". The article gives no detail on how this would work or what money stands behind it. Separately, 105 parties signed a letter calling for COP31 to "put the ocean at the heart of climate action" by embedding ocean-based action in the architecture of the UNFCCC, the UN climate convention.
What remains open
The explainer sets out disputes rather than predictions. It does not say how much finance is being sought or how a burden-sharing formula would work. Those gaps, along with the fate of the MWP and the mechanism's link to finance, are the things to watch in Antalya.
Remember
Formal emissions talks are fragile: parties cannot agree whether the only agenda item on cutting emissions should even continue.
Finance splits are not purely north versus south; some small-island states back developed countries' goals on access and donors.
The 150 submitted national plans show coverage of three-quarters of emissions, which is not evidence they align with 1.5C.