Record Odds and Vanishing Gigawatts · Morning Gist
Wednesday, November 45 stories · 16 min
Record Odds and Vanishing Gigawatts
Today's big numbers cover temperature, transmission, wildfire and data center demand, and each depends on what its model or forecast leaves out.
Picked from 39 new articles across 13 sources · arrow keys for other days
Today in 30 seconds
30s left
2026 may tie 2024 as warmest year, with 67% odds of a record; record-strength El Niño gives 2027 96% odds, near 1.7C. story 1 ↓
Rhodium estimates the permitting bill could lift annual US transmission additions 167% to 262%, though it skipped a full grid simulation. story 2 ↓
US wildfire building losses could nearly triple by 2060, with 300,000 at risk absent change, a study finds; its models omit wind. story 3 ↓
PJM refiled its data center power backstop after federal rejection; the 6.8-GW purchase could shrink to roughly 630 MW as forecasts fall. story 4 ↓
Hannah Ritchie proposes a philanthropic buyout to make IEA data free, estimating that sales bring in perhaps €6–10 million a year. story 5 ↓
Democrats won control of Georgia's utility regulator, the Public Service Commission; nearly 20 years of unanimous Republican control ended last year.
1/5Carbon Brief· Zeke Hausfather· Nov 3
2026 on track to tie 2024 as warmest year on record
Carbon Brief projects 2026 at about 1.52C above pre-industrial levels, level with 2024's record. A likely record-strength El Niño should then push 2027 to around 1.74C, though that lies beyond its model's historical experience.
Why it matters · Expect conflicting "warmest year" headlines in January and a likely temperature jump in 2027; the dataset odds and model limits show how much weight each claim deserves.
Know this first
Context from the editor, not the article · 26 sec
1 · The Pacific's warm-cool cycle
The El Niño-Southern Oscillation swings the tropical Pacific between warm El Niño and cool La Niña phases. Greenhouse gases drive long-term warming, while this cycle pushes individual years above or below that rising trend.
2 · Why six temperature records
Several groups estimate global surface temperature independently. Most combine land and ocean measurements, while reanalyses use weather models constrained by observations. Their results differ by hundredths of a degree, which can decide a close record.
3 · What 1.5C refers to
The Paris Agreement's 1.5C limit refers to long-term warming above pre-industrial levels, not to any single year. One hot year can exceed 1.5C without the goal itself being breached.
2/5Heatmap· Robinson Meyer· Nov 2
Rhodium: permitting bill could more than double annual US transmission additions
Rhodium Group estimates a bipartisan permitting bill could raise yearly US transmission additions 167% to 262%. It skipped a full grid study for lack of time, so Heatmap's Robinson Meyer says the benefit may be undercounted.
Why it matters · Transmission is a main bottleneck for moving wind and solar to demand, and this is an early independent number for what permitting reform might unlock, with a known blind spot.
Know this first
Context from the editor, not the article · 28 sec
1 · Why transmission gets stuck
The best wind and solar sites are often far from cities, so decarbonizing needs long new power lines. These cross many jurisdictions, and those needing federal approval can face lengthy environmental reviews before construction starts.
2 · Interconnection queues
Before a new power plant connects, grid operators study how it would affect the wider network. Projects often wait years for this, and US queues hold more proposed capacity than the entire existing generating fleet.
3 · Two kinds of energy model
Economy-wide models track energy supply, demand and prices across regions and years. Network models simulate the physical grid, including individual lines and power flows. The second kind captures far more detail but needs much more time and computing.
3/5Inside Climate News· By Jake Bolster· Nov 3
US Buildings Lost to Wildfires Could Nearly Triple by 2060, Study Finds
University of Colorado Boulder researchers combined climate models with development patterns and estimated that 300,000 buildings could burn or be damaged if the US changes nothing, nearly triple the number threatened today.
Why it matters · Where houses get built is treated here as a main driver of wildfire losses, which makes building codes and zoning practical levers alongside emissions and forest policy.
Know this first
Context from the editor, not the article · 31 sec
1 · Hazard versus exposure
Wildfire damage depends on two things: how much land burns and what stands on it. Climate research usually tracks the first. Insurers and planners also need the second, because a large fire in empty forest destroys few buildings.
2 · Fire in the West
Many Western forests and grasslands evolved to burn periodically. Decades of fire suppression, hotter and drier conditions, and new housing near flammable vegetation have all raised the stakes of fires that were once a normal part of the landscape.
3 · Recent urban firestorms
Colorado's Marshall Fire in December 2021 and the Los Angeles fires of January 2025 burned through suburbs and city neighborhoods, destroying thousands of structures. Both were driven by extreme winds, and both challenged the idea that wildfire stays in the backcountry.
4/5Utility Dive· Ethan Howland· Nov 3
Grid operator PJM refiles data center power backstop after federal regulators' rejection
PJM, a major US grid operator, revised its plan to buy extra capacity for data center growth after regulators rejected most of it. The changes reduce utility risk, but the purchase's size is now uncertain.
Why it matters · It tests whether a grid can pay for data center demand without leaving other customers exposed, when forecasts of that demand can move by gigawatts within months.
Know this first
Context from the editor, not the article · 29 sec
1 · PJM's capacity market
PJM runs the grid across 13 mid-Atlantic and Midwestern states plus Washington, D.C. Its base residual auction pays power plants years in advance to be available at peak demand, so supply shortfalls appear long before delivery.
2 · Who sells retail power
In states with retail competition, such as Pennsylvania and Ohio, customers can buy electricity from competing power marketers. The local utility serves those who don't choose one. Both kinds of seller are responsible for securing supply for their customers.
3 · Federal review of grid rules
The Federal Energy Regulatory Commission oversees wholesale power markets and must find their rates and rules just and reasonable. When it rejects a proposal, a grid operator can revise and refile it, which can delay the plan.
5/5Sustainability by Numbers (Hannah Ritchie)· Hannah Ritchie· Nov 3
Hannah Ritchie proposes a philanthropic buyout to make International Energy Agency data free
Researcher Hannah Ritchie argues the mostly taxpayer-funded International Energy Agency should drop its data paywall. She suggests a donor cover the lost sales for 5–10 years, at roughly €30–60 million.
Why it matters · Much public debate about the energy transition rests on free datasets with known holes, so access rules shape which numbers researchers, journalists and lower-income countries can actually use.
Know this first
Context from the editor, not the article · 25 sec
1 · What the IEA is
The International Energy Agency is an intergovernmental body created in the 1970s, after the 1973 oil crisis. It compiles global energy statistics and publishes widely cited analysis and forecasts for governments.
2 · Primary versus final energy
Primary energy is what is in raw sources such as coal, oil and sunlight, before conversion. Final energy is what reaches users as electricity, heat or fuel. Conversion losses make the two totals differ.
3 · The open-data campaign
Hans Rosling, the Swedish statistician known for his data-driven talks on global health, pressed international organisations to release their statistics. He died in 2017. Hannah Ritchie continues the argument.
Watts per square metre, the rate of energy flow averaged over Earth's surface.
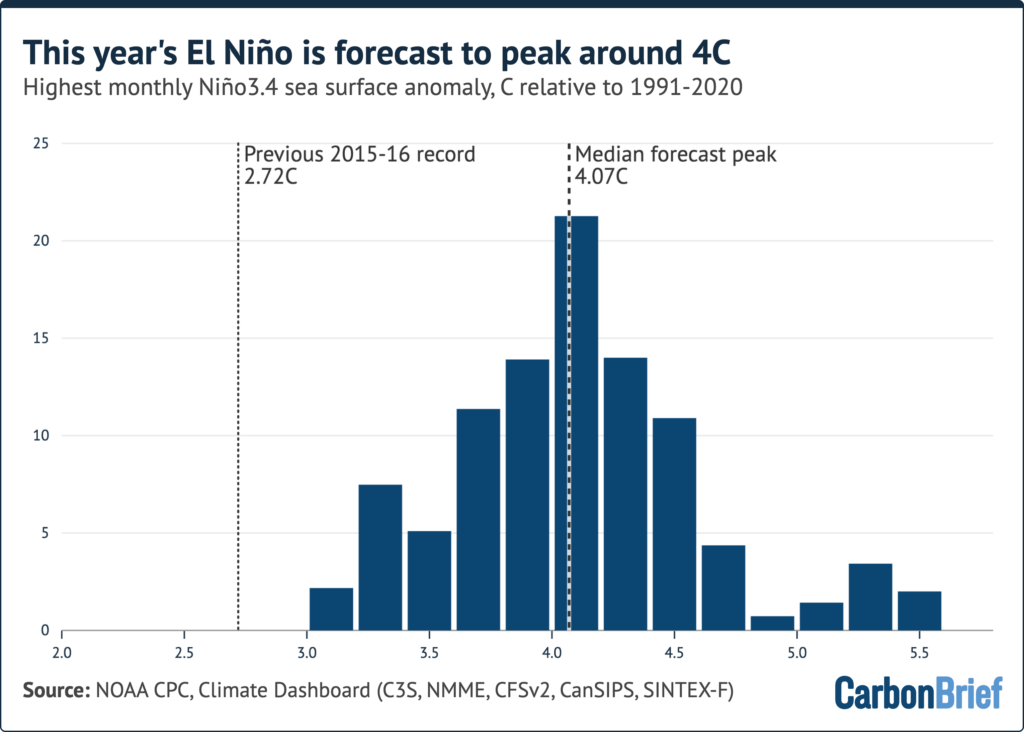
Distribution of 656 model runs for this El Niño's peak, clustered around 4C in the Niño3.4 region.1 / 4
Carbon Brief's latest quarterly climate update, by Zeke Hausfather, projects that 2026 will finish about 1.52C above 1 levels (the 1850-1900 average), with a 90% range of 1.50C to 1.55C. That effectively ties 2024's 1.52C. Averaging six global temperature datasets, the analysis gives 2026 a 67% chance of a new record.
What changed mid-year
January to June ran cooler than the same months of 2024, as weak 2, the cool phase of a tropical Pacific cycle, gave way to 3, the warm phase that releases ocean heat into the atmosphere. August then beat the previous August record by about 0.12C, in all six datasets. January-September stands at 1.45C, about 0.06C behind 2024.
El Niño strength is usually gauged in 4, a patch of the central equatorial Pacific. Its daily temperature anomaly broke the November 2015 record in September and has stayed above it since. Across 656 forecast runs from 14 models, the average peak is around 4C in December, up from about 3.6C expected in July.
Why January's verdict may split
Odds of a 2026 record vary widely by dataset: 5, an independent US group, 97%; NASA's 6 82%; the UK's 7 72% (data through August only); Japan's 8 48%; NOAA 34%; and Europe's 9 18%.
The arithmetic explains much of this. The last three months must beat 2024 by about three times the nine-month deficit. Berkeley Earth trails by 0.03C, so it needs about 0.08C. ERA5 trails by 0.09C, so it needs about 0.27C. The deficits differ because groups fill data gaps differently, and because ERA5 and JRA-3Q are 10, which use a weather model constrained by observations. Carbon Brief says none is "right".
2027 is the bigger number
Global temperatures lag the tropical Pacific by about three months, so this El Niño's largest effect arrives in 2027. Carbon Brief projects 1.74C, with a 90% range of 1.54C to 1.95C and a 96% chance of a record. Even the low end beats 2024.
The main caveat is that this El Niño lies beyond anything in the statistical model's training record. If it warms the planet no more than the strongest past events, 2026's record odds fall to about 50%. The projected 0.2C rise into 2027 would also exceed the jump after any earlier El Niño. And a single year above 1.5C does not breach the Paris Agreement goal, which reflects a longer-term average.
The underlying trend
11, the gap between solar energy absorbed and energy radiated to space, is the underlying driver. NASA's 12 satellite instruments show it rising from about 0.53W/m2 in the record's first decade to about 1.25W/m2 in the latest, faster than most climate models simulate. The reasons remain unclear.
Three-quarters of the way through the year, Carbon Brief's quarterly "state of the climate" update, written by Zeke Hausfather, finds 2026 virtually certain to finish as the warmest or second-warmest year on record. Its best estimate is about 1.52C above 1 levels (the 1850-1900 average), with a 90% range of 1.50C to 1.55C. That effectively ties 2024's 1.52C, though the analysis gives 2026 a 67% chance of edging ahead in the average of six global temperature datasets. The larger finding concerns next year: 2027 is projected at about 1.74C, with a 96% chance of a new record.
A slow start, then a sharp turn
From January to June, every month ran cooler than its 2024 counterpart, as weak 2, the cool phase of a recurring tropical Pacific pattern, gave way to 3, the warm phase, which releases ocean heat into the atmosphere.
The third quarter changed the picture. July was second-warmest in the six-dataset average. August beat the previous August record by about 0.12C and set a record in all six datasets, by margins of 0.07C to 0.13C. September, at about 1.62C, was second-warmest, roughly 0.08C below September 2023. July-September effectively tied 2023 as the warmest such period, at about 1.57C. January-September stands at 1.45C, around 0.06C behind 2024.
An El Niño beyond the instrumental range
El Niño strength is usually measured by the sea surface temperature anomaly in 4, a patch of the central equatorial Pacific. In September the daily value broke the record set in November 2015 and has stayed above it every day since. By 18 October it was about 3.5C above the 1996-2025 average and 0.4C above the 2015 peak. September also had the highest monthly anomaly since records began in the mid-1800s.
Carbon Brief examined 656 forecast runs from 14 5, which simulate ocean and atmosphere physics. On average they put the peak at around 4C in December, more than 1C above the prior record. In July, the expected peak was about 3.6C. Tree-ring and coral evidence suggests it could possibly be the strongest event in a millennium.
Where the heat landed
About 22% of Earth's surface had its warmest July-September since at least 1940, and about half had one of its five warmest. Only about 0.5% had one of its five coldest. Record warmth covered more than 90% of the Niño3.4 region and about 85% of France and Iberia. In September alone, 55 countries set national records for that month.
Western Europe had its hottest summer on record, averaging 21.7C, 2.5C above the 1991-2020 average and beating 2003. Spain's September beat its 1987 record by 0.7C. European rivers saw their lowest summer flows in records going back to 1992, and burned area across the EU was almost twice the 2006-25 average by early September. The contiguous US had its hottest summer and warmest September, with about 59% of the country in drought. India's monsoon ended 12.6% below normal, its driest in 11 years.
How the projection works, and its weak point
The 2026 estimate combines observed temperatures through September with El Niño forecasts. A statistical model, trained on the historical link between year-to-date temperatures, El Niño conditions and annual results, turns those inputs into probabilities. It also gives 2026 a 93% chance of exceeding 1.5C in the six-dataset average, which would make it the second such year after 2024. That would not itself breach the Paris Agreement goal, which reflects a longer-term average.
The weak point is extrapolation. The forecast El Niño lies outside anything in the training record, and the model assumes the historical relationship still holds. If this event warms the planet no more than the strongest past events did, the odds of a 2026 record fall to about 50%.
Why January's verdict may split
Carbon Brief's dataset-by-dataset odds of a 2026 record are:
The spread comes down to arithmetic. The final three months are a quarter of the year, so they must beat 2024 by about three times the nine-month deficit. Berkeley Earth is 0.03C behind, so October-December needs to run about 0.08C warmer than in 2024. ERA5 is 0.09C behind, so it needs about 0.27C.
The deficits differ because of method. Groups fill gaps differently in sparsely observed regions such as the poles and use different sea surface temperature records. Reanalyses instead use a weather model constrained by observations to estimate air temperatures everywhere. Carbon Brief says none is "right". There is precedent: in January 2015, NASA and NOAA called 2014 most likely the warmest year, while the Met Office described it as tied with 2010.
2027 carries the real signal
Global temperatures lag the tropical Pacific by about three months, so an El Niño peaking around the end of 2026 has its largest effect in 2027, much as the 2015-16 event lifted 2016. Carbon Brief's 2027 median is 1.74C, with a 90% range of 1.54C to 1.95C. Even the low end would exceed 2024. There is a 98% chance that at least one of 2026 or 2027 sets a record.
This estimate is far less certain. None of 2027 has been observed, and the outcome depends on both the peak and how fast the event fades. The projected rise of about 0.2C from 2026 is larger than the jump after any previous El Niño, and whether the historical relationship holds at this scale remains to be seen.
The trend underneath: energy imbalance
11 is the difference between energy absorbed from the sun and energy radiated to space. About 90% of the resulting heat ends up in the oceans. NASA's 12 satellite instruments show it rising from about 0.53W/m2 in March 2000-February 2010 to about 1.25W/m2 in March 2016-February 2026, a 2.4-fold increase. For scale (our arithmetic, not the article's), 1.25W/m2 across Earth's surface is roughly 640 terawatts, around 30 times humanity's total energy use.
The annual high was 1.79W/m2 in 2023; the latest 12 months averaged 1.59W/m2. The imbalance typically dips as a strong El Niño peaks and the ocean sheds heat to space, so next year's may be slightly lower.
Several studies find the imbalance rising faster than most climate models simulate, for reasons that remain unclear. CERES tracks changes well, but its absolute level is anchored to ocean heat measurements, and satellite orbit changes add about 0.1W/m2 per decade of trend uncertainty. A 2021 study found satellite and in situ records agreed on the 2005-2019 increase, but over longer periods CERES shows more accumulation than some ocean heat estimates.
Sea ice: mixed signals
Arctic sea ice reached its minimum of 4.60m km2 on 12 September, tied for 10th lowest and 1.21m km2 above the 2012 record, after record daily lows on 39 days earlier in the year. Antarctic sea ice peaked at 17.59m km2, third lowest on record, and has hit record daily lows for much of the period since early October.
Remember
A split verdict in January would reflect method differences and tiny margins, not disagreement that the planet is warming.
The 2027 forecast rests on a historical relationship untested at this El Niño's strength, so treat its 0.2C jump cautiously.
Energy imbalance may dip in 2027 even as temperatures spike, because a strong El Niño vents ocean heat to space.
1, an independent energy research firm, has analyzed what a bipartisan permitting bill in Congress, known as 2, would do to US emissions. Heatmap got the first look. The article doesn't spell out the acronym or list the bill's provisions.
Its headline finding is that the bill's most significant provisions are likely climate-neutral in a worst case and could cut emissions in better ones. Those scenarios differ on the wider energy economy, such as growth and oil prices, not on how the bill is interpreted.
The transmission number
One of the larger findings concerns power lines, which carry electricity from the sunniest and windiest places to where people live. Rhodium estimates BAAJA could raise new transmission capacity added per year by 167% to 262% nationwide, compared with the past decade's average. That means roughly 2.7 to 3.6 times the recent pace. The article gives no absolute figures.
The bill helps in two ways. It directly expands the grid, and it changes environmental review law in ways that could benefit power lines. A federal 3, the most detailed form of review, takes on average twice as long for a transmission line as for a pipeline, according to Rhodium's data.
What the estimate leaves out
Heatmap's Robinson Meyer argues the figure may undercount the benefit, stressing "may." Rhodium did not run a 4, a simulation of the grid's physical footprint, power flows and bottlenecks. It modeled supply and demand across the broader energy system instead.
Meyer considers that reasonable, and probably the only option. A fuller analysis might have taken weeks and cost a lot of money and computing power. At the far extreme, the 5's 6 study of a 100% renewable Los Angeles modeled every line and substation, ran more than 100 million simulations and took three years.
The irony
Meyer's point is that the power sector routinely demands this kind of work. In many regions, a new solar farm or battery can't connect until operators complete an 7 of its effect on 8 across the grid, a main reason hookups take so long. BAAJA aims to change this by letting plants join in batches.
So a process mandated for individual projects is too slow to inform the legislators voting on how to fix it.
The comparison is rhetorical rather than exact: LA 100 was, by Meyer's own description, unusually exhaustive. The article also doesn't explain why a network study would raise Rhodium's estimate rather than lower it, so the undercount remains a possibility, not a finding.
The 1, an independent energy research firm, has published an analysis of what a bipartisan permitting bill known as 2 would do to US emissions, and Heatmap's Robinson Meyer and Emily Pontecorvo got the first look. This piece is Meyer's short follow-up newsletter, not the full story, so it doesn't spell out the acronym or itemize the bill. It focuses on one number and on what Rhodium could not check in time.
What Rhodium found
The bill's most significant provisions are, in Rhodium's analysis, likely neutral for climate in a worst-case scenario and could reduce emissions in more optimistic ones. Meyer is careful about what those scenarios vary. They are not different readings of the bill. They are different assumptions about the broader energy economy, such as economic growth or oil prices, which feed back into the emissions math.
The finding Meyer singles out is about transmission. Rhodium estimates BAAJA could increase new transmission capacity added per year by 167% to 262% nationwide, compared with the average rate of the past decade. An increase of that size means about 2.67 to 3.62 times the recent pace: if the past decade averaged 100 units a year (an illustrative figure), the bill would imply roughly 267 to 362. The article gives neither the real baseline nor the model's end date, so it isn't possible to convert this into miles or gigawatts from the text alone.
Why transmission moves
Rhodium credits two channels. First, the legislation affirmatively expands the grid, though the article doesn't say through which provisions. Second, changes to environmental review law could help power lines, which currently fare poorly under it. A federal 3, the most intensive level of federal review, takes twice as long on average for a transmission line as for a pipeline, according to Rhodium's data.
The study Rhodium didn't run
Meyer argues the estimate may undercount the benefit, with heavy emphasis on "may." Rhodium's authors did not run a full 4 of the US system, which would account for the grid's physical footprint, power flows and existing bottlenecks. They examined power supply and demand within the broader US energy system.
Meyer calls this reasonable and probably the only choice available. A more complete analysis might have taken weeks, along with substantial money and computing power. His benchmark for the upper extreme is 5, the 6's study earlier this decade of how quickly Los Angeles could reach 100% renewable energy. It modeled every transmission line and substation in the city, ran more than 100 million simulations on a supercomputer, and took three years. That was one city. Even a fraction of that effort at national scale, Meyer says, would have landed after the window to vote on the bill had closed.
The irony in interconnection
Here is Meyer's real point. In many parts of the country, a new solar farm or battery can't connect to the grid until operators complete an 7 of its effect on 8 everywhere else. He names this as one of the primary reasons hookups take so long.
BAAJA aims to fix this by allowing power plants to join the grid in batches. The article gives no further detail, but the general logic is familiar. Consider an illustrative case, not from the article: ten projects in one region, each studied in sequence. Each result depends on the projects ahead of it, so one dropout can force restudies down the line. Studying all ten together replaces that chain with one shared assessment. Federal regulators already pushed grid operators toward this "cluster" approach in a 2023 order; the article doesn't say how BAAJA's version relates to it.
So, as Meyer frames it, the analysis mandated for power plants is too slow to serve the legislators deciding whether to change that mandate.
How far to trust the argument
Three cautions apply.
The undercount is unproven. Meyer offers it as a possibility and doesn't explain why a network model would push the number up. Physical modeling could cut either way in principle. It might reveal lines that relieve costly congestion and are worth more than a simpler model assumes, or constraints that limit how much new capacity gets built or used. Until someone runs it, the 167% to 262% range rests on a model that doesn't represent the physical grid.
The comparison is loose. Meyer says the power sector requires "similar" studies all the time, while also calling LA 100 particularly exhaustive. A single project's interconnection study is not a three-year, 100-million-simulation research effort. The shared feature is the need to represent network effects, not the scale, and the delays in interconnection also depend on backlog and study sequencing.
The number describes potential. Rhodium's estimate says the bill "could" raise build rates. The article doesn't address what else limits construction, such as cost allocation, state siting or supply chains, and it doesn't say whether the range accounts for them.
Remember
Rhodium's emissions scenarios vary economic conditions such as growth and oil prices, not how the bill is interpreted.
Federal environmental impact studies take twice as long on average for transmission lines as for pipelines, per Rhodium data.
Treat 167% to 262% as a non-network estimate: no simulation of physical power flows or bottlenecks has tested it.
Wildfires could threaten almost three times as many buildings in the contiguous US by 2060 if the country keeps building, managing forests and handling climate change as it does now. That is the finding of a study published Tuesday in Nature Communications.
The headline figure is an average of 300,000 buildings damaged or destroyed. The news report doesn't say whether that is a yearly or cumulative total, or what baseline "almost triple" refers to.
Why pair climate with land use
The authors, from the University of Colorado Boulder's 1, combined 2, which simulate future heat and precipitation, with 3, meaning where development is likely to spread. The pairing matters because burned area alone doesn't tell you how many buildings are lost. "Where we have built is driving a lot of the risk," said lead author Virginia Iglesias, director of 4, the university's environmental data science center.
Where the fire goes
For 2023 to 2060, the study projects:
West: more than 1 billion 5 burned in total
Central grasslands: up to 111 million hectares
East: a five-fold increase in burned area by 2060, which the authors call a "growing misalignment" between where people assume it's safe to build and where the risk is heading
The Western figure deserves a second look. It works out to about 26 million hectares a year, roughly nine times the recent US average of about 3 million. The article doesn't say whether this is the top of a range or how it is calculated.
Who is exposed
The researchers were surprised to find high risk in socioeconomically vulnerable Western communities, not only the wealthy enclaves people associate with wildfire. Iglesias said these places may lack money for mitigation, face shakier insurance, and find recovery "much more difficult, if not impossible."
The caveats
Max Moritz, a wildfire specialist at the University of California, Santa Barbara, who wasn't involved, called the approach novel and "a real contribution." But he noted a gap: "These kinds of models—they don't do wind." Unusually strong winds fueled the Boulder fire of 2021 and the Los Angeles fires of 2025, so some places "could be even worse than we think."
Risk could also fall. This is a no-action scenario, and the authors themselves consider it unlikely to persist. Parts of California and Colorado now require new homes to meet fire codes matched to local risk. Still, no regional or federal standard exists, and these rules don't cover older homes.
A study published Tuesday in Nature Communications estimates that the number of buildings threatened by wildfire across the contiguous US could almost triple by 2060. The condition is that the country keeps ignoring climate risk, mismanaging forests and building in places where large fires naturally occur. On average, the researchers found, 300,000 buildings could be damaged or destroyed.
The team is from the University of Colorado Boulder's 1. Lead author Virginia Iglesias, director of 2, the university's environmental data science center, frames the work as a warning rather than a forecast: "It's a call to action. Not doing anything is always an option. Here's what happens."
The problem and the method
Estimating future building losses is hard because it needs two separate projections. One is how fire behavior changes as the climate shifts. The other is where people will have put buildings by then.
The study combines both, using several 3, which simulate future conditions such as heat and precipitation, together with 4, meaning how development spreads across the landscape. The report doesn't describe the mechanics, such as which models were used or how fire is translated into building damage.
A made-up example shows why the pairing matters. Suppose a county's burned area doubles while its housing near flammable land also doubles. If fires burn through that housing at the same rate as before, losses roughly quadruple. A climate-only study would capture only the first doubling and suggest losses merely double.
Max Moritz, a cooperative extension wildfire specialist at the University of California, Santa Barbara's Bren School, who wasn't involved, considers this pairing necessary. "We don't have a lot of good scenarios to get a handle on how big the problem is," he said. "I think it's a real contribution."
The numbers
Burned-area projections on the current trajectory:
West, 2023–2060: total burned area could exceed 1 billion 5 (the article gives over 2.6 billion acres). The region holds many 6 ecosystems, meaning vegetation that evolved to burn.
Central grasslands, same period: as many as 111 million hectares (almost 275 million acres), in landscapes that evolved alongside fire for thousands of years.
East: a five-fold increase in burned area by 2060. The authors read this as "a growing misalignment" between where people consider it safe to build and the "evolving geography of risk." The article doesn't give the starting point, and a five-fold rise from a small base can still leave a modest total.
The Western figure is striking enough to need a sanity check, which is ours and not the article's. Spread over 38 years, 1 billion hectares is about 26 million hectares a year. The recent US average is roughly 3 million hectares a year (about 7 million acres), and the Western states cover around 300 million hectares. That total would mean burning an area equal to the whole West about three times over. Land can burn repeatedly, so it isn't impossible, but it is far above recent experience. The report doesn't say whether this is an upper-end result, so readers should check the paper before citing it.
The 300,000 figure also needs care. The report doesn't say whether it is annual, cumulative or for some other period, and it gives no baseline for "almost triple." It also describes the timing as both "by 2060" and "by midcentury."
Who is exposed
"Where we have built is driving a lot of the risk," Iglesias said. When the team modeled continued growth in fire-prone areas, it found, somewhat to its surprise, high risk in socioeconomically vulnerable Western communities.
Wildfire is often associated with wealth, she noted, because money has flowed into parts of the West where development has grown alongside fire-prone vegetation. But as fast-moving fires push into urban areas, poorer communities are also in the path. They "may not have the resources for mitigation," she said. "Insurance may be more precarious and recovery if a fire hits might be much more difficult, if not impossible."
What the models miss
Moritz's main criticism points toward underestimation. Many recent US urban conflagrations, including Boulder in December 2021 and Los Angeles in the winter of 2025, were driven by unusually powerful winds. "These kinds of models—they don't do wind," he said. "Some of the places that are pointed out in papers like this could be even worse than we think."
As general background, the winds behind such fires are often shaped by local terrain and last for hours or days, while global climate models work at much coarser scales. So projections like these may capture the long-term drying that primes fuel better than the wind event that carries fire into a suburb.
The scenario probably won't hold
The authors consider "7" unlikely to persist, because policy is already moving. In some parts of California and Colorado, new homes must meet fire codes scaled to the local severity of risk, and some other Western states have some protections.
Those measures have clear limits. No regional or federal standard exists for building in the 8, the zone where housing abuts flammable grassland and forest. The rules also do nothing for homes built before they took effect, and that older stock is a gap new codes can't close on their own.
The study therefore works as a measure of the cost of inaction, not a prediction. The report gives no alternative scenario showing how much codes, retrofits, forest management or restricting development would cut losses, so it doesn't tell us which lever buys the most. "If we decide to just keep doing things the same way, we'll have a relationship with fire like we've been having until now," Iglesias said. In this study's projections, that relationship puts far more buildings at risk.
Remember
The 300,000-building figure assumes no policy change, a scenario the authors themselves consider unlikely to persist.
Models that omit wind may understate risk in places vulnerable to wind-driven urban fires like Los Angeles and Boulder.
New fire codes in California and Colorado leave out older homes, and no regional or federal standard exists.
The 1, which runs the grid across 13 states and Washington, D.C., last Thursday refiled its plan to buy extra power capacity for the data center boom. It wants the process to start on March 1, about seven months later than first planned.
What went wrong the first time
The plan, called a 2 (RBP), aims to fill a 6.8-GW shortfall left by PJM's 2028/29 3, the market that pays generators in advance to be available at peak demand. Data center development drove the gap.
The hard part is deciding who pays and who carries the risk if those data centers never appear. In late September the 4 (FERC), the wholesale market regulator, rejected most of the plan. It said the rules on cost allocation, transmission owner exits and 5 for 6 (LSEs), the companies responsible for supplying customers, may have been unjust and unreasonable.
What changed
PJM says the revisions address FERC's objections while keeping the plan's basic structure. Maria Scheller of the consulting firm ICF International points to three changes:
newer data on large-load growth, to tie costs more closely to the customers causing them
a revised method for calculating collateral, the financial security LSEs must post
an obligation and collateral that can follow a large customer when it changes LSEs
The last change matters to 7, the utilities that supply customers who don't buy from power marketers. A data center might start on default service, leaving the utility temporarily carrying significant collateral. If it later switches to a marketer, the obligation can now move with it.
Scheller says this sharply cuts utility risk, but much now depends on the states. Regulators may need new rules on customer-specific costs, security, and what happens if a large load shrinks, defaults or disappears. Without them, she says, households could still face indirect exposure through financing costs, customer defaults and 8, meaning costs no customer ends up paying for.
The target is moving
Jefferies analysts said in an Oct. 28 note that PJM utilities have cut near-term large-load forecasts by 6.5 GW. If that lowers PJM's 2027 load forecast, the purchase could fall to roughly 630 MW, about 91% below the original target. It could shrink further if developers sign direct contracts with power suppliers.
A small purchase wouldn't necessarily mean the problem has gone away. 9, hired by PJM for an independent demand forecast, found PJM could face a shortfall of roughly 11.5 GW by 2030.
Under the proposed schedule, bids close on March 28, PJM sets the final target on April 28 and results are posted on May 10. The article doesn't say when FERC will rule, or what the capacity might cost.
The 1, which runs the grid across 13 states and Washington, D.C., last Thursday filed a revised plan with federal regulators to buy extra power capacity for the data center boom. The plan, called a 2 (RBP), would begin on March 1 if PJM's timetable holds. That is about seven months later than first intended.
PJM is refiling because the 3 (FERC), the wholesale market regulator, rejected most of the original proposal in late September. The new version arrives as the amount of capacity PJM needs to buy has become much less certain.
The problem the backstop is meant to solve
PJM's main tool for securing future supply is the 4, a market that pays generators in advance to be available when demand peaks. The auction for the 2028/29 delivery year left a 6.8-GW shortfall, which the article attributes to data center development. The backstop is a separate purchase meant to fill that gap.
Buying the capacity is only part of the difficulty. Someone must pay for it, and someone must carry the financial risk if the expected data centers shrink, default or never appear. If those costs spread across all customers, households could end up paying for capacity built for someone else's project.
FERC found problems with three parts of the original plan, saying they may have been unjust and unreasonable:
how costs were allocated
the exit rules for transmission owners
the 5, or financial security, required of 6 (LSEs), the companies responsible for supplying customers
What PJM changed
PJM says the revisions are "carefully tailored" to FERC's objections and leave the plan's fundamental structure and policy objectives intact. Maria Scheller, a vice president at the consulting firm ICF International, described three main changes in an email to Utility Dive:
Newer load data. PJM would use more current information on large-load growth to improve 7, the principle that those who create a cost should pay it.
New collateral method. PJM revised how the required collateral is calculated. The article gives no formula or dollar amounts.
Portable obligations. When a large customer changes LSEs, its backstop obligation and associated collateral can move with it.
The third change matters most to providers of last resort and 8, the utilities that supply customers who don't buy from power marketers. Scheller says the proposal sharply reduces their risk.
Consider a hypothetical sequence. A new data center connects and initially takes default service from its local utility. The utility may temporarily carry significant collateral and liquidity requirements tied to that load. The data center later signs with a power marketer, and under the new rules the obligation and collateral can follow it. The utility is no longer holding security for a customer it has lost.
Why state regulators now matter
The federal filing doesn't settle everything. Scheller frames the key credit question as whether state rules give utilities timely, certain cost recovery and adequate customer security. If they do, the utility stays an "administrative intermediary" and avoids meaningful balance-sheet or stranded-cost risk, meaning the risk of being left with costs that no customer is paying for.
Some state regulators may need to write new rules to get there. Scheller lists the tasks:
allocating costs to specific customers
setting security and cost-recovery rules
tracking when customers change suppliers
deciding what happens if a large load shrinks, defaults or disappears
Existing customers remain exposed, she says, though less directly. Administrative costs, financing costs, regulatory lag, customer default and 9 can still reach them if state mechanisms don't keep the obligation tightly attached to the large load that caused it.
The target may shrink, or may not
The size of the purchase could change substantially before bidding results arrive. Equity analysts at Jefferies said in an Oct. 28 note that PJM utilities, including PPL Electric, FirstEnergy and AES Ohio, have lowered their overall near-term large-load forecasts by 6.5 GW. The analysts cited recent filings to PJM's Load Analysis Subcommittee.
That cut could lower PJM's 2027 load forecast, which feeds into the backstop target. Jefferies says the purchase could then be as small as roughly 630 MW, about 91% below 6.8 GW. Simple subtraction would give about 300 MW, so the forecast cut evidently doesn't translate one-for-one, but the article doesn't show the calculation.
The purchase could also shrink if data center developers sign 10, direct deals with power suppliers, instead of relying on the backstop.
Pointing the other way, 11 (CRA), a consultancy PJM hired for an independent data center demand forecast, found PJM could face a shortfall of roughly 11.5 GW by 2030. The subcommittee discussed that analysis on Monday.
The 630-MW and 11.5-GW figures don't directly contradict each other. The first is a possible size for one purchase tied to the 2028/29 shortfall, and the second is a shortfall estimate for a later year. Together, they suggest that a small backstop would not necessarily mean the supply problem had gone away.
The timetable and what remains unknown
PJM's proposed schedule is:
March 1: process begins
March 28: bid window closes
April 28: final procurement target and supply amounts determined
May 10: results posted
Bids would therefore close a month before the final target is set, so sellers would be committing without knowing the final size of the purchase.
The article leaves several things open. It doesn't say when FERC will rule on the revised filing, how the backstop's contracts would be structured, what they might cost or which resources could bid. Most of the assessment of risk also comes from a single consultant, and the 630-MW figure comes from one analyst note. PJM's recalculated target will be the firmer number.
Remember
Demand forecasting uncertainty now drives this purchase's size: utilities' revisions alone could remove most of a 6.8-GW target.
A federal market fix can still depend on state rules that keep costs attached to the customer causing them.
Bidders would submit offers a month before PJM sets the final target, so they won't know the purchase's final size.
The IEA's paywall, where users are charged thousands of euros for data largely funded by taxpayers.1 / 2
Hannah Ritchie, a researcher at 1, a free online publisher of global statistics, is renewing her call for the 2 (IEA) to open its data. She now suggests who could pay for it: a philanthropist, at about €30 million for five years or €60 million for ten.
Paying twice
The IEA, an intergovernmental body that compiles global energy statistics, was set up in the 1970s and now has 32 member countries. Its core budget was about €28 million in 2018, the latest figure Ritchie could find. Governments provide most of it, and data and publication sales provided more than a fifth, around €6 million. She thinks €6–10 million a year is still about right, though that is her estimate.
So taxpayers fund most of the work, and users then pay again. Licences cost thousands of euros, and holders can't share the data or any analysis that relies on it.
What free sources miss
Free alternatives cover part of the ground. 3, an energy think tank, publishes good open electricity data. For total energy, the main free source is the 4's statistical review, formerly published by BP. It gives 5, the energy in raw sources before conversion, but coverage of lower-income countries is thin. It has nothing on 6, the energy that actually reaches users.
That gap matters because a coal plant, for example, loses most of its fuel's energy as waste heat. Primary totals alone therefore give a poor picture of how much energy a cleaner, electrified system must replace.
The costs, as Ritchie sees them
Researchers in lower-income countries are shut out by price and by gaps in free data.
Researchers waste time working out what they can legally share. She has heard that authors for the 7, the UN's climate science body, face this too.
Studies built on IEA data can't publish the underlying numbers, so others can't fully replicate them.
Public debate during energy price shocks runs without the best data.
Why it's stuck
Ritchie says the obstacle isn't IEA staff. In 2022 the executive director proposed making all data free, with the governing board's backing, but ministers from member countries couldn't agree. They asked for a review of options instead. Some data has since been freed, but not many of the most important datasets.
The buyout, and its limits
Ritchie doubts governments will close the gap. She argues a donor would need to commit for 5 to 10 years, because one or two years would leave members fearing they'd inherit the bill.
Her totals use the low end of her range. At €10 million a year, they would be €50–100 million. She doesn't say what happens when the money runs out, and no donor is named. It's also unclear whether members would accept the arrangement.
Hannah Ritchie, a researcher at 1, a free online publisher of global statistics, has renewed her long-running complaint about the 2 (IEA), the intergovernmental body that compiles global energy statistics. Its most important datasets sit behind paid licences. This time she adds a concrete suggestion: a wealthy donor could cover the IEA's lost sales for 5 to 10 years, at about €30–60 million by her arithmetic.
She frames this as the unfinished business of Hans Rosling, the late Swedish statistician who campaigned for international organisations to share their data. He called the habit of keeping it locked up "3". Ritchie is careful to say she admires the IEA's work. Her point is that the paywall only matters because the data is so good.
How the IEA pays for itself
The IEA was set up in the 1970s by countries of the 4, the Organisation for Economic Co-operation and Development, a grouping of mostly wealthy economies. It now has 32 members. Its core budget was about €28 million in 2018, the most recent public figure Ritchie could find.
Member governments supply most of that. The agency has said data and publication sales made up "more than one-fifth" of its budget, or roughly €6 million at the time. Going on that and on private conversations, Ritchie thinks €6–10 million a year is still in the right range. That is an informed estimate, not a published number.
The result is that taxpayers fund most of the work, and anyone who wants the full data then pays again. A user licence costs thousands of euros, and it bars the holder from sharing either the data or any analysis that relies on it.
Ritchie concedes the agency is in a bind, because any shortfall has to be made up somewhere. She places the blame on the member countries. In her view, by declining to raise their contributions slightly to cover the last fifth, they sharply limit what they get from the other four-fifths.
What the free alternatives miss
Researchers do have free sources, and Our World in Data uses them. For electricity it relies on 5, an energy think tank that publishes its data openly, and Ritchie has no complaint there.
Total energy is the problem. The main free source is the 6's statistical review, which was formerly published by BP, so researchers long depended on an oil company for free global energy data. It provides 7, the energy contained in raw sources before conversion. But its geographic coverage is thin, especially for lower-income countries, and it has no 8 data at all. Final energy is what actually reaches users as electricity, heat or fuel.
That gap has real consequences for understanding the transition. As an illustration using general figures rather than the article's: a coal plant might burn 100 units of primary energy and deliver only about 35–40 as electricity, with the rest lost as heat. An electric car or heat pump then uses that electricity more efficiently than a combustion engine or boiler uses fuel. Primary energy totals alone can't show this, so they give an incomplete picture of how much fossil energy a clean system has to replace. Ritchie says such metrics are "completely missing" from what she can publish freely.
The four costs Ritchie identifies
Exclusion. Lower-income countries are often absent from free datasets, and their researchers, institutions and students may be unable to afford a licence.
Wasted research time. Researchers spend long stretches working out what they can legally share and hunting for workarounds. She says she has heard that authors for the (IPCC), the UN's climate science assessment body, lose time deciding which energy data they can use and in what format. This is second-hand, and the article gives no measure of it.
Why it hasn't been fixed
Ritchie says IEA staff themselves don't want this arrangement, and that the obstacle lies with governments. In 2022 the executive director proposed making all the data free, with the governing board's support. When ministers from member countries met, they couldn't agree. They asked instead for a review of options to free more data while offsetting the budget impact. Some data and publications have since become free, but not many of the biggest and most important ones, she says.
The buyout idea
Ritchie has little faith that governments will close the gap, so she looks to philanthropy. One or two years of funding wouldn't be enough, she argues, because members would object that it isn't sustainable and fear inheriting the bill. Five or ten years might work. At €6 million a year, that comes to €30 million or €60 million, which she calls modest next to total philanthropic spending. She adds that tech company listings, naming Anthropic's filing to go public, could create new wealthy donors.
What remains open
The proposal is a pitch, not a plan, and several questions go unanswered. The cost uses the bottom of her own range. At €10 million a year, the same arithmetic gives €50 million or €100 million. The budget figures date from 2018, and the true revenue isn't public.
A buyout also postpones the funding question rather than settling it. Ritchie doesn't say what would stop the paywall returning when the grant ends, though presumably the hope is that free data becomes hard to take back. Nor does the article name a willing donor, say whether the IEA or its members would accept such money, or explain why ministers failed to agree in 2022. It also doesn't say who buys licences today, which matters because the people paying may well be able to keep paying.
Remember
The sums are small: the sales revenue at stake is about one-fifth of a budget of roughly €28 million.
Licence terms may hurt as much as price, because they restrict sharing data and derived analysis, which blocks replication.
Support inside the IEA wasn't enough in 2022; the proposal to free all data stalled among member-country ministers.
8 (UK Met Office and University of East Anglia): 72%, using data only through August; plausible September values imply 50-80%
9 (a Japan Meteorological Agency reanalysis): 48%
NOAA: 34%
10 (the European Copernicus/ECMWF reanalysis): 18%
9
No replication. Work built on IEA data can't publish its underlying numbers, so others can't fully check it.
Weaker public debate. During price spikes and supply shocks, the best data stays with the few who can pay. Ritchie sets this against the IEA's stated aim of being "at the heart of global dialogue on energy", which she suggests means a dialogue among those who can afford a licence.