Bonds Bleed, Hollywood Shrinks, Dealerships Win · Morning Gist
Tuesday, October 65 stories · 11 min
Bonds Bleed, Hollywood Shrinks, Dealerships Win
AI's mark on creative jobs, the bond index's worst stretch in 50 years, two NY Fed looks at repo plumbing, and where big fortunes actually come from.
Picked from 53 new articles across 16 sources · arrow keys for other days
Today in 30 seconds
30s left
US creative industries lost 200,000 jobs in four years without a recession; Politano blames AI squeezing digital media as live entertainment grows. story 1 ↓
The Agg logged its first negative rolling five-year return ever, but a 5.5% starting yield points to better returns ahead. story 2 ↓
NY Fed maps the $13 trillion repo market: money funds use tri-party, dealers clear centrally, hedge funds trade bilaterally. story 3 ↓
Owners of local firms like law practices and car dealerships hold over 13 times the Forbes 400's wealth, tax data show. story 4 ↓
The Fed's repo operations, which set a ceiling and floor on short rates, began in 1917 as a wartime stamp-tax workaround. story 5 ↓
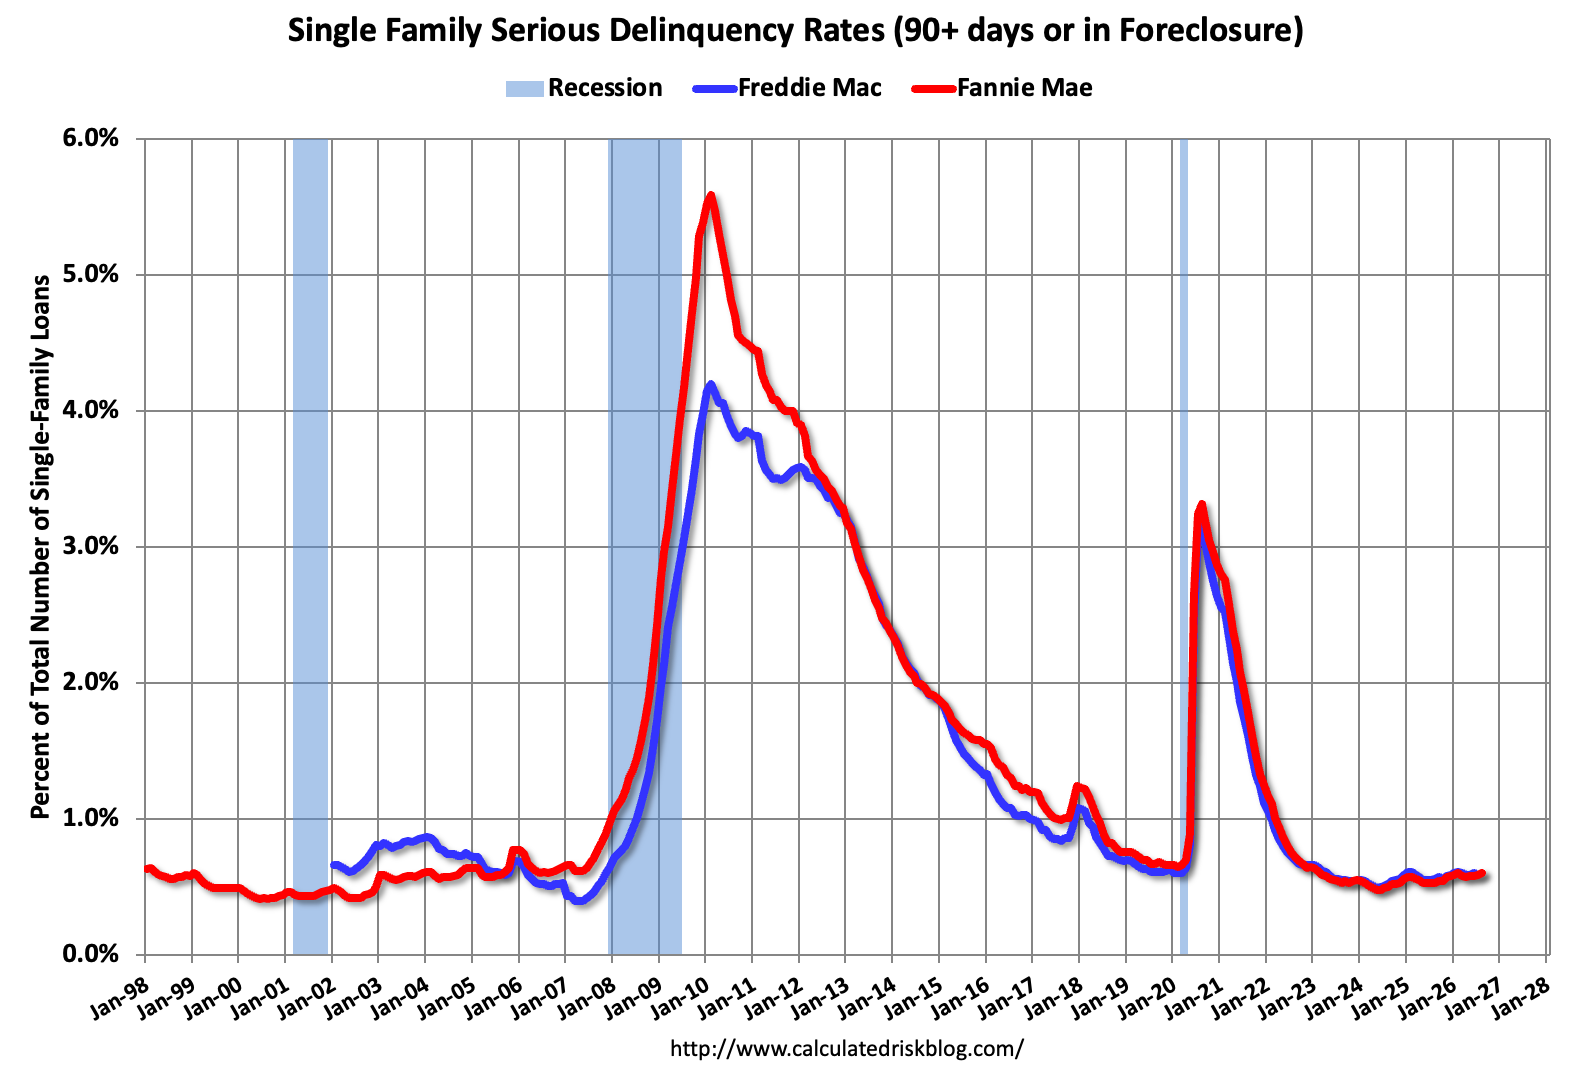
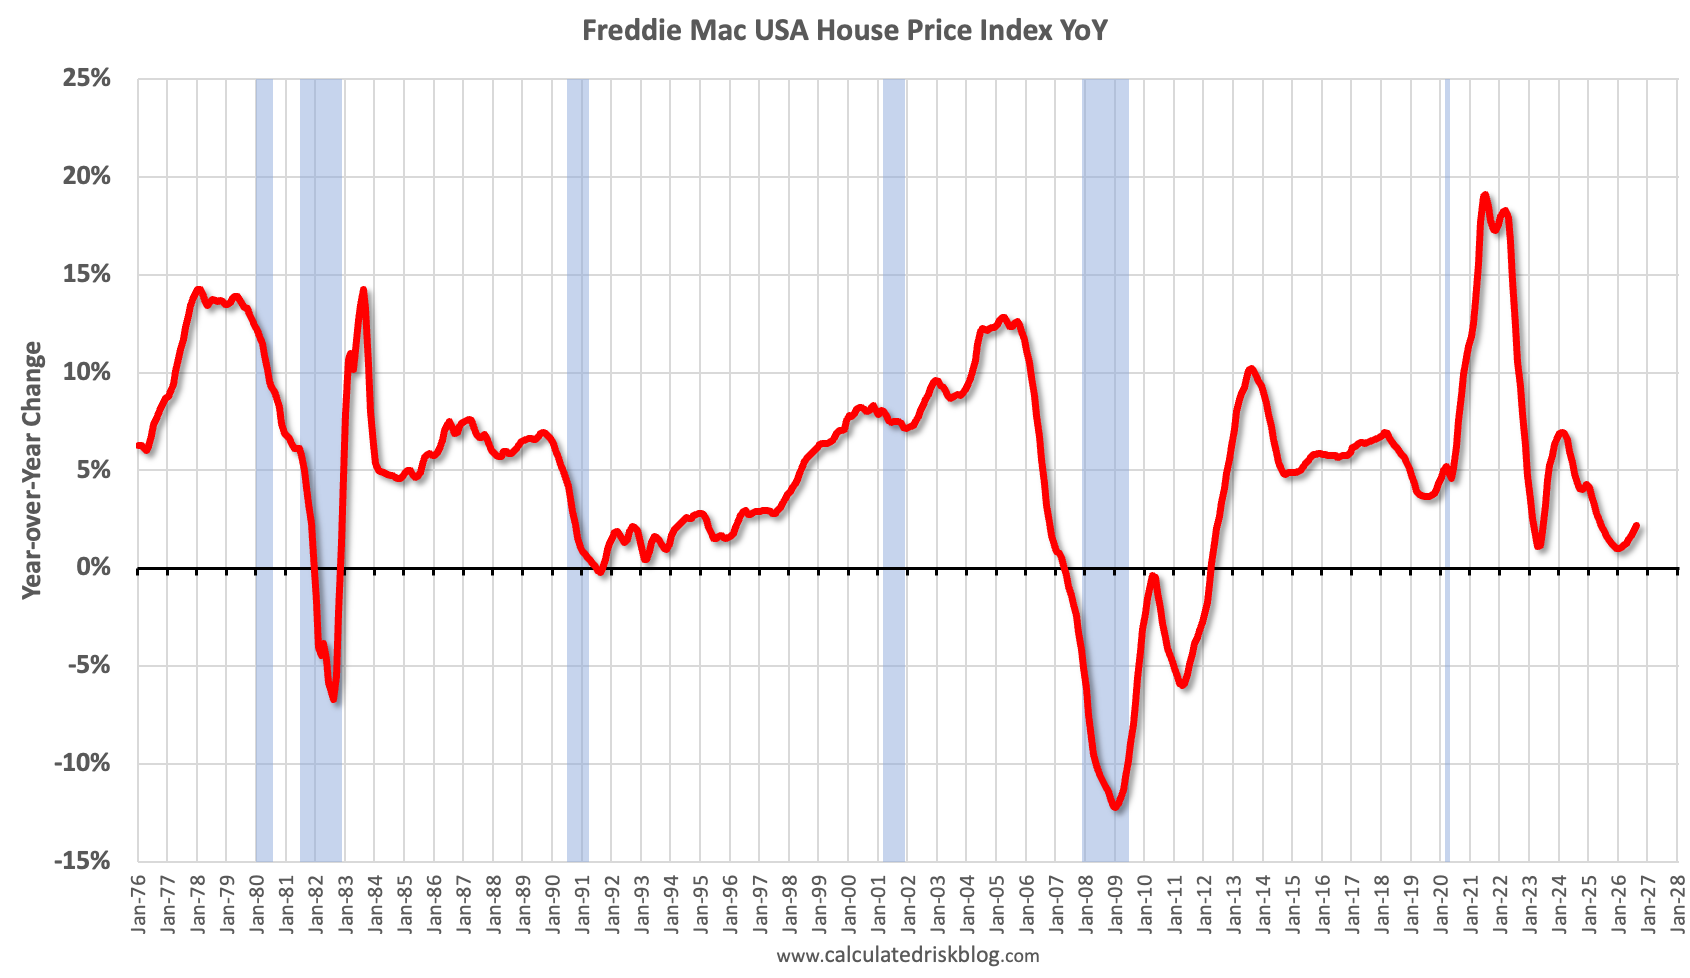
Freddie Mac's multifamily delinquency rate hit its highest since the financial crisis; single-family delinquencies ticked up slightly in August.
1/5Apricitas Economics· Joseph Politano· Sep 27
US Creative Industries Shed 200,000 Jobs in Four Years Without a Recession
Hollywood lost almost a third of its workforce. Joseph Politano argues that AI is squeezing digital media's business model, while in-person entertainment keeps growing.
Why it matters · This is one of the clearest early labor-market signals of AI displacement, and tech shows the same pattern. Politano asks whether it stays narrow or spreads into the much larger "creative-adjacent" white-collar economy.
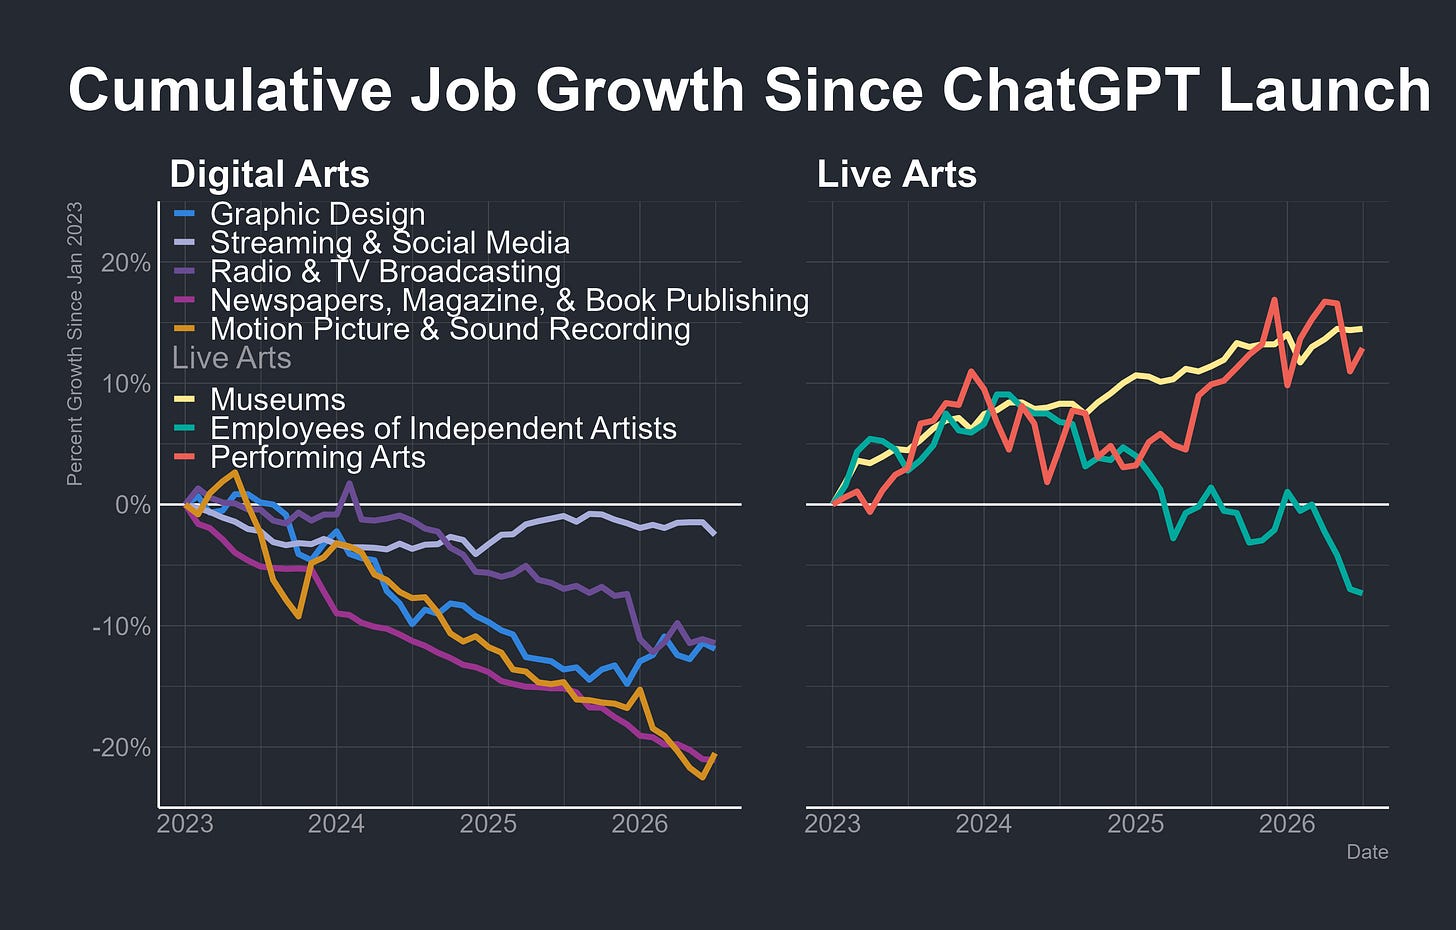
US creative-industry employment: a 200k+ job decline over four years, comparable to the 2001 and 2008 recessions1 / 4
US "creative" industries have lost more than 200,000 jobs over four years, about 50,000 of them in the past year. Media employment has only fallen this hard for this long during the 2001 and 2008 recessions, and there is no recession now. Joseph Politano says it is hard to prove AI is the cause. Studios are quiet about their AI use, partly to protect their copyright claims, and other pressures overlap: Hollywood consolidation, offshoring and social-media creators. His strongest evidence is the split between sectors. Every digital arts subsector is losing jobs, while in-person entertainment is still growing.
2/5A Wealth of Common Sense· Ben Carlson· Sep 29
The Bond Index Just Had Its Worst Stretch Since 1976
The Agg posted its first negative rolling 5-year returns ever, but a 5.5% starting yield now points to much better forward returns.
Why it matters · Most bond index funds and 60/40 portfolios track the Agg. Knowing why it collapsed, and why high starting yields matter more than rate forecasts, helps you decide how much to hold in bonds now.
Rolling 5-year Agg returns, which turned negative for the first time in the index's history1 / 4
The Bloomberg Aggregate Bond Index ("the Agg") is the standard benchmark for US investment-grade taxable bonds. It holds more than 10,000 Treasuries, corporates, mortgage-backed and asset-backed securities, and most total bond market index funds track it. Lehman Brothers created it in the early 1980s and backfilled data to 1976. Ben Carlson argues that by its own history, this is the worst bond market of the modern era.
How bad it has been
Through August, the Agg has posted negative rolling 5-year returns for the first time ever. Rolling 10-year returns are still positive, but they came close to a lost decade during the 2022 bear market. Adjusted for inflation, the picture is worse. Real 5-year returns have been lower only in the early 1980s, when inflation ran in double digits. Real 10-year returns are at their lowest on record.
Carlson notes that the late 1970s, often cited as the bad old days for bonds, were actually gentler in nominal terms. The Agg had no down year from 1976 to 1981. Its worst year in that stretch was 1978, when it rose 1.4%, because high yields cushioned the damage from inflation. The index's first down year came in 1994 (about -3%). The recent run broke several records: -1.5% in 2021 and -13% in 2022 were its first back-to-back losses and its first double-digit decline. The bear market that began when rates bottomed in 2020 produced a drawdown of nearly , which is almost unheard of for intermediate-term investment-grade bonds.
3/5Liberty Street Economics (NY Fed)· Gara Afonso, Jun-Davinci Choi, Gonzalo Cisternas, and Will Riordan· Sep 29
How cash moves through the $13 trillion repo market
NY Fed economists explain why money funds use tri-party repo, dealers clear centrally, and hedge funds trade bilaterally, and how central clearing is spreading.
Why it matters · Repo is the plumbing that funds Treasury markets and hedge-fund leverage, and it is where your money market fund invests. How it clears decides how much dealers can lend and where stress builds up.
Diagram of a dealer borrowing from a money fund and lending to a hedge fund, keeping a 10bp spread.
A repo is a sale of a security, usually Treasuries, for cash, with a promise to buy it back, usually the next business day. U.S. repo markets are estimated at more than $13 trillion. Daily volume across fed funds, Eurodollars and selected deposit markets runs around $200 billion. In the second post of a NY Fed series, Afonso, Choi, Cisternas and Riordan explain why the market has split into separate segments.
The key difference from other money markets is collateral. Money market funds (MMFs) see collateral as a way to lower risk, and hedge funds use repo to get hold of specific securities. Because participants have such different motives, they handle clearing (checking trade details) and settlement (valuation, margining, custody) differently. Each choice reflects a trade-off among operational, legal and counterparty costs.
Dealers in the middle
Dealers borrow cash from creditworthy lenders such as government MMFs and lend it to riskier borrowers such as levered hedge funds. They keep the rate spread, 10 basis points in the authors' example, as payment for taking on counterparty, collateral and some maturity risk. In late 2024, dealers borrowed $3.7 trillion and lent $3.4 trillion per day. Trades between dealers mostly clear through the Fixed Income Clearing Corporation (FICC), which becomes the counterparty to every trade. Central clearing lets dealers net their positions, which reduces balance-sheet costs and lets them intermediate more. It also gives them anonymity and lowers counterparty risk. In return, dealers pay into a default fund and post more margin. From June 2027, the SEC will require central clearing for Treasury repos in which at least one party is a direct member of a clearing agency.
4/5Of Dollars and Data· Nick Maggiulli· Sep 29
America's Real Rich Own Law Firms and Car Dealerships, Not Tech Giants
Economists Zidar and Zwick used tax data to find that local business owners hold over 13 times the wealth of the Forbes 400. Most built or bought their firms rather than inheriting them.
Why it matters · Most personal-finance advice stops at index investing, which can take a household to $1M–$10M. This research uses tax records to show what usually gets people past $10M: owning a business, decades of time and the right first job.
Asset mix by wealth level (2022 data): private business equity makes up most of the wealth above $10M.
Surveys say a lot about ordinary households and very little about the rich. Rich families are rare and hard to survey, and much of their wealth sits in private businesses that don't trade. Nick Maggiulli reviews The Everywhere Millionaire, a new book by economists Owen Zidar and Eric Zwick. They got around the data problem with their earlier research on how much tax business owners pay. Their sample covers households worth more than $5M, the top 4%, and the average household in it is worth $25M.
Where the money is
Zidar and Zwick call these people "Main Street Millionaires." Together they hold more than 13 times the wealth of the Forbes 400. Most of it sits in pass-through entities such as LLCs and S-corps, which pass their profits through to the owners' personal tax returns. The top five industries are:
legal services (mostly law-firm partnerships)
financial investment (venture capital, private equity and hedge fund managers)
independent auto dealers
consulting and professional services
oil and gas extraction
Customers in every state need these businesses, and no single giant company dominates any of these industries. Thousands of independent firms make their owners rich, and they are spread across the country.
Who they are and how they got there
Owners worth $10M or more have a median age of 62, and 90% are married. About 80% have a college degree and 40% have a postgraduate degree. That is roughly twice the rate of the general population but lower than for decamillionaires who don't own businesses.
5/5Liberty Street Economics (NY Fed)· Gara Afonso, Jun-Davinci Choi, Gonzalo Cisternas, and Will Riordan· Sep 30
How the Fed Uses Repos to Set a Ceiling and Floor on Rates
A NY Fed history traces Fed repos from a 1917 workaround for a wartime stamp tax to today's daily rate-control tools.
Why it matters · The Fed controls short-term rates partly through two daily operations: one lends cash and one takes in cash. Those rates feed into money market fund yields, bank funding costs and how ready the Fed is to step in when markets get stressed.
Balance-sheet diagram: a Fed repo adds $1 of assets and $1 of reserves until maturity unwinds it.1 / 2
This is the last post in a three-part NY Fed series on repo markets. It covers why the central bank trades repos, how the trades work, and how the tools developed over 109 years.
The mechanics
The naming is confusing at first. Fed repos are named from the side of the private counterparty. So when the Fed takes in cash and hands out securities, the operation is called a reverse repo.
Repos add liquidity. The Fed buys securities from banks or dealers and pays with newly created reserves. Its balance sheet and total bank reserves both grow, but only while the trade is open. At maturity the trade unwinds and the liquidity is drained again.
Reverse repos drain liquidity. The Fed sells securities and receives reserves, which it records as a "repo payable." The balance sheet stays the same size. Only the mix of liabilities changes.
Ceiling and floor
The Fed runs both operations every business day. The FOMC sets the rate on each.
The standing repo operation (SRP), overnight since 2021, acts as a ceiling. Primary dealers and eligible banks can borrow from the Fed at the SRP rate, so they have little reason to pay more in the market. It runs twice a day against Treasuries, agency debt and agency MBS, and settles the same day on the tri-party platform.
Movies and sound recording account for nearly half of the decline. Movie and TV employment fell by more than 100,000 jobs, close to a third of the sector. This summer it hit its lowest level since 2008 and came near a 30-year low. Written publishing lost more than 70,000 jobs. Newspapers have been shrinking for decades, but live broadcasting, streaming and graphic design were stable until recently. The losses have held near 50,000 a year and have sped up in recent months.
The business-model mechanism
Politano compares this with music after Napster. Piracy undercut copyright and pushed the value of a single song so low that Spotify and Apple Music could bundle almost all recorded music for about what one CD cost in 2000. Streaming revenue still trails 1990s physical sales even before inflation. Recorded music turned into advertising for concerts and merch, which kept musicians' income from collapsing, though they still earn less than before.
Video has no live fallback like that. Even before inflation, movie ticket sales finished last year 25% below their 2019 peak. Cable revenue is 18% below its peak, and streaming hasn't filled the gap. Studios now compete with free user-generated content and a growing flood of AI-generated content. The worst case is newspapers: their payrolls are down nearly 85% from about half a million, as search, specialist sites and social media unbundled what they used to sell. Magazines have cut 66% of their staff since the 1990s and book publishers 40%.
Viewers dislike content that is openly AI-made, but AI use is often invisible. About 32% of arts and entertainment workers use generative AI, against 62% across all industries.
Politano offers caveats. Book sales have risen about 70% in six years, driven by "BookTok", which shows how technology can have spillovers nobody predicted. Media is also a small part of the economy, so he expects AI art to matter more for culture than for GDP. The broader warning is tech: it added nearly 300,000 jobs in 2022 and has lost jobs every year since, now its longest downturn. Unemployment is still below its 2010s average. But if AI pays off enough to justify the trillions invested in it, he argues, the disruption will spread.
Remember
Creative industries lost 200k+ US jobs in four years; movie and TV alone lost 100k+, nearly a third of the sector.
Music survived digital disruption by shifting income to live shows; Hollywood and publishing have nothing similar to fall back on.
The economy-wide hit is small so far, but tech's job losses since 2022 point to wider creative-adjacent risk.
He blames three things happening at once: starting yields were very low, rates rose quickly, and inflation was high.
Why the outlook is better
The losses have pushed yields up. The Agg's average yield to maturity is now 5.5%. Historically, the starting yield has been a good guide to the next five years of returns. That relationship weakened this decade because rates rose so far and so fast from such a low base that returns fell short even of the starting yield.
Carlson lists the yields on offer now:
Cash: about 4%
US government bonds: more than 5%
The Agg: approaching 6%
Corporates: more than 6%
Yields are at levels not seen in almost 20 years. Rates could keep rising if growth stays strong, AI spending keeps growing or the war in Iran drags on. They could fall if inflation eases, the economy slows, the AI trade unwinds or energy prices drop. Carlson says no one, including the Fed, can reliably predict which way rates will move or by how much. He advises choosing bonds by yield, credit quality, duration and maturity rather than by macro forecasts. If rates rise further, prices will fall again in the short term, but higher yields now offset more of that loss, and expected returns rise as rates rise.
Remember
The Agg has posted negative rolling 5-year returns for the first time since 1976; real 10-year returns are the worst on record.
Low starting yields, a fast rise in rates and high inflation together caused a drawdown of nearly 20%.
The Agg's 5.5% yield to maturity points to better returns ahead. Choose bonds by yield and duration, not rate forecasts.
Lenders. Government MMFs hold over 80% of MMF assets and are limited to cash, government securities and government-backed repo. They don't care which collateral they receive, so they use tri-party repo. In tri-party, BNY Mellon handles collateral management as an agent, but it does not take on counterparty risk the way FICC does. Centrally cleared lending has grown quickly and reached almost 40% of MMF repo in 2026:Q1.
Borrowers. Hedge funds had $3 trillion in repo outstanding in 2025:Q4. They mostly trade bilaterally because strategies like the cash-futures basis trade need specific collateral and very low costs. About 75% of non-centrally cleared bilateral Treasury repos carry a zero haircut, meaning the lender takes no cushion against a drop in the collateral's value. Dealers can save balance-sheet space without a clearinghouse through "netted packages." For example, they can pair a reverse repo on a cheap off-the-run bond with a repo sourcing an on-the-run bond, using the same counterparty and term. The centrally cleared share of dealer-to-hedge-fund repo rose from 8% in early 2021 to 30% in late 2025, and it tends to rise at quarter-ends, when dealer balance sheets are tightest.
Remember
Dealers sit between MMF lenders and hedge-fund borrowers, borrowing and lending $3–4 trillion a day and earning the spread.
Central clearing is spreading ahead of the June 2027 SEC mandate: about 40% of MMF repo and 30% of hedge-fund repo.
75% of uncleared bilateral Treasury repos have zero haircuts, which helps make thin-margin levered trades like the basis trade profitable.
Few of them inherited their firms. Census data from 2007 show that 46% of these firms were owned by the original founder, 32% by a buyer, 14% by someone who received it as a gift or transfer, and 7% by an heir. Counting gifts and transfers, the authors put the overall inheritance rate at about 25%.
Family wealth still helps. Children of top-1% income families are 2.4 times as likely to found a firm as children from the 90th percentile and 4.1 times as likely as those from the median. Even so, 70% of founders come from outside the top 10%, and a third come from the bottom half, because those groups are so much larger.
Your first job turns out to matter a lot. Starting in an industry that produces many entrepreneurs, such as accounting, computer systems design or building contracting, raises your odds of founding a firm and of succeeding. The authors estimate that differences in early-career experience explain 20% to 50% of the gaps in business creation by income, race and gender.
The odds are poor. Only about 5% of founders build a firm worth more than $5M within ten years, and about half of firms stop operating independently within five. Even so, more than half of founders do as well financially as similar people who never started a business. Maggiulli concludes that income, saving and steady investing can get a household to $1M–$10M, but getting past $10M usually requires owning a business, whether you found it or buy it.
Remember
Owners of local businesses that are taxed as pass-throughs hold more than 13 times the wealth of the Forbes 400.
Only about 25% of these businesses were inherited; 46% are still run by the founder and 32% were bought.
Only about 5% of founders build a firm worth $5M+ within ten years, but most founders do as well as non-founders.
The overnight reverse repo facility (ON RRP), standing since December 2015, acts as a floor. Money market funds, banks and GSEs can park cash with the Fed at the ON RRP rate, so they won't lend below it.
Since the 2008 financial crisis, repo use has spiked in three episodes:
September 2019, after balance sheet shrinkage and money-market strain.
March 2020, during the COVID "dash for cash."
Late 2025, after about two and a half years of quantitative tightening.
Reverse repos were rarely used before 2021. The Fed normally structured its holdings to add reserves, not drain them. Pandemic-era liquidity changed that: ON RRP balances peaked near $2.5 trillion in early 2023, then fell steadily as the balance sheet shrank.
A stamp-tax workaround
The Fed first authorized repos in November 1917. The goal was to avoid a War Revenue Act stamp tax on short-term advances to banks. By 1918, repos exceeded $1 billion, about 30% of Fed assets.
Over time the tool changed:
Purpose: it moved from bank lending to keeping money markets funded, and counterparties shifted to primary dealers only in the late 1940s and 1950s.
Rate: it was first tied to the discount rate, then to T-bill rates in the 1950s, and is now set by the FOMC.
Settlement and collateral: ahead of Y2K in 1999, the Fed accepted agency debt and MBS. It set up its first tri-party arrangements with Chase and Bank of New York and ran its first tri-party repo that October. By 2000, all Fed repos settled tri-party.
Remember
The FOMC sets the SRP rate as a ceiling on overnight rates and the ON RRP rate as a floor.
Repos grow the Fed's balance sheet and reserves while open; reverse repos change only the mix of liabilities.
ON RRP balances peaked near $2.5 trillion in 2023; repo demand returned in late 2025 after QT.