Tariffs reach shelves slowly, housing stalls under 7.2% mortgage rates, and two data reviews challenge familiar stories about wealth and rural America.
Picked from 15 new articles across 16 sources · arrow keys for other days
Today in 30 seconds
30s left
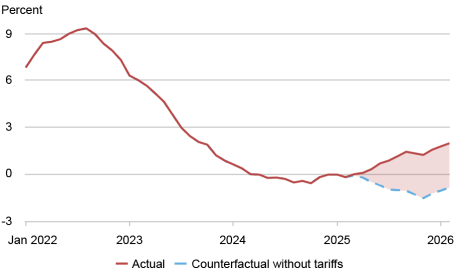
NY Fed: about a quarter of a tariff reaches consumer prices within a year; goods-inflation boost peaked at 2.9 points in February. story 1 ↓
Home price growth stalls at 1.4% as 7.2% rates push ARMs to 11% of locks; delinquencies rose to 3.53% in August. story 2 ↓
Ben Carlson: the top 0.1% got richer, but so did households below; private businesses and stocks drive most American wealth. story 3 ↓
Off-farm work supplies 82% of farm household income, and the rural poverty gap has narrowed from 17 points to 3.5. story 4 ↓
HumbleDollar's tongue-in-cheek list of portfolio killers: fees, churning, bad tax placement, performance chasing, panic selling. No new data, but useful self-audit. story 5 ↓
1/5Liberty Street Economics (NY Fed)· Mary Amiti, Sebastian Heise, and David E. Weinstein· Oct 6
NY Fed: About a Quarter of a Tariff Reaches Consumer Goods Prices Within a Year
Import prices react within months. Pass-through via U.S.-made goods takes up to a year. The tariff boost to goods inflation peaked at 2.9 points in February 2026.
Why it matters · The study puts numbers on how tariffs reach shelf prices and how long that takes. It also separates a one-time rise in price levels from ongoing inflation, which matters for reading CPI reports and for what the Fed does next.
Twelve-month goods inflation with and without tariffs. The tariff contribution reached 2.9 points by February 2026.1 / 2
New research from economists at the New York Fed and Columbia estimates that for every 1-point rise in average tariffs, consumer goods prices rise about 0.25% after a year. About two-thirds of that comes from imported goods. The other third comes from goods made in the U.S.
Three channels, two speeds
Direct effect. Foreign exporters have cut their prices very little, so about 90% of the 2025 tariffs showed up in U.S. import prices. Import prices rise almost one for one in the month after a tariff takes effect. That estimate holds after adjusting for the weaker dollar, which also pushed import prices up.
Indirect effect. U.S. producers raise their factory-gate prices in two ways:
The marginal cost channel: imported inputs like steel cost more. This is the larger of the two.
The strategic complementarity channel: when competing imports get pricier, domestic firms have room to raise their markups.
Domestic producer prices barely move in the first six months after a tariff, then roughly double over the next six.
2/5Calculated Risk· CalculatedRisk by Bill McBride· Oct 6
Home price growth stalls at 1.4% as 7.2% mortgage rates revive ARMs
ICE data: seasonally adjusted prices have been flat for three months, ARMs hit 11% of rate locks, and delinquencies rose to 3.53% in August.
Why it matters · Rising rates are reaching housing through prices, loan choices and delinquencies. ICE's loan-level data shows how much each of these has moved, which helps when timing a purchase or judging how much an adjustable-rate loan could cost.
ICE repeat-sales index, year-over-year change: annual home price growth has slowed to 1.4%.1 / 3
Bill McBride's post relays ICE's October Mortgage Monitor. Most of the material is ICE's own data and commentary. The main point: mortgage rates are back up, with ICE's conforming 30-year fixed index at 7.2% on Sept. 24, and the effects are now showing up in prices.
Prices: flat in the most recent months
ICE's repeat-sales index rose 1.41% year over year in mid-September, down from 1.44% in August. It is the first slowdown in seven months. The yearly figure hides how flat recent months have been. Seasonally adjusted prices rose 0.01% in September and 0.02% in each of July and August, an annualized pace of 0.10% to 0.30%. From February through May, when spring rates were lower, monthly gains ran 0.20% to 0.27%, or 2.45% to 3.33% annualized. If the current pace holds, the yearly figure will keep falling.
3/5A Wealth of Common Sense· Ben Carlson· Oct 6
America's top 0.1% got richer, and so did the households below them
Ben Carlson uses new book data, generational wealth charts and income studies to argue that American wealth is spreading, not just piling up at the top.
Why it matters · The usual inequality story looks only at the top. Carlson's data shows where most American wealth actually comes from (private businesses and stock ownership) and why younger savers who start early may end up ahead of earlier generations.
Profile of the roughly 3 million "Main Street Millionaires" who own private businesses1 / 4
The top of the wealth ladder is pulling ahead. About 137,000 US households, the top 0.1%, hold 15% of household wealth, with an average net worth of roughly $200 million. The Wall Street Journal reports this group has gained nearly $15 trillion so far this decade. Ben Carlson's argument is that the gains don't stop there.
Millionaires next door, mostly business owners
Carlson leans on The Everywhere Millionaire by economists Owen Zidar and Eric Zwick. They define "rich" as net worth of at least $5 million, counting liquid and illiquid assets minus debt. By that measure, the top 4% of households were rich as of 2022. That comes to nearly 5 million households, including more than 2 million worth at least $10 million and about 65,000 worth at least $100 million.
How these people got rich matters most. Three-quarters of the $10 million group own a private business, and nearly all of the $100 million group do. The authors count about 3 million "Main Street Millionaires," rich owners of private businesses, with average wealth of around $25 million. These are auto dealers, dentists, doctors, accountants, contractors, lawyers and beverage distributors, not hedge fund managers or tech founders. Their wealth comes from owning equity in their own firms, plus public stocks.
4/5Conversable Economist· conversableeconomist· Oct 6
Rural America Isn't a Farm Economy, and Poverty Gaps Have Narrowed
A new review finds 82% of farm household income comes from off-farm work and the rural poverty gap fell from 17 points to 3.5.
Why it matters · Rural policy usually rests on the idea that helping farms helps the countryside. The data in this review contradicts that, which matters for judging where public development money actually pays off.
Image: Conversable Economist
Timothy Taylor's post walks through a new review, "The Economics of Rural Development in the United States" by Alexandra E. Hill, Sarah A. Low and Keith Taylor (Annual Review of Resource Economics, 2026). It sorts out what rural America actually looks like economically.
Defining "rural"
The Census classifies each of the 3,141 US counties as metropolitan, micropolitan (an urban core of 10,000–50,000 people, outside a larger city's commuting zone) or neither (no urban area of 10,000 and no commuting link to a city). Researchers usually combine the last two into "nonmetro" counties. By that definition, rural America covers 97% of US land and holds 14% of the population.
Farming is a minority industry
USDA classifies nonmetro counties by their main source of jobs and earnings:
17% farm-dependent
25% manufacturing
10% recreation
4% mining
4% government
40% no primary industry
Farm households themselves rely mostly on outside work. In 2017, 82% of farm household income came from off-farm sources, and 56% of principal operators had a main job off the farm, often partly for benefits like health insurance. Small family farms make up 85% of operations but account for only 14% of farm sales.
Because of this, the authors note, many agricultural economists now reject the Goldschmidt Hypothesis, the idea that improving the farm economy is both necessary and sufficient for rural prosperity. They favor broader policies on health, quality of life and economic diversification.
5/5HumbleDollar· Mark Crothers· Oct 6
A Satirical Checklist of the Habits That Quietly Wreck Portfolios
HumbleDollar's Mark Crothers lists common wealth-destroying mistakes as tongue-in-cheek advice: fees, churning, bad tax placement, chasing performance and panic selling.
Why it matters · The piece has no new data. It's a compact checklist of the standard evidence-backed mistakes, useful for checking your own portfolio, tax setup and safety net against.
Image: HumbleDollar
Mark Crothers, writing on HumbleDollar's forum, offers a satirical guide for readers who want to shrink their wealth. Each piece of "advice" is a familiar mistake turned upside down. The article has no new data or figures. Its value is as a checklist, and in most cases Crothers briefly names why the mistake does damage.
The costs you don't see
Fees and turnover. Crothers's "set-it-and-forget-it" route to ruin is a high-fee advisor who recommends high-fee funds. Next comes a manager who trades constantly or churns the account. Both drain returns year after year without the investor doing anything.
Tax placement. Hold bonds in a taxable account, where the interest is taxed every year at your top rate. Put your fastest-growing stocks in a Roth IRA, "where, sadly, the tax savings would be considerable." Turned right side up, the lesson is about asset location: which account holds which asset changes your after-tax return. The same goes for retirement. Withdraw from accounts in random order, ignore your tax bracket and let required minimum distributions catch you off guard, and Crothers says "a modest tax bill" can become "a spectacular one."
The behavioral traps
Chasing performance. Buy last year's top fund or this week's headline. By the time you get in, the fund tends to regress to the mean.
Panic selling. Sell after a big drop, then wait until you feel confident again, which usually happens only after prices have recovered. You lock in the losses and miss the rebound.
No emergency fund. Without cash on hand, a car repair or a job loss forces you to sell investments, possibly in the middle of a bear market. Crothers calls it "a rare opportunity to be your own worst timing mechanism."
Retail step. Transport, wholesaling and retailing make up about half of what consumers pay, and those costs don't rise with the tariff. A 10% tariff-driven rise in import and producer prices therefore lifts retail prices about 5.6%. The authors' example: a $100 item with a $50 factory price and a $50 distribution margin goes to $105 if the factory price rises 10%.
Put together, a 10% tariff on all imports would raise consumer goods prices by 2.6% after 12 months. Half of the direct effect shows up within three months and all of it by six. The indirect part more than doubles between months six and twelve.
What the 2025–26 tariffs did
The authors compare 67 non-oil consumer goods categories with more and less tariff exposure. Services, about two-thirds of the consumer basket, are excluded. They hold economy-wide factors fixed, including wages, exchange rates, demand and monetary policy. By that method, tariffs added 2.9 percentage points to 12-month goods inflation by February 2026. Without them, goods prices would have fallen slightly, as they typically did before COVID.
The tariff effect on the goods price level peaked near 3% in February 2026, and about 30% of it came through the indirect channels. A Supreme Court ruling then ended the emergency-powers tariffs and replaced them with a 10% surcharge. The authors project the effect easing to about 2% by August 2026. The direct effect falls fastest, while the indirect effect lingers because producer prices adjust slowly.
From there, the August 2026 tariffs on Canadian goods and a Canadian auto tariff announced for January 2027 push the level up again. The tariffs' contribution to 12-month goods inflation is forecast to reach about zero by August 2026 and turn negative as the 2025 increases drop out of the comparison. It turns slightly positive by mid-2027.
The authors' conclusion is that the tariffs' effect on inflation fades, but prices stay at a higher level.
Remember
About 90% of tariffs pass into import prices, but only about a quarter reaches consumer goods prices after a year.
A third of the price effect comes from U.S.-made goods, mainly through costlier imported inputs. It takes 6–12 months to show up.
Tariffs added 2.9 points to goods inflation at the February 2026 peak. That effect is fading, but prices stay higher.
The regional split is wide. The Midwest and Northeast hold the top 23 markets, led by Scranton (+7.5%), Rochester (+7.2%) and Syracuse (+6.6%). The 50 weakest markets are all in the South and West. Austin is 23.2% below its record high, Cape Coral 16.5%, Phoenix 7.8% and Denver 7.3%. Seattle is down 3.1% from a year ago. More than 40% of major markets have posted adjusted monthly declines in each of the last three months. Single-family homes are up 1.7% while condos are down 0.9%.
ARMs are back, but exposure is small
ARMs made up more than 11% of rate locks, the highest share in almost four years. There are 3.1 million active first-lien ARMs, the most in 5.5 years, but they are only 5.6% of mortgages. Just 1.05 million have passed their first reset, the fewest in more than 25 years. More than 90% of ARMs written since 2022 are still in their fixed introductory period.
A 25-basis-point pass-through from the recent Fed hike would raise the median adjusting borrower's payment by about $14 a month, or about $53 on newer loans with bigger balances. The real risk is first resets. Of the roughly 180,000 due in 2027, about 74,000 are 7-year ARMs from 2020. Low starting rates, large balances and higher rate caps put their median payment jump at about $1,066 a month, or 36%. HELOCs follow the prime rate and reset monthly, so a 25bp hike adds about $9 to the median payment on a $44,000 balance at 7.4%.
Delinquencies: the calendar distorts the numbers
The delinquency rate rose 14bp to 3.53% in August. That is still below every pre-pandemic August. The day of the week a month ends moves the reported figure: a Friday close pushes it down about 18bp and a Sunday close pushes it up about 24bp. August 2025 ended on a Sunday, so the reported 10bp yearly rise understates the change. ICE estimates the calendar-adjusted increase at about 30bp. Loans 90 or more days past due are up 19% from a year ago, to 574,000.
Remember
Seasonally adjusted home prices have been flat for three months, so the 1.4% annual growth figure will likely keep falling.
ARMs reached 11% of rate locks, but the real payment risk is 74,000 2020-vintage 7-year ARMs facing about 36% jumps.
After adjusting for month-end calendar effects, delinquencies are up about 30bp from a year ago, not the reported 10bp.
Bloomberg data shows stock ownership spreading over time, even though holdings stay concentrated at the top. BCG charts show millennials putting money into stocks at a much higher rate than Gen X or boomers did. Households under 45 are further along in wealth than earlier generations were at the same age, and each generation has earned more after inflation. Young people are reaching milestones like homeownership later but eventually catching up. Carlson argues that starting to compound earlier means "there will be even more rich people in the future."
Other data points the same way. The Cato Institute finds the share of people with high incomes has grown fivefold in 60 years. Poor and middle-class households have also gained, though less than the top 1% or 0.1%. Economist Jeremy Horpedahl shows that average inflation-adjusted wealth for working-age Americans is at an all-time high for both younger and older workers.
Carlson's anecdotal evidence is self-storage. The US holds 90% of the world's storage capacity and has more storage facilities than Starbucks, McDonald's, Walmart, Home Depot, Domino's, Dunkin' and Costco locations combined.
He grants that prices are higher and not everyone is thriving. He also notes a two-sided risk. All this wealth is one reason the US has avoided a recession for some time. But if a recession does come, falling asset values could make people cut their spending, a hit economists call the wealth effect.
Remember
Nearly 5 million US households hold $5M+; most of the very rich own private businesses, not hedge funds.
Millennials invest in stocks at higher rates than earlier generations; under-45s are ahead of earlier generations at the same age.
Inflation-adjusted wealth is at record highs, but a recession could hit spending through the wealth effect.
Over the past two decades, nonmetro counties have added jobs more slowly than metro ones. Causes include falling population, fewer businesses with employees, more one-person businesses, and growth in high-skill jobs alongside declines in low-skill work. Rural America is also more diverse: 24% of rural residents were people of color in 2020, up from 20.2% in 2010.
Poverty has fallen sharply, though. The average nonmetro poverty rate dropped from about 32% in 1960 to 15% in 2019. The gap with metro counties narrowed from about 17 percentage points to 3.5.
Policy options
Development efforts fall into two groups. Place-based policies use infrastructure, amenities and financial incentives to attract businesses and support local entrepreneurs. People-based policies invest in education and skills. The authors see new openings in remote work and in investment in communications, transportation, education and health care. Taylor calls these recommendations sensible but notes that similar efforts in the past have had mixed results. He argues the real challenge is building lasting connections between nonmetro areas and the rest of the US economy.
Remember
Only 17% of nonmetro counties are farm-dependent; 82% of farm household income comes from off-farm work.
Nonmetro poverty fell from about 32% in 1960 to 15% in 2019; the metro gap is now 3.5 points.
Taylor notes that place-based and people-based rural policies have had mixed results in the past.
Concentration. Put a large share of your net worth in your employer's stock or one company you're sure about. If your paycheck depends on that same company, one bad quarter hurts your income and your portfolio together.
Opaque products. Layered annuities, surrender charges, large commissions and brochures promising a "proprietary strategy." Crothers argues that if you can't explain how a product works, the seller is probably the one who benefits.
Finfluencer tips, acted on monthly and without thinking them through, round out the list. Crothers closes by saying the noodle-eating wealth destroyer is at least helping reduce wealth inequality.
Remember
Fees and heavy trading are the low-effort ways to lose money: they compound against you without any action on your part.
Asset location matters: bonds belong in tax-sheltered accounts, and retirement withdrawals need planning around your tax bracket and RMDs.
An emergency fund prevents forced selling, and owning a lot of your employer's stock ties your job and savings to the same risk.