Why taking the brain apart may not explain it, whether AI threatens encryption's math, and what the Black Death, smog and childhood reveal about risk.
Picked from 43 new articles across 10 sources · arrow keys for other days
Today in 30 seconds
30s left
Neuroscientist Bence Ölveczky argues cortex loops can't be understood by silencing parts, and proposes simulated "virtual rats" instead. story 1 ↓
OpenAI's 722 AI-written math papers skip cryptography, but a preprint finds AI code-breaking improving fast; cryptographers disagree on the risk. story 2 ↓
Pollen from 100+ European sites shows plant diversity fell 40% on plague-abandoned farms, then slightly overshot once farming resumed. story 3 ↓
A review of 41 observational studies ties PM2.5 to glaucoma and cataract risk; five other pollutants showed weak or no links. story 4 ↓
A third of mental health conditions begin by 14, per a 192-study analysis; schizophrenia typically starts in the twenties. story 5 ↓
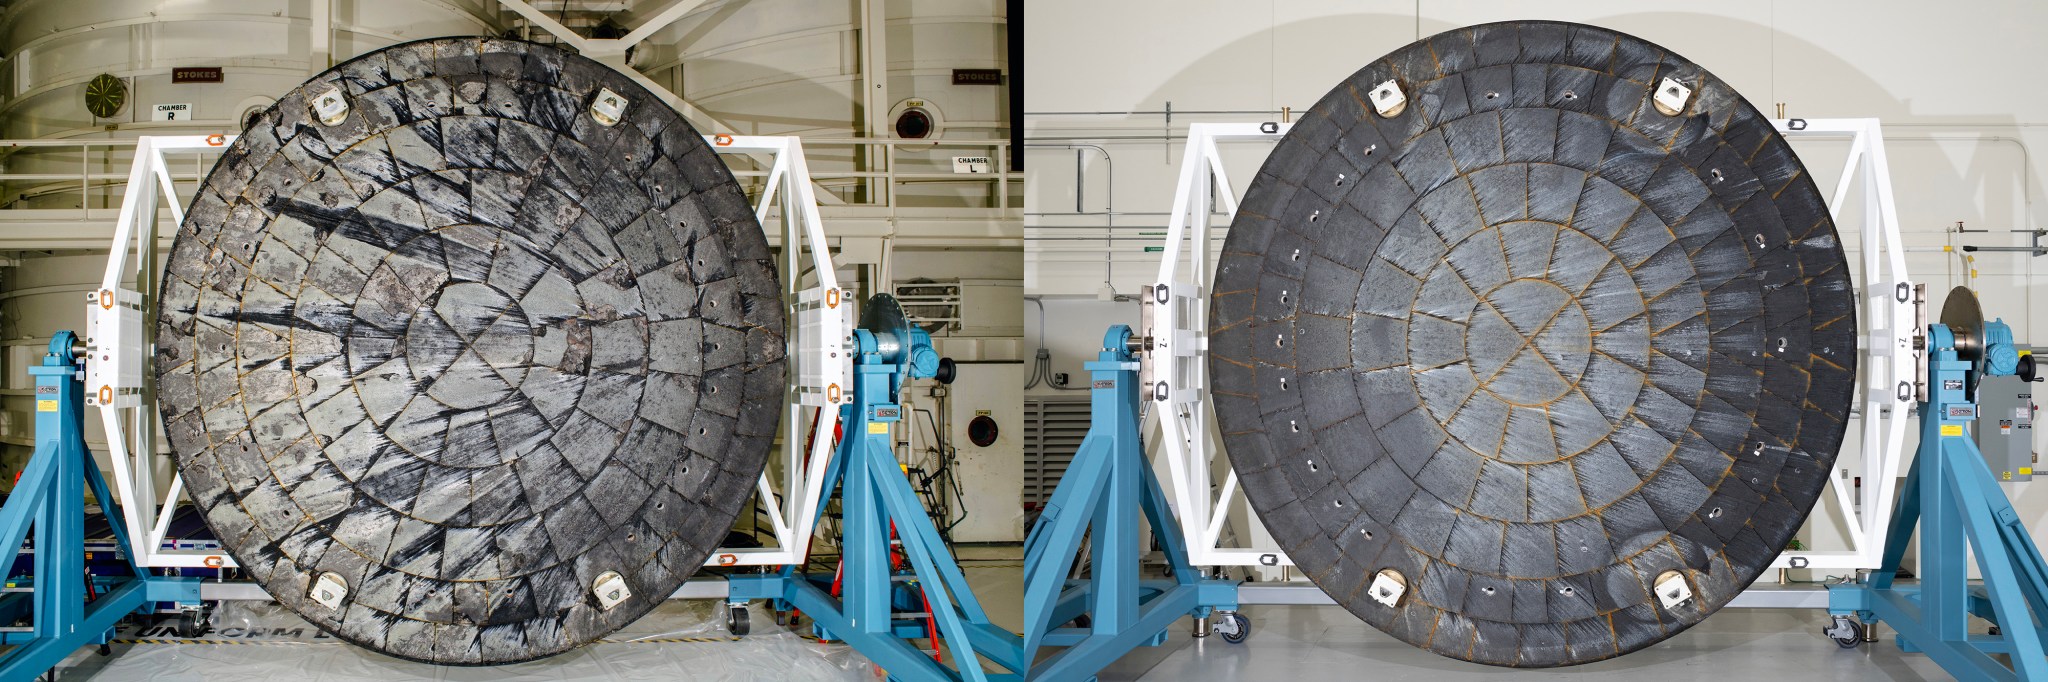
NASA's post-splashdown analysis finds Artemis II's heat shield performed as expected, unlike Artemis I's, which shed material unexpectedly.
1/5The Transmitter· Bence Ölveczky· Oct 19
Neuroscientist argues brain loops can't be understood by cutting them into parts
In an essay, neuroscientist Bence Ölveczky argues that general-purpose, looping brain circuits resist the usual method of breaking a system into parts. He proposes fully observable simulated animals, or "digital twins," instead.
Why it matters · It explains why decades of recording and silencing brain areas haven't explained how the cortex controls skilled behavior, and what the field may try next.
Know this first
Context from the editor, not the article · 30 sec
1 · Mechanistic explanation in neuroscience
The classic goal is to explain a behavior by naming which neurons and connections do which step. Researchers record activity, destroy (lesion) areas, or switch cells on and off, then piece together how the parts work as a whole.
2 · Feedforward versus recurrent circuits
In a feedforward circuit, signals flow one way, stage by stage, from input to output. In a recurrent circuit, outputs loop back as inputs, so each area's activity partly reflects echoes of activity from many other areas.
3 · Cortex and striatum
The cortex is the brain's layered outer sheet. The striatum is a deep structure involved in movement and learning. The two form loops with each other and with other regions, and both are central to learning motor skills.
2/5Scientific American· Oct 15
Could AI break encryption's math? Cryptographers split after OpenAI's 722 papers
OpenAI posted 722 math papers written by an unreleased AI model. That set off a debate among cryptographers about whether AI could find shortcuts that break the math protecting online banking and messaging. No deployed system has been broken so far.
Why it matters · Nearly all secure internet traffic depends on a few math problems staying hard. If AI can find shortcuts in them, the evidence that they are hard has to be re-examined.
Know this first
Context from the editor, not the article · 29 sec
1 · Public-key encryption
Two computers set up a secure link without sharing a secret first. Anyone can see a public key, while the private key stays hidden. Working out the private key from the public one is meant to be infeasible.
2 · Security rests on unproven hardness
No one has proved that factoring large numbers (the basis of RSA) or the elliptic-curve problems are hard. Trust in them comes from decades of experts trying to find fast methods and failing.
3 · Post-quantum cryptography
In principle, a large quantum computer could break RSA and elliptic-curve systems. Governments and companies are already switching to new schemes designed to survive quantum attacks. Many of these are based on lattices, a different kind of math problem.
3/5Live Science· Sarah Wild · Oct 18
Black Death cut plant diversity 40% where medieval farms were abandoned
Researchers compared pollen from more than 100 European sites. Where farming collapsed after the 14th-century plague, plant diversity fell about 40%. It recovered only when people came back and resumed farming the mixed landscape.
Why it matters · It runs against the common view that people only ever reduce biodiversity, and it hints that some kinds of farming could support more species than today's single-crop fields.
Know this first
Context from the editor, not the article · 31 sec
1 · Europe's 14th-century collapse
The Great Famine of 1315–1317 came first. Then the Black Death, a bubonic plague epidemic caused by the bacterium Yersinia pestis, killed more than a third of Europeans. Much farmland was abandoned, and the population didn't start recovering until the 1500s.
2 · Reading the past from pollen
Lakes, bogs and other wetlands build up sediment layer by layer, and each layer traps pollen from the plants growing nearby. Scientists drill out a core, date the layers and count the pollen types. That gives a timeline of local vegetation, crops included.
3 · What "mosaic" landscapes are
4/5Live Science· Sanket Jain · Oct 18
Fine-particle air pollution linked to higher glaucoma and cataract risk
A review of 41 studies covering millions of people in East Asia and the UK found that higher exposure to fine-particle air pollution goes with more glaucoma and cataracts. It shows a link, not proof of cause.
Why it matters · If it holds up, two leading causes of vision loss gain a risk factor that whole populations can reduce, unlike age.
Know this first
Context from the editor, not the article · 29 sec
1 · Two common eye diseases
Glaucoma damages the optic nerve and destroys peripheral vision first. A cataract is a clouding of the eye's lens. Both become more likely with age and with conditions like diabetes. Together they affect more than 170 million people.
2 · What PM2.5 is
PM2.5 means airborne particles 2.5 micrometers across or smaller, about a thirtieth the width of a hair. They come from combustion such as traffic, industry and burning crops. They are small enough to get deep into the body.
3 · Why observational data is limited
Observational studies measure exposures and outcomes in people without assigning them. They can show that two things go together. They can't rule out hidden third factors such as income or smoking, so they can't prove cause.
5/5Our World in Data· Hannah Ritchie· Oct 19
A third of mental health conditions start by age 14
Hannah Ritchie of Our World in Data charted a 2022 analysis of 192 studies. Among people who ever develop a mental health condition, about a third show it by age 14 and two-thirds by 25.
Why it matters · The age a condition usually starts tells you when screening and prevention have the best chance of working. These numbers also show that many disorders begin in childhood.
Know this first
Context from the editor, not the article · 18 sec
1 · What a meta-analysis does
A meta-analysis pools the results of many separate studies into one estimate. That gives it more statistical power than any single study, but it carries over the differences and gaps in the studies it pools.
2 · Onset versus prevalence
Age of onset is when a condition first appears in a person. Prevalence is how many people have it at a given time. The two can tell very different stories about the same disorder.
Age-of-onset curves for nine mental health conditions, grouped into early, any-age and around-20 patterns.
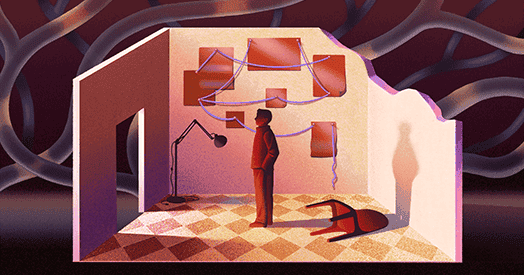
In an essay for The Transmitter, neuroscientist Bence Ölveczky argues that neuroscience's favorite method stops working in the cortex. That method is to break a circuit into parts and explain each one. The essay reports no new data. It reflects on his lab's experience and proposes a direction.
Why the old approach worked
Early in his career, Ölveczky studied the retina and zebra finch song. In both, he could trace a signal stage by stage and watch a complex computation become a chain of simple steps. He says this worked for two reasons. Each circuit evolved for one well-defined job, so its anatomy read "like an instruction manual." And each was roughly 1: signals flow one way, so how a signal changes at each stage tells you what that stage does.
Why it fails for skill learning
He then studied how rats learn motor skills, using the cortex (the brain's layered outer sheet) and the striatum (a deep movement-and-learning structure). Here, two regions that lesions showed do very different jobs carried near-identical activity. 2, which silences or activates neurons with light, showed how the whole system responds to a disturbance, not what the silenced region computes.
He blames three features:
General purpose: these circuits serve many tasks, so no way of dividing them matches any one task.
3: outputs loop back through many brain areas, and a shared circulating signal swamps each area's own contribution.
The body: the loop runs through muscles and limbs with their own physics.
"Cut a loop," he writes, "and you just get a broken loop."
Two ways forward
One option is to analyze 4, the joint activity of many neurons over time. Patterns such as 5 (stable states activity settles into) recover some modularity. But that description never mentions the actual cells, so it gives no mechanistic intuition.
His preferred option is 6: simulated rats with realistic bodies and artificial-neural-network brains, checked against real animals. Every unit can be watched and every connection altered, endlessly. His lab has built such virtual rats and says comparing them with real ones taught things measurement alone could not. The essay doesn't specify what.
The caveat
This is a position, not a demonstration. A simulated rat that behaves like a real one may use a different mechanism. Ölveczky admits he doesn't know whether digital twins will work or whether the field needs an entirely new idea of what "understanding" means.
An essay, not a new result
In an essay for The Transmitter, neuroscientist Bence Ölveczky argues that the standard way of explaining the brain stops working for the circuits that matter most for intelligence. That method is to take the system apart and explain each piece. He reports no new data here. The piece is a reflection on his lab's experience, and it ends on an open question, not a conclusion.
When taking things apart worked
Ölveczky trained on two circuits where reductionism worked well: motion processing in the retina and song production in zebra finches. In both, he could follow a signal from photoreceptors to 1 (the retina's output neurons), or from one specialized song nucleus to the next. He watched a complex computation break down into a chain of simpler steps, each explained by the neurons' properties and wiring.
He gives two reasons it worked. First, these circuits evolved for one well-defined job. Their anatomy reads "like an instruction manual, complete with a parts list and ready-to-test hypotheses." Second, their computations are roughly sequential and 2: the signal comes in, is transformed in stages, and goes out. How the signal changes at each stage tells you what that stage computes. The circuit's structure, its function and its activity all line up.
When it stopped working
He then turned to the cortex and striatum, studying how rats learn motor skills. He calls rats "basically furry songbirds," and expected the same approach to carry over. It didn't.
The problem was clearest in one finding. Lesions showed that two brain regions contributed very differently to a behavior: destroying each produced a different deficit. Yet recordings showed the two regions carrying near-identical activity. Acute manipulations didn't solve it either. 3, which uses light to silence or activate genetically targeted neurons, revealed how the whole system reacts to a disturbance. It did not reveal what the silenced region normally computes.
Why: flexibility, loops and a body
Ölveczky names three features of these circuits:
General purpose. Evolution built the cortex and striatum to be recruited for whatever the animal is doing: one circuit, many tasks. They have plenty of structure, including cortical layers, striatal cell types and spatial maps. But no way of dividing them up matches any single task, so staring at the anatomy doesn't yield a hypothesis "crisp enough to be wrong."
4. To track which task they're doing and how it's going moment to moment, these circuits loop. Each area's activity includes its own output coming back, altered, after passing through many other regions. A shared circulating signal bathes every area and can drown out each area's private contribution. That, he argues, is why his two functionally distinct regions looked the same.
His key image: cut a feedforward chain and you get two parts you can still study separately. "Cut a loop, and you just get a broken loop."
He doesn't claim these regions lack localized functions. Seen from a distance, after the system has settled, a lesion gives each region a clear behavioral signature. Up close, in real-time recordings, that modular picture "vanishes like a mirage," because each area's activity reflects the whole network.
Option one: describe the whole
One alternative is to study neural 5: how the combined activity of many neurons evolves over time. With the right math, he says, you can recover surprising modularity. Here are the descriptive objects he names, with plain glosses:
Rotations: activity cycling through a repeating pattern.
Attractors: stable states the activity settles into.
Low-dimensional manifolds: a few underlying patterns that capture thousands of neurons' activity.
A behavior can then be described as a sequence of moves through "neural state space." Ölveczky calls this trading structural reductionism for functional reductionism. The cost is that the description never mentions the cells and circuits doing the work. It is rigorous but carries no mechanistic intuition. And he says he can imagine no experiment in a real animal that would cleanly map those dynamics back onto cells, circuit motifs and brain areas.
Option two: build a virtual animal
His proposed way out is the digital twin: a simulated animal with a realistic biomechanical body, controlled by an artificial neural network acting as its brain, run in a physics simulation. It should be informed, constrained and checked against data from real animals. Its value is access. Every unit can be observed and every connection changed, and experiments can be repeated without limit. Researchers can systematically alter connectivity and unit properties to see how they shape dynamics and behavior. That is a form of 6, meaning inferring how a system works from its inputs and outputs, with no excuses about the limits of real-world methods.
His lab has built virtual rats, including one trained to imitate a real rat's movements, and trained them on tasks similar to those given to real rats. He says comparing their "brains" with real ones taught things about motor control that measurements alone couldn't. The essay doesn't say what those findings were. The planned workflow is to build intuition in the simulation, turn it into testable hypotheses, and check those in real animals.
What remains open
Several things are unsettled. A digital twin is only as informative as its resemblance to the real animal. An artificial network that produces rat-like behavior might do so by a different mechanism, and the essay doesn't say how close a match counts as validation. Understanding a simulation is also still understanding a model. It may simply move the original problem into software, where it is easier to probe but no less tangled.
Ölveczky is candid on the larger point. He doesn't know whether 7 will deliver mechanistic understanding, or whether neuroscience will need "a new, yet-to-be-discovered explanatory framework." His claim is that this regime of loops, flexibility and a body is not a side case: "it is where anything we would want to call intelligence lives."
Remember
Lesions and recordings can disagree: regions with different jobs can still show nearly identical activity in looping circuits.
Silencing a brain area shows how the whole system copes, not what that area normally computes.
Simulated animals trade biological realism for total access; their value depends on how faithfully they match real ones.
Public-key cryptography based on arithmetic on elliptic curves. It offers strong security with short keys and is used widely online and in cryptocurrencies.
Image: Scientific American
Last week OpenAI posted 722 math manuscripts, all written by an AI model the public cannot use. It withdrew three within a day, and mathematicians are still checking the rest. The volume and quality of the work have revived a worry among cryptographers. Could AI find shortcuts in the math that keeps the internet secure?
Why the worry
1 lets computers set up secure connections and verify identities without first sharing a secret. It protects bank log-ins and messages, and it signs software updates and cryptocurrency transactions. It depends on a few math problems staying hard to reverse. 2 relies on factoring huge numbers. Elliptic curve cryptography (ECC) relies on an operation on curves that no one knows how to undo efficiently. Neither problem has been proved hard. Trust comes from decades of failed attacks.
Shortcuts have appeared before. Johns Hopkins cryptographer Matthew Green notes that the 3, a fast factoring algorithm, made 512-bit RSA keys breakable. Keys were lengthened, and 2,048 bits is now the minimum. Green puts the chance at about 15 percent that we lose confidence in current public-key algorithms. He didn't give a timeframe. Govind Pimpale of the Foundation for American Innovation argues that because each problem is studied by a small community, machines could overwhelm them with effort.
The evidence
A 4, not yet peer-reviewed, led by Florian Tramèr of ETH Zurich (three co-authors work at Anthropic) tested AI models on 191 code-breaking challenges. In summer 2025 the models struggled to reproduce simple attacks. A few months later they were finding new weaknesses. Anthropic also reports that its Claude model found a much better attack on 5, a proposed signature scheme built to resist quantum computers.
The pushback
Yehuda Lindell of Bar-Ilan University and Coinbase says there is "no evidence whatsoever" of a breakthrough against the core problems. Stanford's Dan Boneh notes that none of the 722 papers is about cryptography. Pimpale concedes that no deployed algorithm has been broken by AI. KU Leuven's Bart Preneel adds that even an attack a billion times faster might still need impossible amounts of computing. Eyal Ronen of Tel Aviv University says AI's skill at finding software bugs is the more immediate threat.
Green warns that even a modest advance would force upgrades, which could themselves leave systems insecure by accident. The current move to quantum-resistant cryptography may help. But HAWK shows that schemes built for the quantum era can still fall to AI.
Boneh and Green want AI labs to say what their models have tried against these problems and how often they succeeded. For now, Green says, "We're getting no signal whatsoever."
Last week OpenAI, the company behind ChatGPT, posted 722 mathematical manuscripts online at once. An AI model that the public cannot use wrote every one of them. The batch was uneven. OpenAI withdrew three papers within a day, and mathematicians are still checking the others. Still, the volume and the sharpness of some results have made some cryptographers ask an uncomfortable question. If AI is this good at math, could it find a way around the math that protects the internet?
What's at stake
1 lets two computers set up a secure connection and confirm each other's identity without first sharing a secret key. It secures the link between your browser and your bank. It also produces the digital signatures that prove a software update or a cryptocurrency transaction is genuine. The whole arrangement depends on a few math problems being practically impossible to reverse.
Two families carry most of the load. 2 depends on how hard it is to factor very large numbers into their primes. Elliptic curve cryptography (ECC) uses arithmetic on curves and is common across the internet and in cryptocurrencies. Its security depends on the belief that no efficient algorithm can undo the operation at its core. Nobody has proved either problem is hard. The confidence comes from decades of failed attempts to crack them.
If someone did find a shortcut, attackers could pose as your bank or read your messages. Anyone who has been storing encrypted traffic could go back and decrypt it years after the senders thought it was safe.
Shortcuts have happened before
Matthew Green, a cryptographer at Johns Hopkins University, points to history. The 3, a clever algorithm for factoring large numbers, made RSA with 512-bit keys far easier to break. Cryptographers responded by using longer keys, and 2,048 bits is now the accepted minimum. Green says another advance on that scale "could potentially seriously reduce the security level of the schemes that we standardize." A few days after OpenAI's release, he wrote on social media that he puts the chance at about 15 percent that we lose confidence in today's public-key algorithms. The article does not say what timeframe he meant.
Govind Pimpale, a research fellow at the Foundation for American Innovation, explains why AI might make such an advance more likely. Public-key cryptography rests on only a few problems, and each is studied by a fairly small group of experts. Machines could put far more effort into them than those groups can. "Public-key cryptography is necessary for essentially all online commerce and secure messaging, so its loss would have dire consequences," he says.
The evidence so far
The strongest evidence comes from a 4, a study not yet peer-reviewed. Florian Tramèr of the Swiss Federal Institute of Technology Zurich (ETH Zurich) led it, and three of his co-authors work at the AI company Anthropic. The team tested leading AI models on 191 code-breaking challenges. In summer 2025, the researchers weren't sure AI could even reproduce fairly simple attacks. A few months later, the models were finding weaknesses nobody had noticed. "It's pretty clear that models' ability in 5 is growing extremely rapidly," Tramèr says. Cryptanalysis is the science of breaking codes.
Anthropic has also reported that its Claude model found a much better attack on 6. HAWK is a proposed digital-signature scheme built to resist quantum computers. That claim comes from the company, and the article gives no details of the attack.
The skeptics
Many experts reject the alarm. Yehuda Lindell, a professor at Bar-Ilan University and head of cryptography at Coinbase, wrote that there is "no evidence whatsoever" of a breakthrough against the core problems. Dan Boneh of Stanford University notes that none of OpenAI's 722 papers deals with cryptography, which he calls "a little striking." Even Pimpale concedes: "Today no currently deployed algorithm has been broken by AI." Weakening an experimental scheme is a long way from breaking the systems everyone uses. The real fear is a shortcut that cracks a whole family of problems at once, and every system built on it.
Bart Preneel of KU Leuven (the Catholic University of Leuven) in Belgium says the size of any breakthrough matters. A modest advance might weaken protection without breaking it. Even an attack a billion times faster might still need more computing power than anyone can gather. As an illustration not taken from the article: a billion is about 2 to the 30th power. A system that needs about 2 to the 128th operations to break would drop to about 2 to the 98th, which is still far beyond reach. "I think there is, at least at this moment, no real reason to panic," Preneel says.
Eyal Ronen of Tel Aviv University, a co-author of the cryptanalysis preprint, sees a more immediate threat. AI is already very good at finding bugs in software. Attackers usually take the easier route, such as breaking into a computer to steal its keys, rather than attacking the math.
The upgrade problem
Green sees a second risk. Even a modest advance would force everyone to upgrade their cryptography, and "the upgrade process itself is going to be a bit of a catastrophe," he says. "We screw up the upgrade, and we end up with something insecure accidentally."
Some of that work is already happening. Governments and companies are moving to 7, schemes meant to survive a future quantum computer. Boneh says this shift could help if AI turns up something unexpected, though the two threats aren't the same. HAWK was built for the quantum era, and AI still weakened it.
What's still unknown
The biggest gap is information. Boneh and Green want AI labs to say whether they have pointed their models at the problems behind cryptography, what they tried and how often it worked. "We're getting no signal whatsoever," Green says. Until a lab shares that, no one can tell whether AI has exposed something basic about these problems, or whether it is simply getting better at problems that were always solvable.
Remember
No AI has broken any deployed encryption. The real evidence so far is AI weakening experimental schemes such as HAWK.
A faster attack is not automatically a fatal one. A billion-fold speedup can still leave breaking a system out of practical reach.
Cryptographers want AI labs to report what their models tried against cryptography's core problems and whether it worked.
Ecologists use "mosaic" for a patchwork of different habitats close together, such as fields, woodland, heath and ponds. More kinds of habitat give more kinds of species somewhere to live than one uniform cover does.
Modern single-crop farming. The study contrasts this with the mixed medieval landscapes that supported more plant types.
What the study found
After the Black Death killed more than a third of Europe's people in the 14th century, wild plant diversity fell too. The drop happened specifically where farming collapsed. The study, led by 1 Jonathan Gordon of the University of York and published March 4 in Ecology Letters, found that plant diversity fell by about 40% in those places. It returned only when people did.
Why the plague is a useful test
It is rare to see what happens when people abandon land at scale and for a long time. In the 14th century, the Great Famine of 1315–1317 was followed by the Black Death, an epidemic of bubonic plague caused by the bacterium 2. Huge areas of farmland were abandoned, and populations didn't start recovering until the 1500s.
How they measured it
The team used 3, the layers of pollen preserved in sediments that show which plants grew nearby at each point in time. They compared more than 100 records containing about 4,600 samples, from sites ranging from the French lowlands and the uplands of south-west England to the Swiss Alps.
Pollen from cereals such as wheat, barley and rye shows how much grain was grown. Using it, the researchers sorted sites into three groups: farming rose, farming fell, or there was no farming at all. Diversity declined overall, but almost all of the decline came from the sites where farming fell. About 150 years later, as populations recovered and people worked the land again, diversity rose to slightly above its pre-plague level. The article doesn't say which diversity measure they used.
Why abandonment cut diversity
Gordon says medieval land was a 4, a patchwork of different habitats side by side. Several kinds of farming were mixed with old woodland, heaths, ponds and secondary forest. More types of habitat gave more types of plants a home. Erle Ellis of the University of Maryland, Baltimore County, who wasn't involved, says the result undercuts the idea that people only ever cause "net loss of species."
Modern farming relies on 5, one crop covering a large area, and that lowers diversity. Experts quoted in the article suggest that mosaic-style land use could help restore biodiversity on farmland. That is their interpretation, not something the study tested.
Caveats
Pollen is a rough proxy: grains often can't be identified to species, and some plants make far more pollen than others. The plague wasn't a controlled experiment, so the link is correlational, although it's a strong one. Gordon also notes that the study counts kinds of plants, not 6, meaning the range of jobs they do in an ecosystem. He says functional diversity is key to how well ecosystems cope with climate change.
The finding
The Black Death killed more than a third of Europe's people in the mid-14th century, and wild plant diversity fell along with them. That is the conclusion of a study published March 4 in the journal Ecology Letters, led by Jonathan Gordon, a 1 (someone who reconstructs past ecosystems) at the Leverhulme Centre for Anthropocene Biodiversity at the University of York. Where farming collapsed after the plague, plant diversity dropped by about 40%. It came back only when people did.
Why the plague makes a useful test
Scientists can rarely watch what happens to a landscape when people leave it for good, across a wide area and for a long time. The 14th century produced that situation by accident. Persistent cold, wet weather first brought the Great Famine of 1315–1317. Then came the Black Death, an epidemic of bubonic plague caused by the bacterium 2. With so many people dead and society in upheaval, large areas of farmland were abandoned, and populations didn't begin to recover until the 16th century. Gordon calls the period "the perfect opportunity" to study how people affect biodiversity over long timescales.
How the evidence was built
The team used 3. These are sequences of pollen grains preserved in layered sediments, where each layer captures the plants growing nearby when it was laid down. They compared more than 100 European records containing about 4,600 samples in total. The sites ranged from the lowlands of France and the uplands of south-west England to the Swiss Alps.
Cereal pollen was the key signal. Wheat, barley and rye were staples of medieval farming, so the amount of cereal pollen in a layer shows how much grain was grown nearby. The researchers sorted their records into three groups:
sites where cereal pollen, and so farming, increased over the period
sites where it decreased
sites with no evidence of cereal growing
They then tracked how plant diversity changed in each group. The article does not say which diversity measure they used or how they handled dating uncertainty.
The results
Overall, biodiversity declined. Gordon says the decline came almost entirely from one group: "In those landscapes where agricultural production went down, there was a reduction in biodiversity of around 40%." About 150 years later, populations recovered and people began disturbing the land again by clearing, ploughing and grazing. Diversity then rose to slightly above its pre-plague level.
The sorting is what makes the result convincing. If the drop had shown up everywhere, the cause could have been something Europe-wide, such as the cooling climate of that era. Because it is concentrated where farming retreated, it points to the loss of human land use itself.
Why fewer people meant fewer plants
The explanation lies in the type of farming. Gordon says medieval landscapes had "all these different types of agriculture operating within the same landscape." Fields sat alongside leftovers from the early 4, the warm period since the last Ice Age about 12,000 years ago: "old bits of woodland... heaths... ponds, and bits of secondary forest." That patchwork, which ecologists call a 5, gave many different plants a place to live.
An analogy (ours, not the article's): think of a town with a market, a park, a river and old streets, compared with one huge car park. The varied town supports many kinds of activity. Once fields went unworked, the patchwork probably lost its open, disturbed habitats as land grew over into more uniform vegetation. The article only implies this step and doesn't describe it directly.
Erle Ellis, an agroecologist at the University of Maryland, Baltimore County, who was not involved in the study, says it challenges the popular idea of a "stable and pristine world in which the entry of people has only one result: net loss of species." He says "the paleoecologists have always known the story is far more complicated," and points to growing evidence that people's long-term shaping of landscapes often creates mosaics that support more species than uniform land does.
What it means today
Modern agriculture works the other way. It relies on 6, where one crop covers a large area, and that reduces biodiversity. The article cites research estimating that global biodiversity fell by up to 11% during the 20th century, mainly because of land-use change, pollution and climate change. Patrick Roberts of the Max Planck Institute of Geoanthropology, also not involved, says the study shows that "until relatively recently, even in Europe, very different forms of land management" were practised, with the emphasis on "maintaining 'mosaics'" rather than plantations. The experts quoted suggest this could guide efforts to bring biodiversity back to farmland. That is their reading of the result, not something the study tested.
Caveats and open questions
Pollen is an imperfect proxy. Pollen types are often identifiable only to the level of a genus or family, and some plants make far more pollen than others. A count of pollen types is therefore a rough stand-in for true species richness. This is a general limit of the method; the article doesn't discuss how the study dealt with it.
Remember
Sorting sites by cereal pollen tied the diversity drop to abandoned farming, not to a Europe-wide cause like climate.
Medieval farming mixed fields with woods, heaths and ponds. That variety supported more plant types than abandonment did.
Pollen-based counts can't show what the plants did in the ecosystem, and functional diversity is still unstudied.
Burning crop residue, a major source of the fine particles (PM2.5) most strongly tied to glaucoma and cataracts.
People who breathe more fine-particle air pollution appear more likely to develop glaucoma and cataracts. That is the finding of a review of 41 studies presented in September at the 44th Congress of the European Society of Cataract and Refractive Surgeons (1) in London. Together, the studies covered millions of people in East Asia and the UK. The work was presented at a conference, and the article doesn't say whether it has been through peer review, so treat it as preliminary.
What was compared
The team looked at six pollutants: 2 (particles 2.5 micrometers or smaller), the larger PM10, nitrogen dioxide, sulfur dioxide, ozone and carbon monoxide. Most of the studies estimated each person's long-term exposure from pollution levels near their home, using government monitors, satellite data and computer models. The researchers then checked those exposures against rates of glaucoma, cataracts and 3, which damages the retina's sharp central vision.
The numbers
PM2.5 had the clearest links:
People with the highest exposure had 70% higher 4 of glaucoma than those with the lowest.
A more typical step up in exposure, from the 25th to the 75th percentile within a study, went with 8% higher odds of glaucoma and a 4% higher 5 of cataracts.
The 70% figure compares the extremes. The 8% figure is closer to what an ordinary difference in where people live would mean.
The other pollutants showed little. Sulfur dioxide and PM10 had no significant link to any of the three diseases. Neither nitrogen dioxide nor ozone was tied to glaucoma, and the evidence on AMD was inconsistent.
Nidhi Singh, an environmental epidemiologist who wasn't involved, said the glaucoma link was relatively consistent across studies and the cataract link more variable. She stressed that observational data "demonstrate an association, not by themselves a causal effect."
A possible mechanism
Ahmed Alnabihi, the study co-author who presented the findings, suggests that absorbed particles cause 6, where harmful reactive molecules overwhelm the body's defenses, along with chronic low-grade inflammation. In the lens, these could make the transparent 7 proteins misfold and cloud. In the optic nerve, they could harm 8, the neurons that carry signals to the brain, even without the raised eye pressure that usually drives glaucoma. He notes that the eye's surface also touches outdoor air directly.
Other work points the same way. Mice exposed to PM2.5 for nine months developed higher eye pressure. A 9 study of more than 480,000 people linked PM2.5 to glaucoma over time. Lab-grown human retinal tissue exposed to the particles showed disrupted development and more cell death. How these pieces fit together in people is still unknown.
A review of 41 studies has found that people exposed to more fine-particle air pollution are more likely to have glaucoma and cataracts. The studies together covered millions of people in East Asia and the UK. The findings were presented in September at the 44th Congress of the European Society of Cataract and Refractive Surgeons (1) in London. The article describes a conference presentation and doesn't say whether a peer-reviewed paper exists, so the numbers below should be treated as preliminary.
The problem
Glaucoma is a group of diseases that damage the optic nerve, the cable that carries visual information from the eye to the brain. It affects about 80 million people worldwide. The vision loss is permanent, usually starting at the edges and moving inward. Cataracts affect more than 94 million people: the eye's lens turns cloudy, vision blurs, and untreated cataracts eventually cause blindness. The known risk factors are mostly things people can't change, chiefly age, plus conditions such as diabetes. If something in the environment adds to the risk, it would be one of the few factors a whole population could reduce.
The difficulty is in proving it. Nobody can randomly assign people to breathe dirty air for decades. Researchers have to rely on observational data: they estimate the pollution people lived with and see who developed disease. That can show the two go together. It can't rule out other explanations, such as differences in income, smoking or healthcare access between polluted and cleaner areas.
What the review did
The researchers gathered studies that measured six pollutants:
2, particles 2.5 micrometers across or smaller
PM10, coarser particles up to 10 micrometers
nitrogen dioxide
sulfur dioxide
ozone
carbon monoxide
Most studies estimated long-term exposure from pollution levels around each person's home and community. They drew on government monitoring stations, satellite measurements and computer models that fill gaps between monitors. A few looked at short-term spikes in pollution and sudden problems such as acute angle-closure glaucoma, an emergency in which fluid pressure in the eye rises fast and can quickly destroy vision.
The team then compared exposure with rates of three diseases: glaucoma, cataracts, and 3, which damages the macula, the central patch of retina responsible for sharp, detailed vision.
The results
PM2.5 stood out. Here is what each number means.
Highest vs lowest exposure: people in the most-polluted group had 70% higher 4 of glaucoma than those in the least-polluted group. This compares the two ends of the range, so it is the most dramatic way to put the result.
A typical difference: within each study, the researchers also looked at moving from the 25th to the 75th percentile of exposure, the gap between a fairly clean and a fairly polluted address in the same population. That step went with 8% higher odds of glaucoma and a 4% higher 5 of cataracts. "Odds" compares how common a disease is between groups. "Hazard" is the rate at which new cases appear over time. Both measure relative risk, not absolute risk.
To illustrate (these numbers are made up): if a group had a 5% chance of glaucoma, an 8% relative increase would raise it to roughly 5.4%. That is small for one person but meaningful across millions.
The other pollutants mostly came up empty. Sulfur dioxide and PM10 showed no significant link to any of the three diseases. Nitrogen dioxide wasn't significantly tied to AMD. Ozone wasn't tied to cataracts. Neither was linked to glaucoma. The article doesn't report results for carbon monoxide. Evidence on AMD was inconsistent overall.
This pattern is informative in its own right. If polluted places were simply worse off in general, you might expect every pollutant to track with eye disease. Instead the signal sits mainly with the finest particles.
Nidhi Singh, an environmental epidemiologist at the IUF-Leibniz Research Institute for Environmental Medicine in Germany, wasn't involved in the work. She said the PM2.5–glaucoma association was relatively consistent across studies. The cataract link was "moderately consistent" but more variable, and she said it still seems to support a connection. Her caveat was firm: the results "demonstrate an association, not by themselves a causal effect."
How particles might harm the eye
Ahmed Alnabihi, the co-author who presented the work and an ophthalmologist at King Khaled Eye Specialist Hospital and Research Center in Saudi Arabia, offers a proposed mechanism. It is a hypothesis, not something the review tested. Fine particles are small enough to be absorbed into the body. There they can trigger 6, in which reactive molecules overwhelm the body's defenses and damage cells, and chronic low-grade inflammation, in which the immune system stays slightly switched on for long periods.
In the lens, he says, these processes can damage 7, the tightly packed proteins that keep the lens clear, causing them to misfold and clump. That clumping is what a cataract is. In the optic nerve, the same stresses may harm 8, the neurons whose long fibers form the optic nerve. That would offer a route to glaucoma that doesn't depend on high pressure inside the eye, the disease's best-known risk factor. Alnabihi also notes that, unlike the lungs or gut, the eye's surface is in direct, constant contact with outdoor air.
Supporting evidence
Several separate lines of work fit this picture:
Mice: animals exposed to ambient PM2.5 for nine months developed raised eye pressure. Their fluid-drainage tissues showed oxidative stress and nitrative stress, a related form of chemical damage, which could explain the pressure rise.
9: in this health database, among more than 480,000 people, those exposed to more PM2.5 were more likely to develop glaucoma over time.
Human cells: lab-grown human retinal tissue made from stem cells was exposed to PM2.5. Retinal cell development was disrupted, including in retinal ganglion cells, and more cells died.
What remains open
The pieces are suggestive but not yet connected. The review rests on observational data from two regions, East Asia and the UK. The article doesn't describe how well individual studies adjusted for confounders such as smoking or income, or how the 41 studies varied in quality. The mechanism comes from animal and cell experiments, and it's not known whether the same thing happens in people. Alnabihi argues that glaucoma and cataracts should be seen as shaped by "where you live and breathe, not just how long you've lived," much as air pollution is now accepted as a factor in heart disease. Establishing that would take studies that follow people over time with careful adjustment, or that show eye-disease rates falling after pollution drops.
Remember
Of six pollutants studied, only fine particles (PM2.5) showed consistent links. PM10 and sulfur dioxide showed none.
The headline 70% figure compares extreme exposures. A typical difference meant about 8% higher glaucoma odds.
Proposed mechanisms are oxidative stress and inflammation, supported only by mouse and lab-grown tissue experiments so far.
About a third of people who will ever have a mental health disorder have their first one by age 14. About two-thirds do by age 25. Hannah Ritchie at Our World in Data draws these figures from a 2022 1 (a study that pools results from many earlier studies) by Marco Solmi and colleagues. It covered 192 2, which are surveys of illness across populations.
Ritchie's point is about timing. Screening and prevention work best when they reach people at the ages they are most likely to become ill.
Three patterns
The chart has one curve for each of nine conditions. Each curve covers only the people who will ever develop that condition, and shows what share of them first develop it at each age.
Any age:3 (long-lasting, hard-to-control worry), depression and bipolar disorder start across adulthood with no sharp peak.
Early: social anxiety usually begins in childhood, and almost 80% of cases start before age 18. Eating disorders peak at age 16, with a median of 18, meaning half of cases start before 18 and half after.
Around 20, then throughout adulthood: alcohol and cannabis use disorders and schizophrenia usually start in a person's twenties.
Caveats
"Onset" was measured in different ways. Some studies counted the first symptoms, others the diagnosis or the first hospital admission. The authors checked how much this matters. For depression, counting from diagnosis instead of symptoms raised the 4 from 26 to 31.
The curves show timing, not how common a condition is. Each one is scaled to its own group of patients. The depression curve sits below the schizophrenia curve even though depression is far more common. Depression's cases are spread over many years, while schizophrenia's are bunched into a few.
Onset is not the same as living with a condition. Many people have repeated episodes or long periods of illness, and the chart doesn't show that.
The evidence is unevenly spread. Most studies come from high-income countries in North America, Europe and Australia, and some conditions have few high-quality studies.
The source analysis is peer-reviewed. The article is a summary chart of it, not new research, and it doesn't try to explain why the conditions peak at different ages.
The news
Hannah Ritchie at Our World in Data has charted when nine mental health conditions typically begin. The data comes from a 2022 1 (a study that pools results from many earlier studies) by Marco Solmi and colleagues, published in 2. It covered 192 3, which are surveys of illness across populations. The overall result: among people who will ever have a mental health disorder, about a third have their first one by age 14, and about two-thirds by age 25.
Ritchie's argument for why this matters is practical. If you know the ages when people are most likely to develop a condition, you can time risk assessments, screening and preventive programmes for when they are most likely to help.
How to read the chart
Each curve in the chart is a 4, a smoothed curve showing how cases spread across ages. It covers only the people who will ever develop that particular condition, and it shows what share of them first develop it at each age. Every curve is scaled to its own group, so the curves say nothing about how common one condition is compared with another. That matters, and it comes up again below.
Three patterns
Ritchie sorts the nine conditions into three groups.
Conditions that can start at any age. Generalized anxiety disorder (long-lasting, hard-to-control worry), depression and bipolar disorder all have broad, flat curves. First cases are spread across adulthood with no sharp peak. Depression and bipolar disorder are often grouped together as 5.
Conditions that start early. These have a sharp peak in childhood or early adolescence. Social anxiety usually begins in childhood: almost 80% of people who ever have it do so before age 18. Eating disorders, which here means anorexia nervosa, bulimia nervosa and binge-eating disorder, usually begin in the teenage years. Their peak age is 16 and their median age is 18, meaning half of cases start before 18 and half after.
Conditions that peak around 20 but continue through adulthood. Alcohol and cannabis use disorders and schizophrenia most often start in a person's twenties. New cases still appear well into adulthood after that.
How solid the numbers are
Ritchie lists four limits on what the data can show.
1. "Onset" meant different things in different studies. Some of the 192 studies counted onset as the first symptoms. Others counted the date of diagnosis, or the first hospital admission. Diagnosis can come years after symptoms begin, so the definition changes the answer. Solmi's team tested this. For depression, counting from diagnosis instead of symptoms moved the 6 from 26 to 31. A shift of five years in the middle of the distribution is large compared with the gaps between some of the curves. Treat the medians as approximate.
2. The curves show timing, not how common a condition is. The depression curve sits much lower than the schizophrenia curve, even though depression is far more common in the population. The depression curve is low because its cases are spread over many years, so no single age holds a large share of them. Schizophrenia cases bunch into a narrow age range, which makes its curve tall. A tall peak means cases are concentrated, not that there are many of them.
3. Onset is not the same as living with a condition. The chart records only when someone first develops a disorder. Many people have repeated episodes or long periods of illness. So the age profile of everyone who has depression right now could look quite different from the age profile of new cases.
4. The evidence is uneven. Some conditions have fewer high-quality studies than others. Most studies come from high-income countries in North America, Europe and Australia. Whether the same age patterns hold elsewhere is an open question that the data cannot answer.
What stays open
The underlying meta-analysis is peer-reviewed and large. The piece itself is a visual summary, not new research. It doesn't explain why the conditions peak at different ages, so it can't say whether the early peaks for social anxiety and eating disorders reflect brain development, social pressures in adolescence, or how and when cases get noticed. It also doesn't test whether better screening in childhood actually leads to better outcomes. That step is needed before "intervene early" becomes evidence-based policy. And because the curves leave out prevalence, they can't show where the largest number of new cases arise. A planner would need to combine these timing curves with how common each condition is in the population.
Remember
Social anxiety starts early: almost 80% of people who ever have it do so before age 18.
How onset is defined changes the answer: depression's median age is 26 counting symptoms and 31 counting diagnosis.
A tall curve means cases are bunched into a few ages, not that the condition is more common.
Embodiment. The loop runs through the body, which is a nonlinear system with inertia and its own dynamics.
The evidence is correlational. The plague wasn't a controlled experiment. The three-group comparison makes a human cause likely but doesn't prove it.
Diversity here means counting kinds. Gordon says the study doesn't yet cover functional diversity: the range of jobs plants do in an ecosystem. "There may be a hundred types of plants in a landscape," but if they all do the same thing, 7 is low. He says this matters for how ecosystems cope with climate change and for "future-proofing our agricultural system."
The results are European. The sites run from French lowlands to the Alps. Whether the pattern holds in other regions or under other farming systems isn't covered.