Water Fingerprints, Shadowed Gas, Telling Faces · Morning Gist
Tuesday, October 205 stories · 15 min
Water Fingerprints, Shadowed Gas, Telling Faces
Satellites trace human water use from orbit, models and telescopes show how gas shapes galaxies, and two studies look at how faces carry information.
Picked from 39 new articles across 10 sources · arrow keys for other days
Today in 30 seconds
30s left
NASA combined 23 years of gravity-satellite data and found human-driven shifts in land water across 40 regions, in 5–10 times finer detail. story 1 ↓
A 3D model of the Orion Bar shows clumpy gas casting shadows, explaining why JWST and ALMA see chemical layers overlap. story 2 ↓
An AI estimated cancer survival from face photos: 64 of 122 patients it flagged as highest-risk died within 90 days. story 3 ↓
Glowing hydrogen lines up with radio jets around hundreds of galaxies, which suggests black hole jets slow the gas supply for new stars. story 4 ↓
In a 24-person brain-scan study, a sad voice alone engaged face-processing areas, and a silent sad face engaged voice areas. story 5 ↓
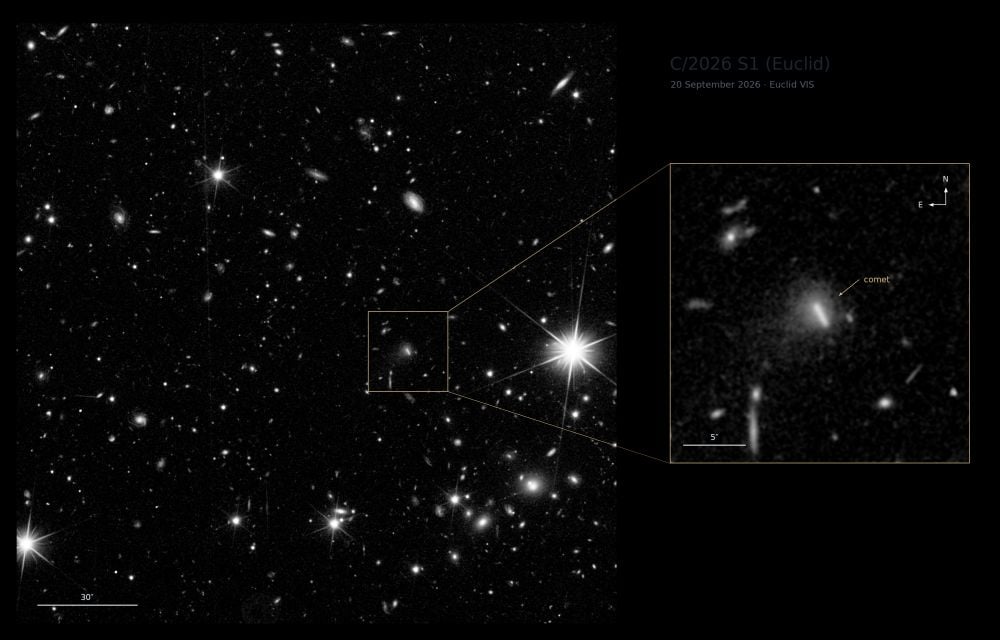
ESA's Euclid, built to map galaxies for dark-energy research, found a new comet by accident: C/2026 S1 (Euclid).
1/5NASA· Oct 20
Gravity satellites find human fingerprints on land water in 40 regions
NASA scientists re-analyzed 23 years of satellite gravity data at much finer resolution. They found 40 regions where irrigation, reservoirs and land-use change track with gains or losses in the water stored on land.
Why it matters · It shows from orbit, worldwide, where human water use is moving the stored water itself. That matters for groundwater-dependent farming regions already running down their reserves.
Know this first
Context from the editor, not the article · 27 sec
1 · Terrestrial water storage
All the water held on land added together: snow, ice, lakes, rivers, reservoirs, soil moisture and groundwater. Satellites can't see underground water directly, so tracking its total change needs an indirect method.
2 · How GRACE weighs water
The GRACE missions (2002–2017) and GRACE-FO (2018 onward) are each a pair of satellites in tandem. Extra mass below speeds the lead satellite slightly, changing the gap between them. Measuring that gap reveals mass shifts, which are mostly moving water.
3 · The resolution problem
Gravity signals blur over large areas, so standard GRACE maps only show broad regional patterns, typically several hundred kilometres across. Features like a single reservoir or canal usually disappear into the blur.
2/5Universe Today· Evan Gough· Oct 19
A 3D model explains the tangled chemical layers of the Orion Bar
Astronomers built the first fully 3D, high-resolution chemical model of a region like the Orion Bar, where starlight breaks up gas. Clumps that cast shadows reproduce the arcs, filaments and overlapping chemical layers telescopes see.
Why it matters · Astronomers read star-forming clouds through the light their chemistry gives off, so a model that gets the geometry wrong also gets the physical interpretation wrong.
Know this first
Context from the editor, not the article · 32 sec
1 · Starlight versus star-forming gas
Stars form from cold, dense molecular hydrogen in giant molecular clouds. Once massive young stars switch on, their ultraviolet light heats the surrounding gas, breaks its molecules apart and pushes it away. This 'stellar feedback' can shut down further star formation nearby.
2 · Photodissociation regions
At the edge of a cloud lit by hot stars, ultraviolet light controls the chemistry. Moving deeper, the gas shifts from ionised, to neutral atoms, to molecules, as dust and the outer gas absorb more of the light. These zones are called photodissociation regions.
3 · How models get tested
3/5Scientific American· Oct 19
AI reads a face photo to estimate a cancer patient's survival odds
Mass General Brigham researchers trained an AI on 40 million face photos. Adapted for cancer patients, it gave risk scores that tracked survival: more than half of those with the highest scores died within 90 days.
Why it matters · Doctors already judge frailty by looking at patients. This peer-reviewed study tries to turn that gut sense into a measurable score, which also raises questions about errors, bias and misuse.
Know this first
Context from the editor, not the article · 26 sec
1 · The doctor's eyeball test
Oncologists routinely size up how frail or robust a patient looks. That impression shapes whether someone is offered surgery, chemotherapy or radiation, or steered toward end-of-life care. It is quick and useful, but subjective.
2 · Biological versus chronological age
Chronological age is time since birth. Biological age is how old the body seems to be, judged from signs of wear. Someone whose body seems older than their years tends to have worse health outcomes.
3 · Pretrain, then fine-tune
Many modern AI models first learn general patterns from huge unlabeled datasets, with no specific goal. They are then adjusted, or "fine-tuned", on smaller labeled datasets to do one particular job.
4/5Universe Today· Brian Koberlein· Oct 19
Black hole jets heat a galaxy's outer gas halo more widely than expected
Astronomers combined optical and radio surveys of hundreds of galaxies with jets. They found glowing ionized hydrogen lined up with the jets, well out into the gas halo, which suggests the jets heat that halo and limit star formation.
Why it matters · It's evidence for how an object the size of a solar system can control star formation across a galaxy 100,000 light-years wide, one of the main open questions in galaxy evolution.
Know this first
Context from the editor, not the article · 30 sec
1 · Black holes shape galaxies
Every large galaxy has a central supermassive black hole, and the mass of the hole tracks properties of its galaxy. Astronomers think energy from the feeding black hole regulates star formation, a process called feedback. The details are still unclear.
2 · The circumgalactic medium
Around a galaxy's visible disk of stars sits a huge, faint halo of gas. As it cools it can fall inward and feed new stars. Surveys find much of it stays out at the edges, and nobody knows why.
3 · Reading gas by its light
Hydrogen whose electrons have been stripped emits a red line called H-alpha. Other elements absorb specific colors from background light. Together these lines show where gas is, how hot it is, and how ionized it is.
5/5Scientific American· Oct 19
Brain's face and voice areas also respond to emotion from the other sense
Ghent University researchers scanned 24 people watching and hearing actors show emotions. The brain areas for faces and for voices responded to emotions from either sense, suggesting they track the emotion more than the sense.
Why it matters · It challenges the long-held picture of separate sensory channels for reading emotion, and it may explain how the brains of deaf and blind people rewire.
Know this first
Context from the editor, not the article · 26 sec
1 · Specialized brain regions
Neuroscientists have long identified patches of cortex that respond most strongly to one kind of input. Some respond mainly to faces, and some, along the temporal lobe, respond mainly to human voices.
2 · How brain scanning shows activity
Functional MRI does not record neurons directly. It tracks changes in blood oxygen, which rise when a region is working harder. Researchers then compare which areas respond under which conditions.
3 · The old model of emotion
The standard view held that the brain first handles each sense in its own areas. Information about a face or a voice was thought to come together only later, when the brain works out what someone feels.
A way to express mass change as the thickness of a water layer spread evenly over an area.
Aquifers
Underground layers of rock or sediment that hold groundwater that can be pumped or naturally recharged.
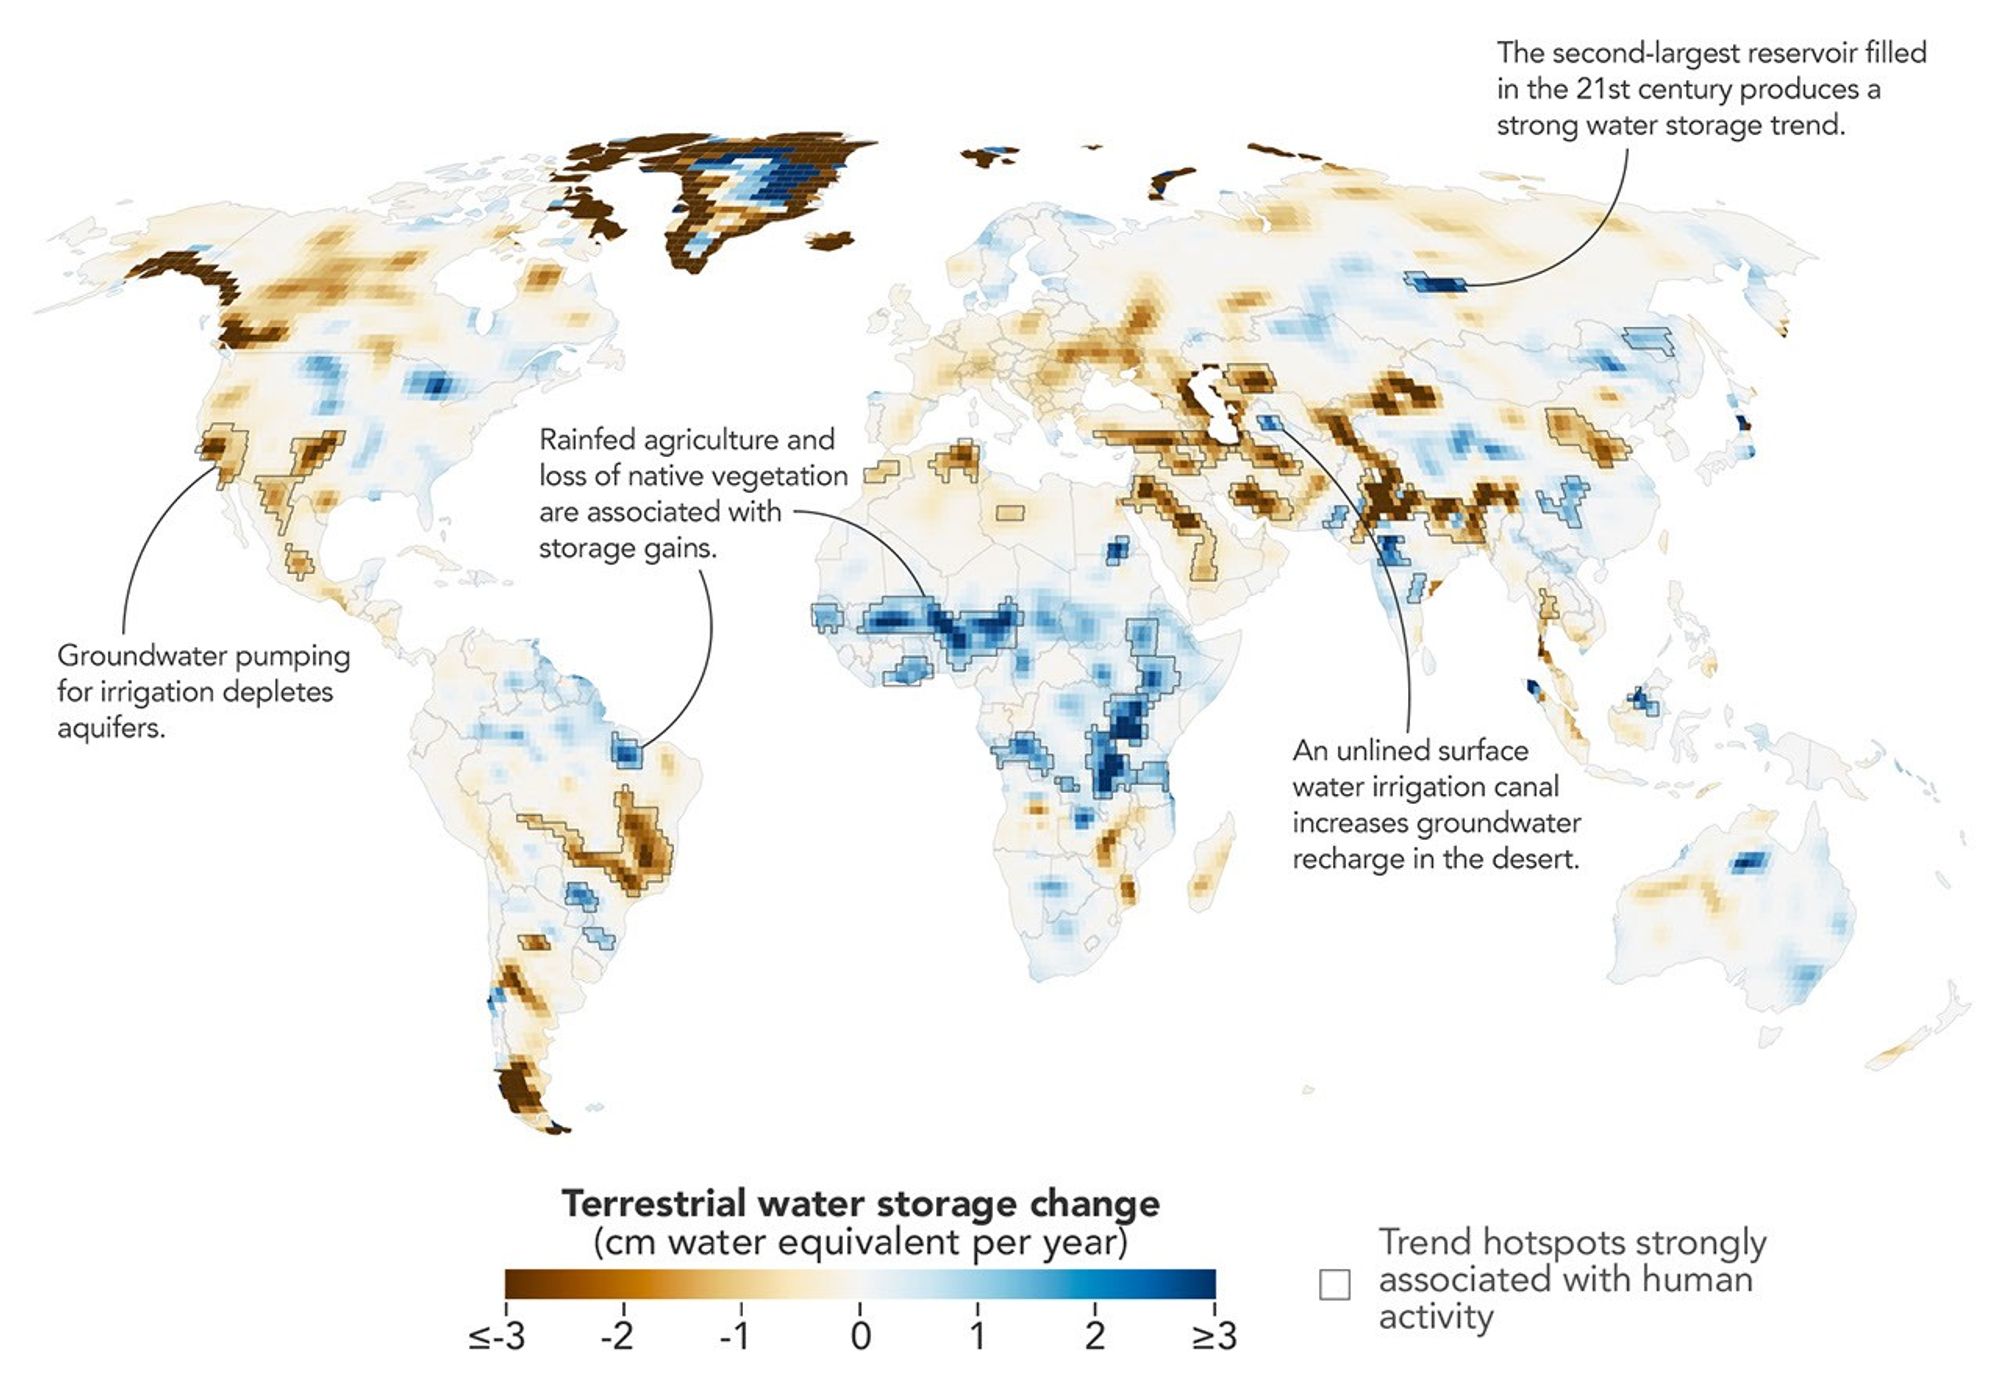
Land water storage trends, 2002–2025: blue shows gains, brown losses; black outlines mark human-linked regions.1 / 2
A NASA-led team has re-analyzed more than 23 years of satellite gravity data, from April 2002 to November 2025. The result is a map of how water stored on land has changed, in five to 10 times finer detail than before. The peer-reviewed study, in the Proceedings of the National Academy of Sciences, found 40 regions where these changes line up with human activity as well as with climate. Such regions turned up on every nonpolar continent except Australia.
Weighing water from orbit
1 is all the water on land combined: snow, ice, lakes, reservoirs, soil moisture and groundwater. It is measured by 2 (Gravity Recovery and Climate Experiment) and its successor 3 (GRACE Follow-On). Each mission is a pair of satellites flying in tandem. When the lead satellite passes over extra mass, gravity tugs it slightly ahead, and instruments record the change in distance between the two. Because water is heavy and shifts constantly, these changes show where water is gained or lost.
The catch is blur. Gravity signals smear out over large areas, so standard monthly maps show only broad patterns, and even big reservoirs were hard to pick out.
Trading time for detail
Lead author Mary Michael O'Neill of NASA Goddard and colleagues dropped the month-by-month view. Instead they pooled every satellite pass from two decades into a single long-term trend. Many passes over the same ground sharpen the spatial picture, but the map loses track of when changes happened. Statistical analysis then weighed climate factors against human ones. In four regions a human factor tracked the trend more closely than any climate variable did. These are associations, not direct proof of cause.
What turned up
Groundwater pumping drains storage. Losses showed up in California's Central Valley, the southern US High Plains, Chihuahua in Mexico, and northern India. India's decline is steeper than earlier estimates, and melting Himalayan glaciers explain only 15% of it.
Some farming adds water. In parts of sub-Saharan Africa, water tables rose where millet replaced savanna, despite below-average rain. Brazil's Maranhão state showed a similar gain where soybeans replaced forest. The researchers suggest efficient crop water use and Indigenous practices that guide water into shallow aquifers, but call these partial explanations.
What's open
The method can't yet show how trends changed over time, or how dams and diversions affect storage downstream. O'Neill hopes to recover that timing by combining the sharp trend map with the monthly products, or by running the method over shorter periods. That would let the team watch how local water responds to droughts or policy changes.
A NASA-led team has mapped how the water stored on Earth's land changed between April 2002 and November 2025, in five to 10 times more spatial detail than earlier analyses. The study was led by Goddard Space Flight Center hydrologist Mary Michael O'Neill and published in the peer-reviewed Proceedings of the National Academy of Sciences. It identifies 40 regions where trends in stored water line up with human activity as well as with climate. On every nonpolar continent except Australia, irrigation, reservoir filling or land-use change was significantly related to how much water the land gained or lost.
What's being measured
1 is all the water held on land added together: snow and ice, surface water such as lakes and reservoirs, moisture in the soil, and groundwater in aquifers. Most of it is hard to watch directly. Wells sample groundwater only at scattered points, and no optical satellite can see into an aquifer.
The data come from 2 (Gravity Recovery and Climate Experiment) and its successor 3 (GRACE Follow-On). Each mission is a pair of satellites flying one behind the other. When the lead satellite passes over a region with more mass, the slightly stronger gravity pulls on it, and the distance between the two changes. Instruments on board measure that distance very precisely. Water is heavy and moves around constantly, while rock mostly stays put. So month-to-month changes in mass under the satellites mainly show water arriving or leaving.
Why detail has been hard to get
Gravity is a blunt tool. A mass anomaly on the ground pulls on a satellite hundreds of kilometres up as a smeared-out signal. As a result, standard GRACE products are monthly maps that show only broad patterns. Hundreds of large reservoirs were filled during the study period, the authors note, but at that coarse resolution most were difficult to track.
The trick: trade time for space
The team's approach rests on one observation. Over more than 20 years, the satellites have passed over most of the planet many times, each time on a slightly different track. If you give up the month-by-month timeline and ask only for the long-term trend, you can pool all of those passes. Together they sample the ground far more densely than any single month's data. That pooling produced a trend map with five to 10 times finer spatial detail. The cost is that the map shows one average rate of change per location (expressed as equivalent water depth gained or lost per year), not how that rate rose or fell over time.
An analogy (ours, not the article's): a single photo of a dim scene is grainy, but stacking hundreds of exposures of a still scene sharpens it. You just lose any motion that happened in between.
On top of the trend map, the researchers used statistical techniques to weigh how strongly each trend related to climatic factors and to human factors, and to pinpoint where human activity likely contributed. The article does not say which statistical methods or which human-activity datasets were used. Note also that the method finds associations, which the article phrases as trends that "aligned with" or were "strongly associated with" human activity. It does not directly prove cause. In four continental regions, O'Neill says, a human-related variable showed a stronger relationship with the storage trend than any climate variable did.
What the map shows
Groundwater irrigation drains storage. Farmland irrigated with groundwater was strongly linked to declines on several continents. In North America those include California's Central Valley, the southern High Plains of the US, and Chihuahua, Mexico. In all three, long droughts have pushed farmers to pump more groundwater. In northern India, groundwater pumping drove a decline that the refined analysis shows is steeper than earlier estimates suggested. Retreating Himalayan glaciers accounted for only 15% of the loss there, consistent with earlier work.
Some farming adds water. In parts of sub-Saharan Africa, native savanna was replaced by rainfed millet fields during the study period. There, water tables rose even though rainfall was below average. Northern Brazil's Maranhão state showed a similar gain where soybean fields replaced forest and shrubland. The researchers suggest two partial explanations: cereal and legume crops use water efficiently, and Indigenous practices help direct water into shallow aquifers. These are proposed explanations, not established mechanisms.
Engineering becomes visible. Russia's 4 on the Angara River, the second-largest reservoir filled this century, produced the strongest storage trend in nonpolar northern Asia. In Turkmenistan, the long, largely unlined 5 carries river water across the Karakum Desert to irrigate crops. So much water seeps out along the way that the desert shows a measurable gain in stored water.
According to co-author Matthew Rodell, the finer resolution revealed some human impacts that had not been detected before and showed that some known trends were stronger than thought. It also gives a way to monitor remote regions where wells and gauges are scarce.
Limits and next steps
The main trade-off is built into the method: the sharper map is a single long-term trend, so it can't show when changes happened or how they responded to particular droughts or policies. The analysis is also local. It doesn't yet separate effects from nearby activity from effects carried downstream from dams, diversions or irrigation elsewhere.
O'Neill says those are the next targets. She wants to trace downstream effects, to separate local from non-local influences, and to "recover more of the temporal picture." That could be done by combining the high-resolution trends with the standard monthly products, or by running the same technique over shorter windows. Done that way, she says, it "could help track how localized trends evolve in response to specific events like droughts or policy changes."
Remember
Giving up month-by-month timing let researchers sharpen gravity maps 5–10 times, enough to see single reservoirs and canals.
Groundwater-irrigated farming drains storage, but rainfed cropland expansion in parts of Africa and Brazil coincided with rising water tables.
The links are statistical associations; the researchers' explanations for water gains under new cropland are tentative.
Astrochemists simulate how light and gas interact, predict the light each molecule should give off, and compare that with telescope images. For decades, standard models have been one-dimensional, treating a cloud edge as a flat stack of layers.
Webb image of the Orion Bar, the ridge of gas and dust used as the benchmark region.1 / 3
A team led by Brandt Gaches of the University of Duisburg-Essen has built what it calls the first fully three-dimensional, high-resolution chemical model of a region like the Orion Bar. The model reproduces structures that older, simpler models could not. The peer-reviewed study appears in Astronomy and Astrophysics.
The problem
The Orion Bar is a ridge of gas and dust in the Orion Nebula, about 1,350 light years away. It is a textbook 1: a cloud edge where ultraviolet light from young, hot stars controls the chemistry. One key process is photodissociation, where light splits hydrogen molecules (H2) into separate atoms. We see the Bar almost edge-on, so its chemical zones can be told apart. That has made it the standard test for PDR models.
Those models are mostly one-dimensional. They treat the cloud edge as neat stacked layers, each at its own depth. But the 2 radio telescope array and the 3 found two of those layers overlapping. One is the 4, where molecular hydrogen survives the starlight. The other is the 5, where ionised carbon (C+) picks up an electron and becomes neutral carbon. The authors write that models built on "simplified geometrical assumptions" have struggled to reproduce the observed emission.
What the 3D model does
The researchers calculated the chemistry through a realistic, clumpy, three-dimensional distribution of gas. Their model is 6: it describes chemistry in balance, not how it changes over time. Gaches says the 3D structure "creates shadows and shields parts of the cloud from the intense radiation." Dense clumps shelter the gas behind them, so the chemical fronts become ragged surfaces rather than flat sheets. In places, H2 and C+ exist side by side.
Results
The model reproduces the arc- and filament-like H2 emission JWST sees in the Bar. It also explains the overlap of the two fronts. The team stresses that it did not tune the model to fit the Bar. The features came out of the geometry on its own. Its conclusion is that the shape of the front strongly controls the light it gives off.
The overlap matters for chemistry too. Where H2 and C+ meet, reactions that are normally blocked can go ahead. These can build hydrocarbons such as methane and acetylene, and large carbon molecules called 7.
Caveats
The Universe Today article gives no figures for the model's resolution and no quantitative match to observations. It also doesn't say how the 3D gas field was generated. The authors call the work "a turning point for astrochemistry." What it shows so far is that the approach works. Next, they want to study gas shaped by different physical processes.
Researchers led by Brandt Gaches of the University of Duisburg-Essen have published what they describe as the "first fully three-dimensional high-resolution model of an Orion Bar analog." It is a chemical simulation of a cloud edge being eaten away by starlight. The peer-reviewed paper, "Resolving dense photodissociation regions: The structure of photochemical fronts in three-dimensional gas distributions," appears in Astronomy and Astrophysics. Its main result is that geometry matters. Once the gas is treated as clumpy and three-dimensional, the model reproduces structures that telescopes see and flat models miss.
The Orion Bar as a benchmark
The Orion Bar is a ridge of gas and dust in the Orion Nebula, about 1,350 light years away. It sits at the boundary between the nebula's hot, bright interior and the colder molecular cloud behind it. That makes it a 1: gas whose heating and chemistry are controlled by far-ultraviolet light from nearby massive stars. In these regions the light splits molecules apart (photodissociation) and strips electrons from some atoms.
"For decades, the Orion Bar has been the prototypical photodissociation region," the authors write. The reason is the viewing angle. We see the Bar nearly edge-on, so the transition from atomic to molecular gas is laid out across the sky rather than stacked along our line of sight. "That makes it a benchmark for testing models," Gaches said.
The textbook picture, and the problem with it
The standard explanation goes like this (it is general background, not from the article). As ultraviolet light enters a cloud, dust and the outer gas gradually absorb it. Molecular hydrogen also shields itself: the outermost H2 molecules absorb the specific wavelengths that would destroy the molecules deeper in. So at some depth, H2 survives. That boundary is the 2.
Carbon behaves differently. Ultraviolet light can ionise carbon even where it can't ionise hydrogen, so ionised carbon (C+) fills the outer zone. Deeper in, where less light gets through, C+ picks up an electron and becomes neutral carbon. That boundary is the 3. One-dimensional models treat the cloud as a single line of depth. They compute these fronts as separate, stacked layers at different depths.
Observations disagree. The 4 radio telescope array and the 5 found that the H2 dissociation front and the C+ recombination front overlap in the Orion Bar. "Despite considerable theoretical effort, existing modeling approaches based on simplified geometrical assumptions have difficulties reproducing the spatial emission structure," the authors write. That gap is serious. Astronomers interpret dense PDRs throughout the galaxy, and in other galaxies, using these models. A model that misplaces the fronts will misread the light that comes from them.
What the team did
Rather than fitting more parameters to a flat geometry, the researchers calculated the photochemistry through realistic three-dimensional density distributions. The gas is clumpy and uneven, not a smooth slab. The model is 6. It finds the chemical balance the gas settles into under a given radiation field, instead of following the chemistry over time.
The key effect is shadowing. "The three-dimensional structure of the gas makes a crucial difference," Gaches said. "It creates shadows and shields parts of the cloud from the intense radiation."
An analogy (ours, not the authors'): picture sunlight entering a forest. In a one-dimensional model, the forest is a uniform canopy, and the light fades at the same rate everywhere, so "dark" begins at one fixed depth. A real forest has gaps and dense thickets. Light reaches deep through the gaps, while some ground near the edge sits in deep shade. The "edge of darkness" becomes a ragged, folded surface. In the 3D model the chemical fronts behave the same way. Because they twist through space, the zone where H2 survives and the zone where C+ persists can overlap. One of the paper's renderings shows exactly that, with regions where the two fronts coincide.
Results
The authors report that their model "can reproduce the complex morphology of H2 emission seen in observations, in particular, the arc- and filament-like features, and it provides a physical explanation of its chemistry." JWST images of the Bar show these arcs and filaments clearly, and the model recreates some of them.
Notably, the team was not trying to match the Bar. "While the main objective was not to provide an optimized fit to the Orion Bar, our three-dimensional chemical model was able to reproduce many of the features found in observations," they write. Getting a match without tuning is stronger evidence than a tuned fit, because it suggests the geometry, not adjustable settings, produces the effect. They conclude that the spatial shape of the PDR front plays a critical role in determining what it emits. Gaches notes that the shadowing leaves "a clear signature in the infrared- to radio- wavelengths of light we observe."
Why the overlap matters for chemistry
Where H2 and C+ coexist, what the article calls "excited-state hydrocarbon chemistry" can take place. The general idea is this: ultraviolet light pumps H2 molecules into energised states. That extra energy lets reactions with C+ go ahead that would otherwise be blocked. These pathways can lead to hydrocarbons such as methane and acetylene, and to 7 (PAHs). PAHs are large ring-shaped carbon molecules that store a lot of interstellar carbon and may be building blocks for organic matter. So where these fronts lie affects which carbon compounds the region can make.
What remains open
The authors call the work "a turning point for astrochemistry, where three-dimensional steady-state models can deliver fundamentally new insights." That is their view. The Universe Today article does not report the model's spatial resolution, how the 3D density field was generated, or any quantitative measure of how well the model matches observations. It also does not say how much computing power the approach needs compared with 1D models, which matters if others are to use it widely.
The steady-state assumption also has a limit. Real PDRs move as starlight pushes the gas away, and a steady-state model cannot capture chemistry that lags behind those changes. And the model describes an "analog" of the Bar, not a reconstruction of its actual 3D shape. We only see the Bar's projection on the sky, so that true shape is hard to know.
Next, the authors say, is to study gas structures created by different physical processes and examine their photochemistry and emission in 3D. That would test whether shadowing explains other PDRs as well as it explains the Orion Bar.
Remember
Flat, layered models couldn't explain why JWST and ALMA see hydrogen-molecule and ionised-carbon zones overlapping in the Orion Bar.
Clumps in 3D gas cast ultraviolet shadows, folding chemical boundaries so the two zones can coexist.
The model matched the observed arcs and filaments without being tuned to the Bar, which is stronger evidence than a tuned fit.
Attention map showing which facial regions the AI relies on, such as the nose bridge and under-eye areas.
Researchers at Mass General Brigham in Boston have built an AI model that estimates a cancer patient's risk of dying from one photo of their face. The peer-reviewed study appeared this week in 1. The model is not reliable for every individual, but across groups of patients, higher scores went with higher death rates.
Why try this
Ray Mak, the radiation oncologist who led the work, says doctors are trained to walk into a room and judge at a glance how frail a patient is. That judgment helps decide between surgery, chemotherapy, radiation or end-of-life care, but it is subjective. A score computed from a photo could make it more consistent.
How it works
First the model studied 40 million face images with no specific goal, picking up general patterns in how faces vary. The team then 2 it, meaning they retrained it on labeled examples, to do two jobs:
estimate 3, or how old a face looks rather than how old the person is
predict a cancer patient's odds of survival
Results
In a test group of 3,820 cancer patients, 122 got the highest risk scores. Of those, 64 died within 90 days of the photo. The article doesn't give the average death rate for comparison.
In a separate group of more than 38,000 patients, people whose faces looked older than their real age were more likely to die.
Adding both scores to a standard 4, a tool that combines clinical factors to forecast outcomes, predicted survival better than either score alone.
Using 5, which shows the parts of an image that drive a prediction, the team found that age estimates relied on the creases from nose to mouth and on the forehead. Death-risk scores relied on the bridge of the nose and the skin under the eyes. Nobody knows why those areas matter. Smokers and heavy drinkers tended to look older, so the model may partly be picking up the visible effects of those habits.
Expression, makeup and lighting didn't change the results. One exception: people who'd had a nose job were rated slightly older after the surgery than before it.
Caveats
The model isn't ready for clinics. It was trained mostly on white patients from the Boston area, so it may work less well on other faces. The article also doesn't say whether it beats doctors' own judgments.
NYU bioethicist Matthew Liao warns that a wrong prediction could mean a patient misses care they need. He also worries that insurers or employers could use the tool to screen people. Mass General Brigham has a patent pending.
A team led by Ray Mak, a radiation oncologist at Mass General Brigham Cancer Institute in Boston, reports an AI model that estimates a cancer patient's risk of death from one photograph of their face. The study appeared on Monday in the peer-reviewed journal 1. The researchers write that, to their knowledge, it is the first AI algorithm to predict cancer patient survival directly from a simple face photograph. The model is not accurate for every individual. Across groups of patients, though, higher risk scores went with a higher chance of dying.
The problem it tries to solve
Mak says the idea comes from something doctors already do. "We're trained in medical school to walk into a room, look at the patient and make an assessment—an impression of how healthy, frail or sick they are." That impression feeds into treatment choices: surgery, chemotherapy, radiation, or a shift toward end-of-life care. The weakness, in his words, is that "that's really a subjective assessment." Two doctors can look at the same patient and come away with different views, and neither view is recorded as a number. The team hopes a score computed from a photo could give doctors and patients something more objective to weigh.
How the model was built
The work had two stages, a common recipe in current AI:
Pretraining without a task. The algorithm was shown 40 million face images and left to learn the patterns in them, with no instruction about what to look for. This type of training, often called 2, gives a model a general sense of how faces vary.
Fine-tuning for two jobs. The pretrained model was then adapted to analyze new photos in two ways. One version estimates a person's 3, meaning how old the face looks rather than how old the person is. The other estimates a cancer patient's odds of survival.
The results
The team tested both versions on cancer patients whose photos were not used in training.
Survival score. In a test group of 3,820 cancer patients, 122 received the highest risk scores. Of those, 64 (about 52%) died within 90 days of the photo being taken. The article does not give the 90-day death rate for the whole test group, so we can't tell from it how much higher than average that is.
Face age. In a separate group of more than 38,000 cancer patients, people whose faces looked older than their real age were more likely to die.
Combined. Mak says the two scores are more useful together. "When we put both the face age and face survival scores into a clinical 4, we do better at survival prediction than either one alone." A prognostic model is a statistical tool that combines several factors to forecast how a patient will do. The article does not say how big the improvement was or which clinical factors were already in the model.
Where the model "looks"
To see what drives the predictions, the team used a technique they call 5. It highlights the parts of an image that most influenced the model's output, a bit like a heat map laid over the face.
For age, the model concentrated on the 6 (the creases running from the nose to the corners of the mouth) and parts of the forehead.
For risk of death, it focused on the bridge of the nose and the areas below the eyes.
The researchers say it is unclear why those regions are linked to mortality. An attention map shows where the model's signal comes from. It does not explain the biology behind it.
Some of the signal probably reflects known risks. Smokers and heavy drinkers tended to get face ages older than their real ages, Mak says. So part of what the model "sees" may be the visible effects of habits that also shorten lives.
Robustness checks
The predictions held up whether a person was smiling or frowning, wearing makeup or not, and across different lighting. For age, the model also coped with common cosmetic surgery, with one exception: after a 7 (nose job), people were rated slightly older than in photos taken before the operation. That fits with the finding that the nose region matters to the model.
Limits and open questions
Mak says the tool is not ready for clinical use. The main stated limitation is the data: the survival model was trained on cancer patients from the Boston area, most of them white. A model trained on one population can perform worse on faces unlike those it learned from. The team is collecting more diverse images and has opened a public site where volunteers can submit photos and get a face-age estimate.
Several things the article leaves unanswered:
How it compares with doctors. The article does not say whether the model beats or adds to clinicians' own eyeball assessments, which is the comparison that would matter most in a clinic.
Standard accuracy measures. No discrimination statistics or false-positive rates are reported, so it's hard to judge how often individual patients would be misclassified.
Mechanism. The link between the area under the eyes and survival is a correlation. Nobody yet knows what it reflects.
Mass General Brigham has a patent pending on "face health" algorithms. Mak imagines the tool eventually serving as one extra data point in treatment decisions, and perhaps as an early warning when someone seems to be aging faster than expected.
The ethical concerns
Matthew Liao, director of the Center for Bioethics at New York University, was not involved in the study. He calls it "interesting" and says such a tool could help flag people who need extra care. He also warns about errors: "If it gets it wrong, we might be sort of not providing care to someone who actually needs it." His larger concern is use outside medicine. Insurers could use it to grant or deny coverage, or employers could use it to favor job candidates who look "healthier." "We really need to think through the societal implications," he says.
Mak is optimistic and acknowledges that "there's still a lot of development ahead and clinical testing."
Remember
Of the 122 highest-risk patients, 64 died within 90 days. The article gives no overall death rate for comparison.
Death-risk predictions focused on the nose bridge and under-eye areas, and nobody yet knows why.
The model was trained mostly on white Boston patients and hasn't been compared against doctors' own judgments.
Artist's view: a black hole's jets reaching from the galaxy's center out into the surrounding gas halo.
Astronomers report that 1 from 2 heat the gas around their galaxies more widely than expected. The study, by Namrata Roy and colleagues, appears in The Astrophysical Journal Letters.
The puzzle
A supermassive black hole can weigh billions of Suns but fits in a region about the size of a solar system. Its galaxy can be more than 100,000 light-years across. Black holes and galaxies grow in step, but it's unclear how something so small affects something so large.
This study looks at the galaxy's outskirts, in the 3. That is a vast, faint halo of gas around the visible galaxy. As CGM gas cools it should fall inward and feed star formation. Yet much of it lingers at the edges.
Some black holes fire narrow jets of ionized gas at nearly light speed, along their polar axis. The jets reach the outer galaxy, but because they are so narrow, astronomers assumed they left most of the halo alone.
What they found
The team studied hundreds of galaxies with active jets, combining two surveys. 4 (the LOFAR Two-meter Sky Survey) is a radio survey that reveals the jets. 5 (the Dark Energy Spectroscopic Instrument) provided optical spectra of the surrounding gas.
The key signal was 6, a red line given off by ionized hydrogen. Wherever it appears, something has energized the gas. The researchers found H-alpha near the jets, as expected. They also found it farther out, still lined up with the jets, which suggests radiation from the jets ionizes gas beyond the jet channels.
A magnesium 7, which traces cooler halo gas, showed that the CGM overall is relatively cool. That contrast points to the jets as the heat source, not some general warmth in the halo.
Why it matters
Heated halo gas is slower to cool and fall inward, so the galaxy gets less fuel for new stars. This fits the idea of "8," in which feeding black holes hold back star formation. The study suggests a way that can work far from the galaxy's center.
Caveats
The article reports no figures. It doesn't say how far the glow extends, how much heating occurs, or whether it shows up in single galaxies or only in averages. It also doesn't explain how other ionization sources were ruled out. Finding that jets warm some halo gas doesn't show that they measurably reduce star formation, and the article notes that other factors also matter.
A study in The Astrophysical Journal Letters by Namrata Roy and colleagues reports that 1 from 2 affect the gas surrounding their galaxies more widely than expected. In radio galaxies, the glow of ionized hydrogen lines up with the jets and extends out into the galaxy's halo of gas. The paper's title calls this "Strong, Jet-aligned Hα Emission around Radio Galaxies." The authors read it as a sign that jets heat the halo and slow the flow of fuel for new stars.
A problem of scale
A supermassive black hole can weigh millions or billions of times as much as the Sun, but it occupies a region about the size of a solar system. Its host galaxy can be more than 100,000 light-years across and hold more than 100 billion solar masses. Observations show that black holes and galaxies grow in step, yet it isn't clear how such a small object influences something so large.
Most work on this question looks at galaxy centers, where the black hole, most of the stars and much of the gas and dust are. This study looks instead at the outskirts, in the 3. That is the large, diffuse halo of gas outside a galaxy's stellar body. In the usual picture, CGM gas slowly cools, sinks inward and becomes raw material for stars. Surveys find that much of it stays at the outer edge instead, so something must be stopping it from cooling and falling in.
Why jets seemed an unlikely answer
Some actively feeding black holes launch jets of ionized gas at nearly the speed of light, along the black hole's polar axis. These jets reach the galaxy's outer regions, but they are narrow beams. The working assumption was that they pierce the CGM without disturbing most of it, like a laser passing through fog. (That analogy is the editor's, not the article's.) If that were true, jets could not explain why the whole halo fails to fall inward.
What the team measured
The researchers studied hundreds of galaxies with active jets, using two surveys:
4, the LOFAR Two-meter Sky Survey. LOFAR is a low-frequency radio telescope array based in Europe. Jets glow at radio wavelengths, so LoTSS shows which galaxies have them and which direction they point.
5, the Dark Energy Spectroscopic Instrument. DESI records spectra for millions of galaxies. Here those spectra supplied the optical measurements of the surrounding gas.
The key signal is 6, a red emission line given off by ionized hydrogen. If H-alpha is present, something has energized the gas enough to strip hydrogen of its electrons. The team found H-alpha close to the jets, as expected. They also found it farther out, still aligned with the jets. According to the article, radiation from the jets ionizes gas beyond the jet channels themselves, so the jets heat more of the CGM than the "narrow beam" picture predicts.
As a cross-check, the team examined an 7 of magnesium, which is often used to trace cooler gas in halos. It indicated a lower overall temperature for the CGM as a whole. The halo in general is not hot, but the regions along the jets are lit up. The authors take this contrast as evidence that the jets themselves cause the heating, not the halo's background state.
Why it matters for star formation
If jets put heat into the CGM, less of that gas cools and sinks inward, and the galaxy has less fuel for new stars. Koberlein's summary is that jets "stir the pot." The black hole can't reach distant gas directly, but its jets slowly keep that gas from becoming stars. This fits a widely held view called black-hole 8, in which feeding black holes suppress star formation in their hosts. The study adds a mechanism that works far from the center.
Caveats and open questions
The article gives no numbers. It doesn't say how far the H-alpha extends, how bright it is, how many galaxies were in the final sample beyond "hundreds," or how much heating the authors estimate. It doesn't say whether the signal shows up in individual galaxies or only when many are averaged together. It also doesn't explain how alignment with the jets was measured, or how the team ruled out other sources of ionization, such as young stars or the black hole's central glow.
A bigger question is impact. Showing that jets heat some halo gas is different from showing that they heat enough of it to measurably reduce a galaxy's star formation. The article itself says other factors also drive star production. The result is a peer-reviewed letter, a short-format paper. It establishes a link between jets and warm halo gas but does not provide a full energy budget. Follow-up work would need to measure how much gas is heated, and for how long, in individual systems.
Remember
Jets are narrow beams, but the glowing hydrogen they produce extends into the halo well beyond the jet channels.
Matching radio maps of jets with optical spectra of gas is what linked the jets to the heating.
The article gives no figures for heating or extent, so the effect on star formation is still unmeasured.
For decades, the standard account said the brain reads other people's emotions through separate channels. It analyzes faces in face-processing areas and voices in voice-processing areas, then combines the results. A new peer-reviewed study in the Journal of Neuroscience suggests the separation is much weaker than that.
What the researchers did
Stefania Mattioni, a cognitive neuroscientist at Ghent University in Belgium, and her colleagues put 24 people in an 1 scanner. The participants were shown clips of actors portraying emotions such as happiness, disgust and fear. Some clips had both picture and sound. Others had only the video or only the audio.
What they found
Audio-only clips activated regions known to process faces, and silent video clips activated regions known to process voices. Each emotion engaged both sets of regions in a similar way, whether it arrived through the eyes or the ears.
"It seems that these regions are more guided by the emotion than by the 2," Mattioni says. Here "modality" means the sense being used. To use an analogy (ours, not the article's): the face area seems to act less like a camera that only takes pictures and more like a sadness detector that will take evidence from any sense.
When people could both see and hear an actor, their brains responded differently than they did to either input alone. Stefania Benetti of the University of Trento in Italy, who was not involved in the study, says the brain is "doing more than adding two inputs together." She argues that combining sight and sound reduces ambiguity, so emotions can be recognized faster and more accurately in noisy settings.
Why it fits earlier work
The result fits earlier findings on brain 3, the brain's ability to rewire itself. In people who became deaf early in life, 4 take on processing of facial expressions. In blind people, 5 take on vocal expressions. Benetti suggests this reuse is possible because these regions' real job is emotion, not a single sense.
Caveats
This is a single study of 24 people, and the actors were performing emotions, not feeling them. MRI shows which areas become active together, but it cannot show that the face area is needed to understand a voice. The article also doesn't explain how "similar" the activation patterns were or how the analysis measured that.
The authors say the findings could eventually help design interventions for people who struggle with social cues. That idea is still speculative.
A study in the Journal of Neuroscience challenges a long-standing idea about how we read emotion in others. The old view held that the brain handles faces and voices in separate, specialized regions and combines them only later. The new results suggest those regions respond to emotion arriving through either sense.
The problem
Neuroscientists have mapped regions of cortex that respond most strongly to particular kinds of input. Some areas respond preferentially to faces. Others, along the temporal lobe, respond preferentially to human voices. Given that map, the natural assumption was that emotion recognition works like an assembly line. Each sense is processed in its own region, and the results are merged further downstream.
Stefania Mattioni, a cognitive neuroscience postdoctoral researcher at Ghent University in Belgium and the study's lead author, thought that assumption didn't match how emotion reaches us in daily life. "We don't only see a face that is sad," she says. "We normally also hear the sound of the person crying, for instance. So, the brain is actually structured to interact with this kind of multisensory stimulation."
Testing this is hard because faces and voices almost always occur together. To find out whether a "face region" cares about faces as such, or about what the face expresses, you have to pull the senses apart.
The experiment
Mattioni's team scanned 24 participants in an 1 machine. Brain-activity scanning of this kind (2) tracks changes in blood oxygen, which serve as a stand-in for how hard a region is working. Participants watched and listened to clips of actors portraying emotions including happiness, disgust and fear. The clips came in three versions:
Audiovisual: face and voice together
Video-only: a silent face
Audio-only: a voice with no picture
This design lets researchers ask a precise question: what does a face-selective region do when there is no face, only a voice expressing an emotion?
The results
The face regions responded to voices. Audio-only clips activated brain regions known to process faces, and video-only clips activated regions known to process voices. Mattioni reports that each emotion activated the face and voice regions in similar ways, whether it was presented visually or as sound.
Take sadness as an illustration. A silent clip of a sad face and an audio clip of a sad voice would both engage the face areas and the voice areas, in a broadly similar way. That is why Mattioni concludes that "these regions are more guided by the emotion than by the 3," where modality means the sense carrying the signal. As an analogy (ours, not the researchers'), these regions behave less like a camera and a microphone wired to separate recorders and more like a single detector for an emotional state that accepts evidence from either input.
Mattioni suggests this could help in situations where only one channel is available, such as a phone call where you hear someone but cannot see them, or the reverse.
The team also found that brain responses changed when participants could both see and hear the actor. Stefania Benetti, an assistant professor of psychology and cognitive science at the University of Trento in Italy who was not involved, puts it this way: "The brain is doing more than adding two inputs together." In her reading, emotion recognition depends on "a multisensory network that integrates what we see and hear." The article does not say what form the extra, non-additive response took.
Why it might work this way
Benetti offers an evolutionary argument. Combining sight and sound "reduces ambiguity and allows us to recognize emotions faster and more accurately, especially in noisy or complex environments." If one channel is degraded, for example a face in dim light or a voice over traffic, the other can fill the gap.
The finding also fits earlier research on 4, the brain's capacity to reorganize. In people who became deaf early in life, 5 adapt to process facial expressions. In blind people, 6 adapt to process vocal expressions. Benetti argues that these regions can be repurposed so readily because their main job was always emotion rather than a single sense. If a region was already handling emotional information from both senses, losing one sense would mean shifting weight rather than starting from scratch.
Caveats and open questions
Several limits apply:
Sample size. Twenty-four participants is typical for brain-imaging studies but small. The result needs replication.
Acted emotions. The stimuli were performed portrayals, which tend to be clearer and more exaggerated than real expressions.
Correlation, not necessity. Brain scanning shows that the face region becomes active when someone hears an emotional voice. It does not show that the region is needed to understand that voice. Testing that would take other methods, such as studying patients with damage to these areas or briefly disrupting them.
Missing analysis details. The article does not explain how "similar" activation was measured, or how strong the cross-sensory responses were compared with responses to each region's preferred sense. Responding to voices is not the same as responding to them as strongly as to faces.
The authors suggest the findings could eventually inform interventions for people who have trouble reading social cues. For now that is a direction for future work, not a demonstrated application.
The broader question is how much of the brain's apparent specialization by sense is really specialization by meaning. This study adds evidence for the meaning side of that debate, at least for emotion.
Remember
Silent emotional faces activated voice regions, and emotional voices alone activated face regions, in 24 scanned participants.
Seeing and hearing together produced brain responses that were more than the sum of the two inputs.
The finding may explain why deaf and blind people's brains readily repurpose face and voice regions.
Engineering shows up. Russia's 4 gave the strongest trend in nonpolar northern Asia. Water leaking from Turkmenistan's largely unlined 5 measurably raised stored water in the Karakum Desert.