Fractions, Fugitive Black Holes and van Gogh's Sky · Morning Gist
Friday, October 235 stories · 14 min
Fractions, Fugitive Black Holes and van Gogh's Sky
How the brain reads numbers, black holes that may get kicked out of their galaxies, a contested date for a painted sky, and Colorado's shrinking groundwater.
Picked from 44 new articles across 10 sources · arrow keys for other days
Today in 30 seconds
30s left
Brain scans of 20 adults show the parietal cortex puts fractions and whole numbers on one shared line, ordered by their value. story 1 ↓
In a survey of 100,000 quasars, the fastest-moving are three times likelier to be dust-obscured, a hint that black holes recoil from galactic centers. story 2 ↓
A shape-matching statistic dates "The Starry Night" sky to July 22, 1889, but a critic disputes the field of view it assumes. story 3 ↓
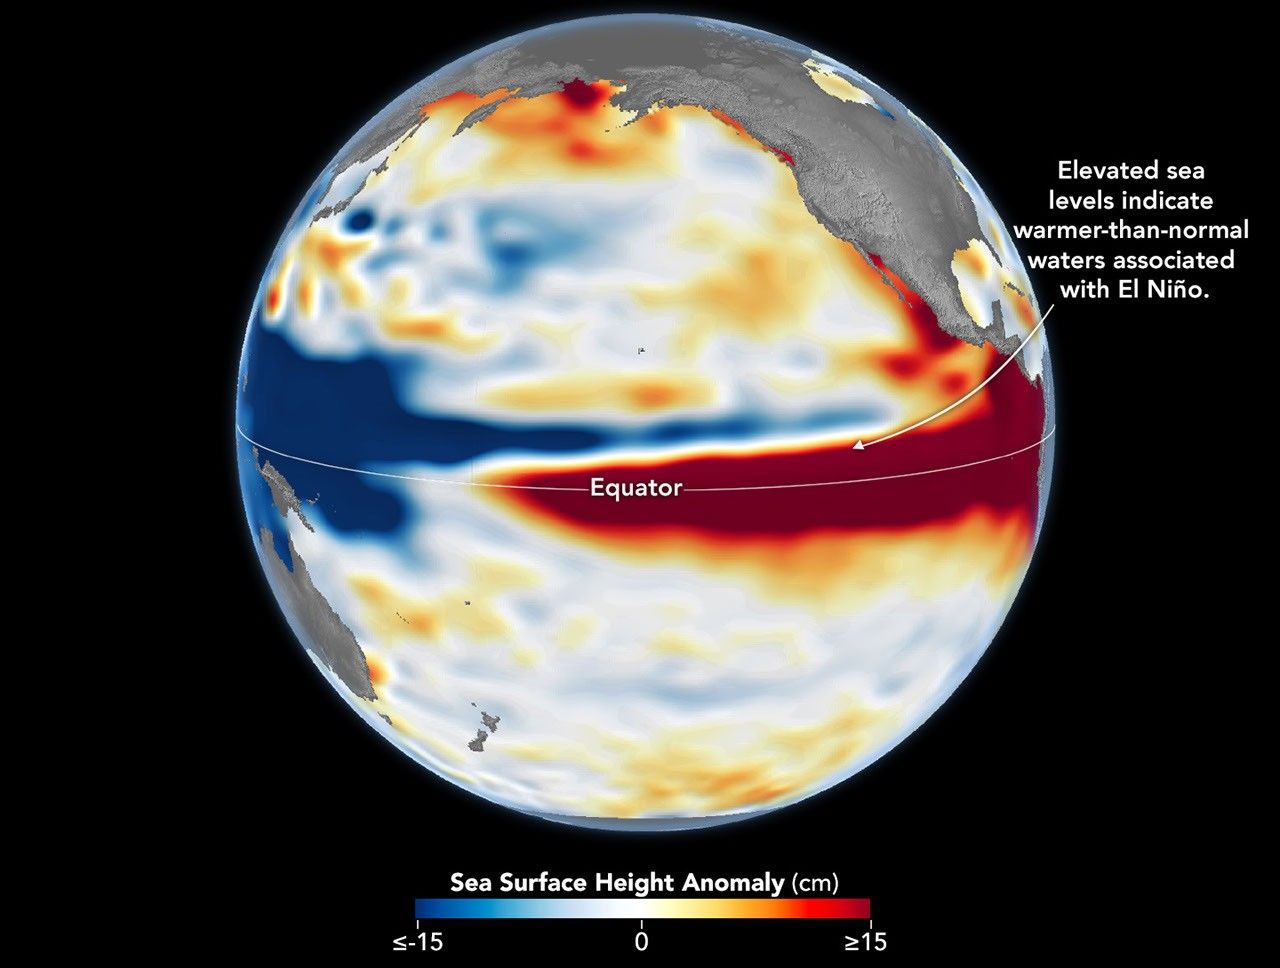
Satellite gravity data show the Colorado's snowy upper states lost twice the groundwater in the 2020–22 drought, weakening their role as a buffer. story 4 ↓
Hubble spectra of six stand-in galaxies suggest young stars, not supernovae, cleared escape routes for the light that reionized the Universe. story 5 ↓
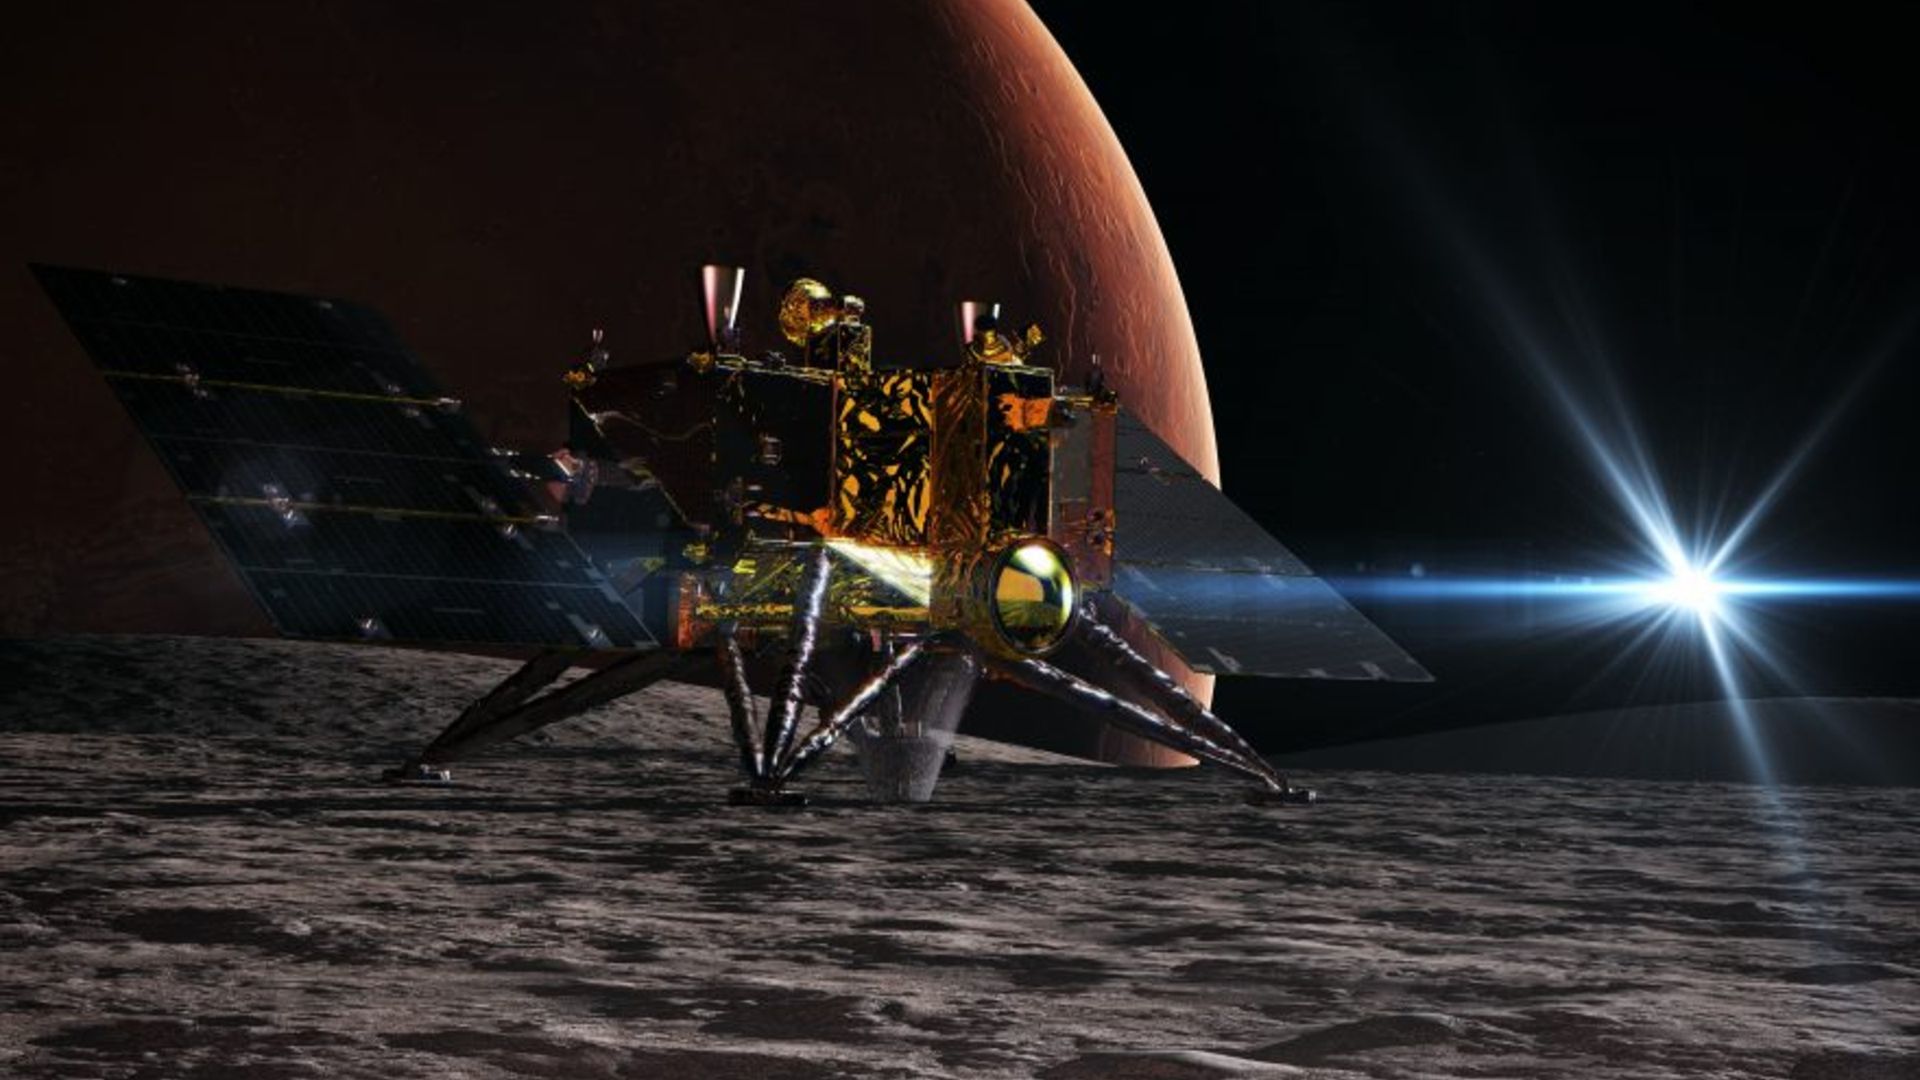
Japan's MMX launched Oct. 19 to land on a Martian moon and bring rocks back to Earth, the first Mars-system round trip.
1/5Live Science· Jenna Congdon · Oct 22
Brain places fractions and whole numbers on one shared mental number line
French researchers scanned 20 adults comparing fractions and whole numbers. A number-processing region of the brain arranged both kinds of number along one line ordered by size, not in two separate systems.
Why it matters · It shows how the brain gets from a written symbol to what it means. That matters for understanding numeracy, and for working out why fractions are so hard to learn.
Know this first
Context from the editor, not the article · 29 sec
1 · The brain's number sense
Decades of research, much of it from Stanislas Dehaene's lab, show that a region near the top and back of the brain, the parietal cortex, represents numerical quantity. Comparing two numbers gets faster and more accurate the further apart they are.
2 · Why fractions are tricky
A fraction's size depends on how its two numbers relate, not on the digits themselves. Learners often fall into a 'whole-number bias' and assume ⅛ is bigger than ¼ because 8 is bigger than 4.
3 · How fMRI reads activity
Functional MRI tracks changes in blood oxygen, which act as an indirect stand-in for neural activity. High-resolution scans can pick up fine-grained spatial patterns across small patches of cortex, not just whether a whole region is active.
2/5Universe Today· Evan Gough· Oct 22
Survey of 100,000 quasars finds hints of black holes kicked from galactic centers
Astronomers analysed about 100,000 quasars and found that the faster a quasar's black hole moves relative to its galaxy, the dustier it looks. That pattern fits black holes kicked off-center by mergers, though other explanations remain possible.
Why it matters · If recoils are common, they shape how giant black holes grow and how many mergers the LISA space observatory should detect after it launches in 2035.
Know this first
Context from the editor, not the article · 27 sec
1 · Black holes that merge
Most large galaxies have a supermassive black hole at their centre. When two galaxies merge, their black holes sink together, orbit as a pair, and eventually merge, giving off gravitational waves: ripples in spacetime.
2 · The predicted kick
Simulations since the 2000s predict that if the waves leave the merger unevenly in different directions, momentum conservation pushes the merged black hole the opposite way, like a gun recoiling. This is called a recoil.
3 · Why single cases fail
Several individual 'recoiling black hole' candidates have been proposed. In each case something else, such as two black holes still orbiting or gas outflows, could explain the same observations, so none has been confirmed.
3/5Science News· Lisa Grossman· Oct 22
Astronomers date van Gogh's "The Starry Night" sky to July 22, 1889
A team led by telescope builder Elijah Jeong-hyun Kim matched the painting's stars, moon and Venus to the predawn sky over Saint-Rémy, France, on July 22, 1889. Critics question the geometry behind the match.
Why it matters · It shows how a statistical shape test can turn "is that a real constellation?" into a number, and why that number is only as good as its assumptions.
Know this first
Context from the editor, not the article · 30 sec
1 · The painting's accepted date
Van Gogh painted "The Starry Night" in 1889 at an asylum in Saint-Rémy-de-Provence. Historians date it to mid-June because of a letter to his brother Theo, written around June 18, that mentions "a new study of a starry sky."
2 · Why skies can be dated
Stars, planets and the moon move in predictable cycles. Software can reconstruct the sky for any place and minute in history, so a painting with recognizable stars, a lunar phase and planets can, in principle, be pinned to a date.
3 · The Hyades and Aldebaran
The Hyades is a nearby star cluster whose stars form a sideways V, the bull's face in the constellation Taurus. Aldebaran, a bright orange star, sits at the V's lower-left tip and outshines the rest.
4/5Live Science· Sascha Pare · Oct 22
Colorado River's wetter upper states lost twice the groundwater in 2020–22 drought
Using gravity-sensing satellites, Virginia Tech researchers found that Colorado, Utah, Wyoming and New Mexico lost about 17.5 cubic kilometers of groundwater in the 2020–22 drought. That is nearly twice the loss in Arizona, Nevada and California.
Why it matters · The Colorado River's water-sharing plans have treated the snowy upper states as a buffer, and this result suggests that buffer is weaker than assumed.
Know this first
Context from the editor, not the article · 32 sec
1 · Two halves of one river
A 1922 agreement, the Colorado River Compact, split the river's water between an Upper Basin (Colorado, Utah, Wyoming, New Mexico) and a Lower Basin (Arizona, Nevada, California). It promised more water than the river has turned out to carry.
2 · Weighing water from orbit
The GRACE satellites, and the GRACE Follow-On pair that replaced them, measure tiny changes in Earth's gravity. Water has mass, so these changes track how much water a region holds. The satellites cannot tell whether that water is snow, soil moisture, a lake or an aquifer.
3 · Groundwater as backup
5/5Universe Today· Evan Gough· Oct 22
Supernovae may have slowed, not driven, the early Universe's reionization
Studying six nearby look-alikes of early galaxies with Hubble, astronomers found that young stars let ionizing light leak out first. Supernovae that came later filled the escape routes with gas and dust.
Why it matters · It challenges a central assumption of cosmological simulations about how the first galaxies made the Universe transparent, and it rests on observations rather than models.
Know this first
Context from the editor, not the article · 28 sec
1 · The Epoch of Reionization
Around 380,000 years after the Big Bang, hydrogen became neutral and the cosmos went dark. Within roughly a billion years, ultraviolet light from early stars and galaxies stripped electrons from that hydrogen again, and light could travel freely.
2 · Ionizing light must escape
Producing enough ionizing photons is not enough. A galaxy's own neutral gas and dust absorb them. The share that gets out into intergalactic space, called the escape fraction, decides how much a galaxy contributes.
3 · Supernova channel theory
One popular idea is that supernova blasts and the winds they drive carve low-density tunnels through a galaxy's gas, so ionizing light can leak out. Many computer simulations of reionization rely on this mechanism.
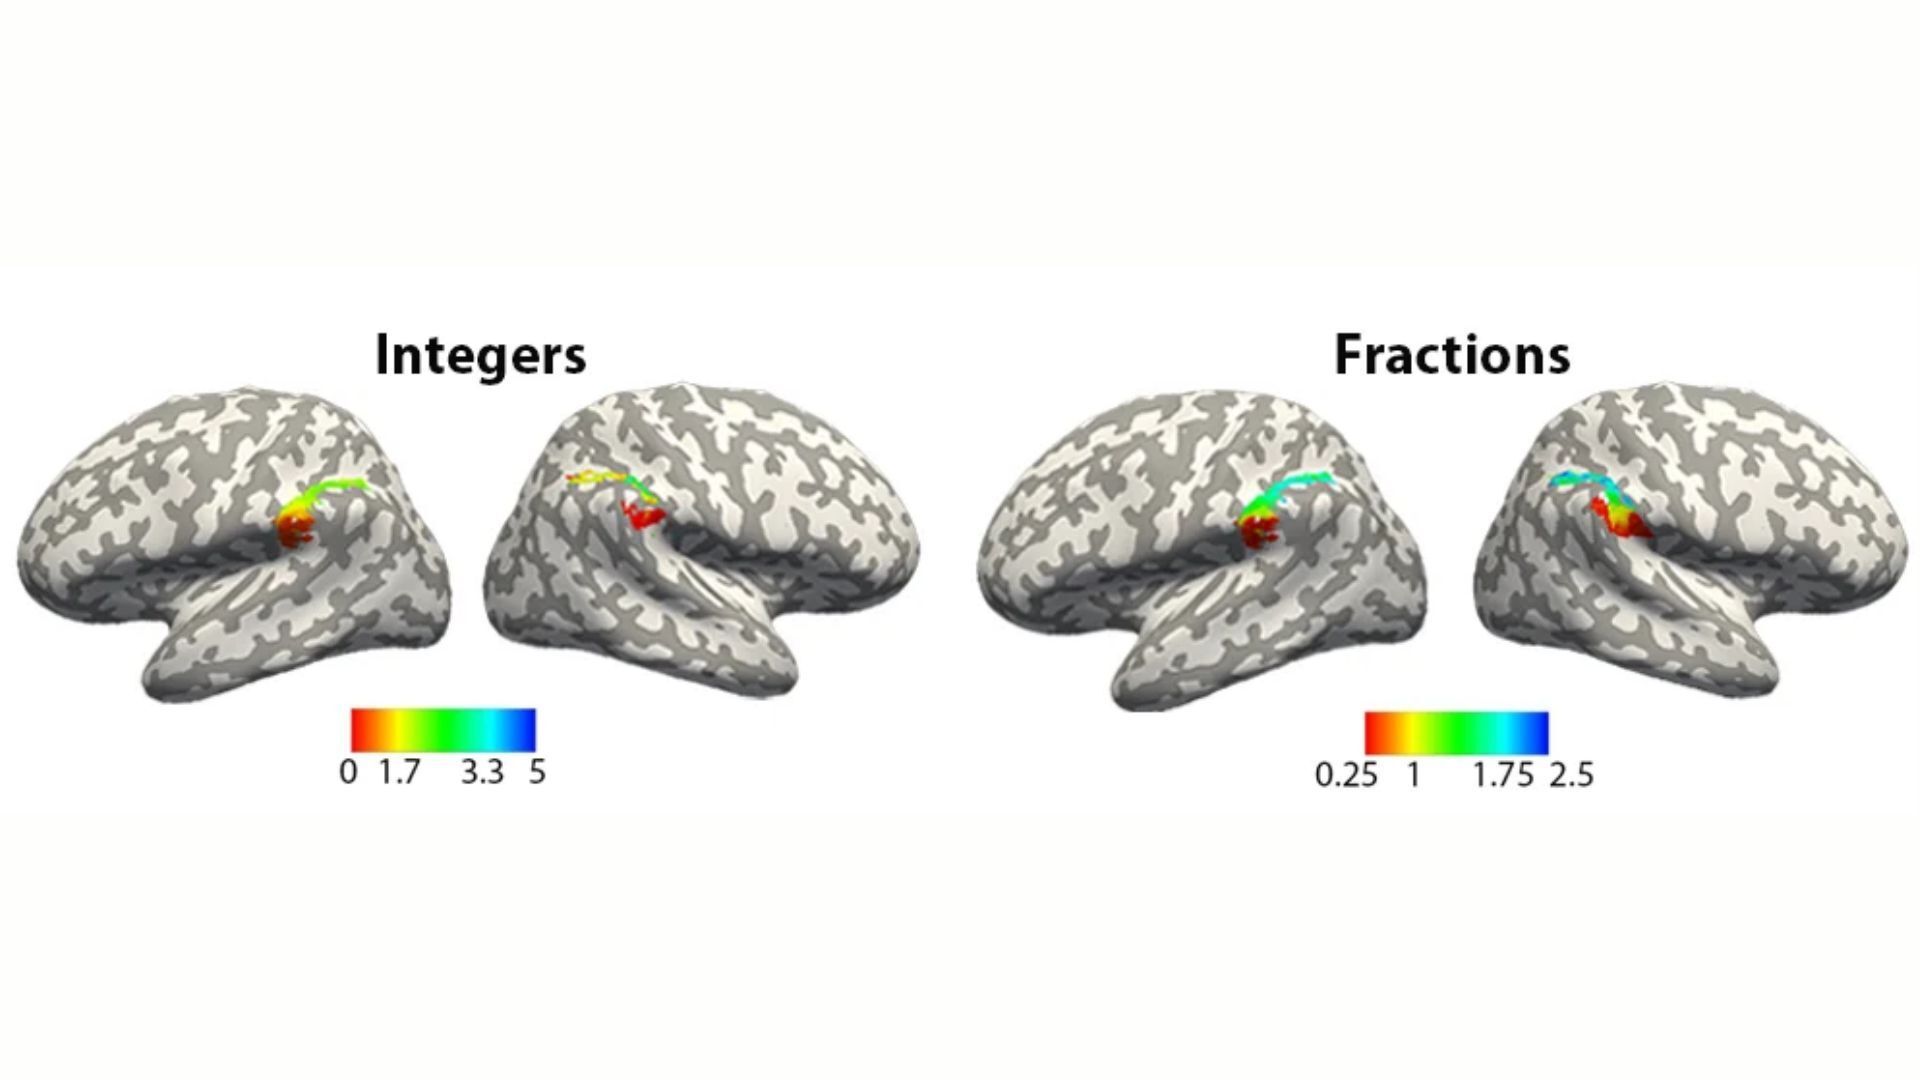
Average brain activity across participants: smaller numbers in red, larger in blue, with fractions and integers on one gradient.
The finding
Neuroscientists in France report that the brain keeps whole numbers and fractions on one shared mental "number line," ordered by size. The study was led by Daniela Valério and Stanislas Dehaene at 1, the INSERM-CEA Cognitive Neuroimaging Unit, and published on 22 October in the peer-reviewed journal 2.
Why fractions were the open question
Scientists have long known that the 3, near the top and back of the brain, represents numerical size. But most of that work covered whole numbers. Fractions are harder to explain. The symbol "¼" contains a 4, yet its value sits near zero. To place it correctly, the brain has to work out a relationship between two numbers, not just read a digit.
Earlier studies had shown that fractions and whole numbers activate overlapping brain areas. Overlap alone doesn't reveal whether the two are coded in one system or in two. The authors say theirs is the first study to look at the 4 of these representations, meaning how the activity patterns for different values relate to each other, in a task mixing both kinds of number.
What they did
Twenty adults, all native French speakers, lay in a high-resolution 5 scanner. Functional magnetic resonance imaging tracks blood flow as an indirect measure of brain activity. Participants saw a mix of fractions and whole numbers and judged whether each was bigger or smaller than the one before.
The team focused on the 6, a region already known to be key for number processing.
What they found
Activity there formed an organized gradient resembling a number line, with smaller values at one end and larger values at the other. Fractions and whole numbers sat along the same line, placed by their value rather than their digits. "The activity patterns reflected that numerical relationship, going beyond the digits themselves," said Abiot Derbie, an independent cognitive neuroscientist.
As expected, participants were slower and made more errors with fractions.
Caveats
The study doesn't explain why fractions are harder. "Our study was not designed to explain why fractions are harder to learn or understand," Valério and Dehaene said. The sample was small and culturally uniform: 20 French-speaking adults. Children, other languages and decimals weren't tested. Derbie suggests scanning children before and after they learn fractions, to see whether the map changes as their understanding improves.
The finding
Researchers at 1, the INSERM-CEA Cognitive Neuroimaging Unit in France, report that the human brain stores whole numbers and fractions on one shared "number line." Each value has its own coordinates, and they are ordered by size. The study, led by postdoctoral researcher Daniela Valério with unit director Stanislas Dehaene, was published on 22 October in the peer-reviewed journal 2.
"What is fascinating is that the brain can bring together numbers that look very different, such as integers and fractions, within a common system," the two authors told Live Science.
The problem
That the 3 represents numerical magnitude is old news. Neuroscientists had a fairly good picture of how the brain handles whole numbers, but not fractions. Fractions pose a hard question for any theory of a mental number line. The symbol "¼" contains a 4, yet its value sits close to zero, below 1. If the brain simply responded to the digits it sees, ¼ would land near 4. To place it correctly, the brain has to compute a relationship between two numbers and turn that into a single quantity.
Earlier studies had shown that fractions and whole numbers activate overlapping parts of the brain's number network. Overlapping activity doesn't tell you much on its own, though. Two kinds of number could use the same patch of cortex while being coded in entirely separate ways within it. What was missing was the 4: how the activity patterns for different values relate to one another. The authors say theirs is, as far as they know, the first study to look at that geometry in a task that mixes integers and fractions.
What they did
Twenty adults, all native French speakers, lay in a high-resolution 5 scanner. Functional magnetic resonance imaging tracks blood flow as an indirect measure of neural activity. Participants saw a stream of numbers, some whole and some fractions, and had to judge whether each one was bigger or smaller than the one before.
The researchers focused on the 6, a front-lower part of the parietal lobe already known to be central to number processing. Rather than asking only whether the region was active, they looked at how its activity was spatially patterned for each value.
The article doesn't detail the analysis pipeline. Studies of "representational geometry" generally compare the activity pattern evoked by each stimulus with every other one. If patterns for numbers close in value look alike, and patterns for distant numbers look different, then the region is coding magnitude.
What they found
In this region the activity formed an organized gradient, like a number line. The published figure, averaged across participants, shows smaller values in reddish hues and larger values in bluish hues. Crucially, fractions and whole numbers fell along the same gradient according to their size. They were not split into two separate maps.
Abiot Derbie, a cognitive neuroscientist not involved in the research, put it in terms of the ¼ example: "The activity patterns reflected that numerical relationship, going beyond the digits themselves." For him the result is about "how the brain gets from a symbol to its meaning." In other words, the brain's representation tracks quantity, not notation.
An analogy, offered here for illustration and not taken from the study: picture a ruler. Whether you write a point on it as "0.25", "¼" or "a quarter", it's the same tick mark. The study suggests the parietal cortex works more like the ruler than like a dictionary of symbols.
The behaviour matched what researchers already expected. Participants were slower and made more mistakes when comparing fractions than whole numbers. The article doesn't give the exact figures.
What it doesn't show
The authors are explicit about the limits. "Our study was not designed to explain why fractions are harder to learn or understand," Valério and Dehaene said. The shared map exists, but the data don't reveal why fractions take longer to place on it. One unanswered possibility is that the brain needs extra steps to compute a fraction's value before it can slot it onto the line, but the study doesn't test this.
Other caveats:
Small, uniform sample. Twenty adults, all native French speakers. The result may not hold across languages, cultures, ages or levels of maths education.
Adults only. The study captures a mature, trained system. It says nothing about how the map forms.
Limited number types. Only integers and fractions were tested. The authors suggest decimals as a next step.
fMRI is indirect. Blood-flow signals average over many neurons, so the "line" describes population-level patterns, not individual cells.
What comes next
Derbie would like to see the map tracked as it develops. One design would scan children before and after they are taught fractions, to see whether changes in brain activity go along with better understanding. That would start to link the neural geometry to learning, and possibly to the long-standing difficulty children have with fractions. For now the study answers a narrower question cleanly: in this number region, the adult brain files ¼ and 3 by how big they are, on one common scale.
Remember
The brain files numbers by the quantity they stand for, not by how they are written.
Overlapping brain activity isn't enough evidence of a shared code; this study examined how the activity patterns were arranged.
Why fractions are harder remains unexplained; the study tested only 20 French-speaking adults.
Artist's view of two black holes merging; uneven gravitational waves from the merger can kick the remnant off-centre.1 / 2
A team led by Bence Bécsy of the University of Birmingham has found statistical evidence that some giant black holes have been knocked away from the centres of their galaxies. The study, published in the peer-reviewed Monthly Notices of the Royal Astronomical Society, doesn't identify any single ejected black hole. It finds a pattern across about 100,000 1 that matches what theory predicts.
The prediction
When two 2 merge, they give off 3. If those waves come out unevenly, the merged black hole recoils at roughly 100 to 1,000 km/s (360,000 to 3.6 million km/h). That is usually too slow to escape the galaxy, so the black hole swings back and forth through the centre like a pendulum. It moves fastest as it passes the centre and slowest at the ends of each swing. It can also keep the inner part of its 4, the swirl of hot gas feeding it, and shine as a quasar for 10–100 million years.
Two clues in the light
The team used the quasar catalogue from the 16th data release of the 5 (SDSS) and measured two things for each quasar.
Speed. Gas close to the black hole, called the 6, travels with it. Gas farther out, the 7, stays with the host galaxy. The 8 between the two sets of spectral lines gives the black hole's speed along our line of sight.
Dust. Dust absorbs blue light more than red, so a quasar behind more dust looks redder than similar quasars. Astronomers call this .
Dust is thickest near the galactic centre, which is also where a swinging black hole moves fastest. If recoils are real, the faster-moving quasars should be the dustier ones.
The result
They are. Quasars in the fastest group were three times as likely to be dust-obscured as those in the slowest.
The authors don't claim proof. Bécsy says single quasars are hard to judge "because other phenomena can produce similar signatures." The paper notes that gas winds, the angle we view a quasar from, or other effects could produce the same correlation. The article doesn't say how strong the statistical significance is.
What would settle it
10 (Laser Interferometer Space Antenna), a planned trio of spacecraft that will detect gravitational waves from black hole mergers, is due to launch in 2035. Co-author Zsolt Frei says that if the signal comes from recoils, recent mergers sit behind a significant share of quasars. That would directly set how many merger events LISA can expect to catch.
Astronomers have looked for runaway black holes for about two decades without finding one beyond doubt. A new study takes a different approach. It doesn't try to prove that any single black hole was kicked. It asks whether a whole population of 1 carries the statistical fingerprint of kicks. In a paper in the peer-reviewed Monthly Notices of the Royal Astronomical Society, a team led by Bence Bécsy of the University of Birmingham reports that it does: among about 100,000 quasars, the faster the black hole moves relative to its host galaxy, the more likely it is to be hidden behind dust.
The prediction: a kick, then a pendulum
Large galaxies host 2, with millions to billions of times the Sun's mass, at their centres. When galaxies merge, their black holes eventually spiral together and merge too, releasing a burst of 3. The authors note that many such pairs should be observable by 4 in the millihertz frequency band, the range of slow gravitational-wave signals that giant black hole pairs produce.
The new ingredient is asymmetry. If the waves carry more momentum in one direction than another (they are not isotropic, or equal in all directions), the merged black hole recoils the other way. The predicted speeds run from about 360,000 to 3.6 million km/h, or roughly 100 to 1,000 km/s. That is usually not enough to escape the galaxy. Instead the black hole oscillates through the centre like a pendulum.
The key detail is that its speed changes along each swing. A pendulum bob moves fastest at the bottom of its arc and pauses at the ends. In the same way, a recoiling black hole moves fastest as it crosses the galactic centre and slowest at its farthest point.
The black hole doesn't go dark either. The authors expect it can keep the inner part of its 5, the hot, spiralling gas that feeds it, and stay active for 10 to 100 million years. During that time it can appear as a quasar, the brightest kind of active galactic nucleus (a black hole that is feeding heavily). Because quasars are so bright, they are easy to find in large surveys.
Why individual candidates fail
Researchers have flagged individual quasars as possible recoiling black holes before. Each time, another explanation fit too. A black hole that looks displaced might be one of a pair still orbiting each other. Odd spectral lines might come from gas flows. Bécsy puts it plainly: "It is very difficult to prove that the black hole in a single quasar has been ejected, because other phenomena can produce similar signatures." The new work looks instead for a trend that only shows up across many objects.
Measuring speed from two gas clouds
The team worked from the quasar catalogue in the 16th data release of the 6 (SDSS), a long-running project that has mapped and taken spectra of millions of objects. Each quasar's light carries two clues.
Speed. A quasar's spectrum shows emission lines from two regions of gas. The 7 is fast-moving gas close to the black hole. It is gravitationally bound, so it travels with the black hole. The 8 is slower gas farther out. It stays behind with the host galaxy and the dusty torus (a doughnut of gas and dust) at the galactic centre. The authors' working assumption is exactly this split: the broad lines follow the black hole, and the narrow lines record the galaxy's own redshift.
If the black hole is moving toward or away from us, its broad lines are Doppler-shifted (stretched or squeezed in wavelength) relative to the narrow lines. The size of that offset gives the black hole's speed along our line of sight. For example, with illustrative numbers: if the narrow lines put the galaxy at one redshift and the broad lines sit 500 km/s redward of it, the black hole is moving away from us at about 500 km/s relative to its host. Only the line-of-sight part of the motion can be measured, not sideways motion.
Dust. Dust scatters and absorbs blue light more than red, so a quasar seen through more dust looks redder than comparable quasars. Astronomers call this dimming 9 and can measure it from spectra and from brightness in different colour filters (photometry).
The test
Put the two clues together. Dust is densest near the galactic centre. Under the pendulum picture, that is also where a recoiling black hole moves fastest. So a large velocity offset should tend to come with heavy dust obscuration, and a small offset with a clearer view. The authors searched for exactly this "positive correlation between dust obscuration and the magnitude of the line-of-sight velocity offset."
What they found
The correlation is there. Grouping quasars by velocity offset, the fastest group shows three times the obscured fraction of the slowest. Bécsy calls it "a relationship consistent with theoretical predictions."
The article doesn't give the statistical significance of the trend, the size of each velocity group, or how "obscured" was defined. Readers wanting those details would need the paper itself.
The caveats
The authors are careful: "While the correlation we find might be evidence for a population of recoiling SMBHs, alternative explanations are possible." Two are named.
Winds. Outflows of gas driven by the quasar could shift the broad lines and also sweep up or sit alongside dust, linking speed and reddening without any recoil.
Viewing angle. How we see a quasar relative to its dusty torus affects both how much dust lies in the way and which gas motions we see. That alone could tie the two quantities together.
A correlation also says nothing about which quasars are recoiling. Even if recoils drive the trend, many fast, dusty quasars may be ordinary.
What comes next
A more direct test should come from LISA, the Laser Interferometer Space Antenna, a European Space Agency mission planned for 2035. It will use three spacecraft orbiting the Sun in a triangle, with laser beams between them, to detect gravitational waves from merging giant black holes.
Co-author Zsolt Frei, who heads the HUN-REN–ELTE Extragalactic Astrophysics Research Group, explains why the quasar result matters for LISA. If the signal is caused by ejected black holes, then two supermassive black holes merged relatively recently in a significant share of quasars, so such mergers are common. "This directly determines how many such events LISA may be able to detect." For now, the result shows a pattern that fits the recoil prediction but does not yet confirm it.
Remember
The method finds a pattern across a population, avoiding the doubts that have sunk every individual recoil candidate.
Recoiling black holes move fastest at the galactic centre, where dust is thickest, so speed and reddening should rise together.
Gas winds or viewing angle could produce the same correlation, so recoils remain likely but unproven.
Van Gogh's "The Starry Night," whose swirling stars the team matches to the Hyades cluster in Taurus.
Vincent van Gogh's "The Starry Night" may show a real sky: the view just before dawn over Saint-Rémy-de-Provence, France, on July 22, 1889. Astronomer Elijah Jeong-hyun Kim and colleagues reported the date on October 22 in the peer-reviewed journal 1. "How could an invented sky fit the sky of a particular date this closely?" they write.
The puzzle
Art historians date the painting to mid-June 1889. Around June 18, van Gogh wrote to his brother Theo about "a new study of a starry sky." Soon afterward an illness kept him from painting for about six weeks. In the 1980s, two astronomers tried to match the painting to mid-June skies and disagreed. One read the swirling stars as the constellation 2 on June 19. The other pointed to cloudy weather reports from 70 kilometers away and called the scene a composite.
A fresh start
Kim runs a telescope-building company in Seoul and didn't know about the June date, so he started without it. He doubted the Aries reading because those stars are too faint before dawn to inspire a painter. He thought the stars looked like the 3, a cluster whose stars form a sideways V in Taurus.
To test this, the team used 4. The method slides, rotates and resizes one set of points to fit another as closely as possible, then scores whatever mismatch remains. The real Hyades and the painted stars don't overlap perfectly, but they come close. For a benchmark, the team scored "Starry Night Over the Rhône," which clearly shows the Big Dipper. The two paintings matched their skies about equally well.
The moon and Venus narrowed the date further. On June 19 the moon was a 5 (more than half lit and growing). The painting shows a thin 6. Modern simulations placed the moon, the Hyades and Venus for any second in 1889, and July 22 fit best. Kim also went to Saint-Rémy in 2019, found what he believes was van Gogh's view, and found that it lined up with the drawing.
The objection
Donald Olson of Texas State University, who studies astronomy in art, says the claim depends on a narrow 7. That narrow view lets the Hyades fill most of the canvas. But it doesn't fit the much wider view needed to take in the painting's hills and cliffs. He suggests a test: ask amateur astronomers to find 8, the brightest star in the Hyades. He predicts they won't pick either of the two faint stars left of the cypress tree, which is where the authors place it.
The article doesn't explain how a July 22 date fits with the June letter or the six-week illness.
Vincent van Gogh's "The Starry Night" may record one particular sky: the view before dawn over Saint-Rémy-de-Provence, France, on July 22, 1889. Astronomer Elijah Jeong-hyun Kim and colleagues published the claim on October 22 in 1, a peer-reviewed journal. If they are right, the painting's swirling stars came from observation, not only from imagination. "Observation and imagination have commonly been treated as an either/or," the team writes, "yet 'The Starry Night' shows the two coexisting on one canvas."
Why the date has been hard to pin down
Van Gogh admitted himself to a hospital in Saint-Rémy in May 1889. "The Starry Night" is thought to show the view from his window there. Art historians date the painting to mid-June, mostly because of a letter to his brother Theo written on or about June 18: "At last I have a landscape with olive trees, and also a new study of a starry sky." A short time later an illness kept him from painting for about six weeks. That seemed to rule out any date after the episode began.
Donald Olson, an astronomer at Texas State University in San Marcos who has written widely on astronomy in art, says historians favor June because "van Gogh himself said so."
Fixing the date in June has not settled the sky. In the 1980s, two astronomers tried to match the painting to mid-June skies over Saint-Rémy and came to opposite conclusions. One proposed June 19, 1889, and read the cluster of swirling stars as the constellation 2. The other cited cloudy weather reports from Aix-en-Provence, about 70 kilometers away, and argued the painting couldn't show June 19. That study called the scene "a celestial composite, constructed to make an image of the morning sky."
A new reading: the 3
Kim founded SLLAB Inc., a telescope-building company in Seoul. He became interested in the painting without knowing the June date. "Unlike previous astronomical studies, we could start freely," he says. His job gave him a working memory of the sky. "People like me, who guide a telescope through its first alignment with the sky, naturally memorize where the stars are."
He doubted the Aries reading because its stars would be too faint in a predawn sky, "hardly enough to inspire a painter." Instead he saw the Hyades. This star cluster forms a sideways V that makes the bull's face in the constellation Taurus. Its brightest star, 4, sits at the V's lower left.
How the shape test works
Seeing a constellation in a painting is subjective, so the team wanted a number. They used 5, a standard statistical method for comparing two sets of points. It strips out every difference that isn't about shape:
Translation: both point sets are moved so their centers line up.
Scale: both are resized to a common overall size.
Rotation: one is turned until it lines up as closely as possible with the other.
Whatever mismatch remains between matching points becomes the score. A low score means the shapes match well.
A simple illustration (not from the paper): draw a triangle small and tilted on one page, and the same triangle large and upright on another. Procrustes analysis would score them as a near-perfect match, because only position, size and angle differ. A truly different triangle would still leave gaps after the best fit.
Applied to the painting, this produced the figure the article describes. The real Hyades stars (blue) and the painted stars (orange) don't overlap perfectly, but the researchers call them "suspiciously close."
Any such score needs a reference point: how close is close enough? The team tested the method on another van Gogh night scene, "Starry Night Over the Rhône," which plainly shows the Big Dipper. "Apart from the Big Dipper, there is no star pattern we can say for certain that Vincent painted," Kim says. The two paintings matched their proposed star patterns to a similar degree, which the team treats as a major clue. Their reasoning is that if a known, deliberate depiction scores about the same, the Hyades match is probably not a coincidence.
From constellation to calendar date
A star pattern alone doesn't give a date, because the Hyades rise before dawn on many mornings. The team added two more objects.
The moon. The painting shows a thin 6, the shrinking sliver seen in the east before sunrise. On June 19, 1889, the moon was a 7: more than half lit and growing. That alone works against the June 19 date proposed in the 1980s.
Venus. Its position adds a further constraint.
The team used computer simulations that weren't available in the 1980s to compute where these objects stood over Saint-Rémy on dates in 1889, down to the second. July 22, 1889, fit best.
Kim also tested the geometry on site. In June and July 2019 he traveled to France to find the 8 van Gogh would have had from his window. "I still cannot forget the moment we finally found the spot, overlaid the drawing on the view and saw it fit perfectly," he says. The moon, the Hyades and Venus of July 22, 1889, he says, "fit exactly within the drawing's field of view." The article doesn't say which drawing he means, whether the painting itself or a related sketch.
The case against
Olson's main objection is about the field of view, meaning how much of the sky the canvas covers. The authors' theory requires a narrow view so that the small Hyades cluster can fill most of the canvas. Olson says that is "inconsistent with the much wider field of view required to encompass 'The Starry Night's' round hills and cliffs." If the landscape requires a wide-angle view, the stars should look smaller and more spread out, and the match weakens.
He proposes a test. Tell an amateur astronomer that the painting shows the Hyades and ask them to find Aldebaran. In the real sky Aldebaran is the cluster's brightest star, so it should be the obvious choice. But the painting has other, much more prominent stars. Kim's team places Aldebaran as one of the two stars left of the cypress tree. Olson predicts that an experienced amateur, even when told to look for the Hyades, would not pick either of them.
What remains open
The historical record. The article doesn't explain how a July 22 date fits with the June 18 letter or the six-week break in painting. One possibility is that the painting drew on a sky seen later than the letter, or on more than one session. The article doesn't say whether the authors make that argument.
Sensitivity to assumptions. The Procrustes score depends on which painted stars are paired with which real stars, and the field-of-view dispute goes to exactly that pairing. The article doesn't report how the result changes under Olson's wider view.
Weather. Cloud records helped sink the June 19 theory. The article doesn't say whether conditions on July 22 were checked.
The study passed peer review. Still, its central match rests on interpretive choices that an expert in the field openly disputes, so it is better read as a strong argument than a closed case.
Remember
The moon's phase does real work: the painting's waning crescent rules out the June 19 date proposed in the 1980s.
A shape-match score needs a benchmark. Here it was "Starry Night Over the Rhône," which clearly shows the Big Dipper.
The match depends on an assumed narrow field of view, which an expert says conflicts with the painting's wide landscape.
Aquifers fill slowly, partly from snowmelt soaking into the ground. In a drought, farms and cities pump more groundwater to replace the river water they lose. That pumping draws down a reserve that can take decades to refill.
U.S. Geological Survey map of the Colorado River Basin's Upper and Lower halves, whose groundwater losses the study compares.
The four Colorado River states long considered drought-resilient (Colorado, Utah, Wyoming and New Mexico) lost almost twice as much groundwater as their downstream neighbors in the 2020–2022 drought. The finding comes from a peer-reviewed study published October 13 in Water Resources Research.
The expectation it overturns
The river is managed as two halves. The 1 gets heavy Rocky Mountain snow. The 2 (Arizona, Nevada and California) is hotter, gets less rain and snow to refill its 3, and is home to about 30 million of the 40 million people who depend on the river. Everything pointed to the Lower Basin losing groundwater faster.
Instead, during the drought the Upper Basin lost about 17.5 cubic kilometers of groundwater and the Lower Basin about 9.4. "We should not assume that the Upper Basin will remain relatively resilient," said first author Esther Oyedele of Virginia Tech.
How they measured it
The team used the 4 satellites (Gravity Recovery and Climate Experiment) and their successor, 5. These track small changes in Earth's gravity as water mass comes and goes. GRACE senses all water at once, so the researchers subtracted separate estimates of snow, soil moisture and surface water to isolate groundwater. They did this from 2004 to 2023.
Over those 20 years the basin lost about 58.3 cubic kilometers of groundwater. Losses sped up from 2019, mainly because the drought shrank the snowpack, raised evaporation and increased demand.
Why the Upper Basin was hit harder is unresolved. Oyedele suggests two possibilities. Its aquifers depend on mountain snowmelt, which was scarce. And it had stored more water during earlier wet years, so it had more to lose.
Two basins, two patterns
The researchers then compared groundwater with river and reservoir levels over time. In the Upper Basin, groundwater followed surface water with a short delay: rivers dropped, less water soaked in, pumping rose, and aquifers fell. In the Lower Basin, groundwater sometimes fell before surface water did. Oyedele reads this as steady overuse, with aquifers drawn down regardless of how the river is doing. That is an interpretation of a statistical pattern, not a direct measurement of pumping.
Caveats
The Upper-versus-Lower comparison rests on a single three-year drought. Whether the pattern continues is unknown. GRACE's coarse resolution also gives basin-wide totals, not which aquifers are being drained.
The stakes are clear, though. Warming and a 1922 agreement that promised more water than the river carries have cut the Colorado's flow to 35% below its 20th-century average. Oyedele argues that groundwater and rivers should be managed as one connected system, and that groundwater should not be treated as an unlimited backup.
The usual picture of drought on the Colorado River has two halves. The 1 (Colorado, Utah, Wyoming and New Mexico) gets snow from the Rocky Mountains and has been treated as the resilient half. The 2 (Arizona, Nevada and California) is hotter and drier, and it has most of the demand. A new peer-reviewed study in Water Resources Research, published October 13, finds that this picture was backwards for groundwater during the severe 2020–2022 drought.
In those three years the Upper Basin lost about 17.5 cubic kilometers (4.2 cubic miles) of groundwater. The Lower Basin lost about 9.4 cubic kilometers (2.3 cubic miles). The upper states lost almost twice as much. "We should not assume that the Upper Basin will remain relatively resilient simply because it has historically received more precipitation and snowmelt," said first author Esther Oyedele, a geosciences doctoral student at Virginia Tech.
Why the result was unexpected
On paper, the Lower Basin should be the more vulnerable half. It gets less rain and snow, so its 3 receive less 4, the water that seeps down to refill them. Evaporation is higher there. About 30 million of the 40 million people who rely on the Colorado River live in the Lower Basin. All three factors point to faster groundwater loss in the south.
The pressure on the whole system is severe. The 1922 5 divided more water than the river reliably carries. Combined with warming, that has left the river's flow 35% below its 20th-century average. According to the article, Lake Mead and Lake Powell, the two largest US reservoirs, fell to record lows in August.
How you measure groundwater from space
Groundwater is hard to measure directly across a basin this size, because wells are scattered and unevenly monitored. The team instead used the 6 mission (Gravity Recovery and Climate Experiment) and its successor, 7. Each consists of a pair of satellites flying in tandem. The distance between the two shifts very slightly as they pass over regions of stronger or weaker gravity. Water is heavy, so when a region loses water, its pull weakens a little and the satellites register it.
The problem is that GRACE only senses total water: snow, soil moisture, lakes, reservoirs and aquifers together. To isolate groundwater, researchers subtract the other parts using separate data sets. The study combined GRACE with measurements of surface water, soil moisture and snow-water storage, covering 2004 to 2023. A simple bookkeeping example, with made-up numbers: if a region's total water falls by 10 units, and snow, soil and reservoirs together account for 6, the remaining 4 is attributed to groundwater. The groundwater figure is therefore a residual, and any errors in the other terms carry into it. That is a general limit of the method, not something the article discusses.
What the record shows
Over the full 20 years the basin lost about 58.3 cubic kilometers (14 cubic miles) of groundwater. The article equates that to 25 million Olympic swimming pools. Depletion was steady throughout the period but sped up from 2019. Oyedele names the 2020–2022 drought as the main cause. It shrank the Rocky Mountain snowpack, raised evaporation and increased water demand.
The researchers don't know why the Upper Basin fared worse, but Oyedele offers two possible reasons. First, the upper states depend on mountain snowmelt to recharge their aquifers, so thin snow years hit them directly. Second, the Upper Basin had taken in more recharge during the wet years before the drought. With more groundwater in storage at the start, it had more to lose. Both are hypotheses, not findings.
Two different relationships with the river
The team then used statistical methods, which the article does not name, to compare groundwater and surface water over time. The two basins behaved differently.
In the Upper Basin, groundwater followed surface water in the same direction with a short delay. That fits a simple sequence: drought lowers rivers and reservoirs, less water soaks in, people pump more, and aquifers drop shortly after.
In the Lower Basin the link was weaker and messier. At times groundwater fell before surface water did. If aquifers were only reacting to low rivers, that shouldn't happen. Oyedele's reading is that Lower Basin groundwater is being overused all the time, not just during shortages. "Human water use, particularly sustained groundwater extraction, may also play a significant role," she said. This is her interpretation of a statistical pattern. The article presents no pumping records that would confirm it directly.
Caveats and open questions
Short window. The headline comparison rests on one three-year drought. Whether the Upper Basin will keep losing more groundwater than the Lower Basin is, in Oyedele's words, hard to tell.
Coarse resolution. GRACE can only resolve regions several hundred kilometers across, which suits basin-wide totals. It can't show which aquifers or irrigation districts are driving the losses. (This is general knowledge about the mission, not stated in the article.)
Causes not pinned down. The explanations for the Upper Basin's larger loss, snowmelt dependence and a larger starting store, are offered as possibilities and were not tested.
The future. Oyedele expects warming, shrinking snowpack, prolonged drought and rising demand to put more pressure on aquifers in both basins. How they actually respond will depend on precipitation, snowmelt, water use and management choices.
The management argument
Oyedele argues that groundwater and surface water should be managed as one system, not two. Aquifers help keep rivers flowing, and rivers help refill aquifers. In the Colorado Basin, groundwater is often the backup supply during drought, and she says it shouldn't be treated as unlimited. The finding comes as negotiations among the seven basin states over sharing the river have stalled, according to a related Live Science report.
Remember
The basin lost about 58.3 cubic kilometers of groundwater from 2004 to 2023, and losses sped up after 2019.
In the Lower Basin, groundwater sometimes fell before rivers did, which points to steady overuse, not just a reaction to drought.
Satellites can't see groundwater directly; the figure is what remains after subtracting snow, soil moisture and surface water.
Paper's illustration of the sequence: early clearing lets ionizing light escape, then supernova-driven winds smother it.1 / 2
Astronomers have tested a common explanation for how the first galaxies made the Universe transparent, and it held up only briefly. A study in Nature Astronomy led by Cody Carr (now at the University of Michigan) reports that supernovae helped ionizing light escape galaxies for a short time. After that, they mostly blocked it.
The question
During the 1, the first billion years or so after the Big Bang, ultraviolet light from early galaxies stripped the electrons from the neutral hydrogen that filled space. The relevant light is 2 radiation, photons energetic enough to ionize hydrogen. Early compact, star-forming galaxies made plenty of it. The open question is how much got out, because a galaxy's own gas and dust absorb these photons. A popular answer is that supernova-driven winds carve low-density channels through that gas. Cosmological simulations rely heavily on this idea.
How they tested it
The early galaxies themselves can't be studied in this detail, so the team used six nearby star-forming galaxies that closely resemble them. The six were similar except for the age of their starburst, which let the researchers watch a sequence over time. Using Hubble spectra, they followed individual spectral lines to trace a 3, meaning outflowing gas at several temperatures and ionization states. They compared that with how much LyC light each galaxy actually leaked.
What they found
Earliest stage: radiation and stellar winds from young, massive stars, possibly helped by a few very early supernovae, push out the first gas. Clumping leaves clear paths with little dust or neutral gas, and LyC escape is at its highest.
As supernovae pile up: they still punch holes in dense clouds, but they also load the wind with neutral gas, create dust, and spread the outflow sideways. On average, escape drops.
Later: large supernova-driven winds shut LyC escape off completely.
"Basically, how these galaxies were leaking ionizing radiation isn't what we thought," Carr said. Senior author Stephan McCandliss of Johns Hopkins said supernova energy "stirred up the surroundings" and increased the cover of light-blocking gas.
Caveats
The sample is six nearby stand-in galaxies, not true early-Universe objects. The result conflicts with simulations, so the case is not settled. Co-author Renyue Cen argues that models now need to capture how young stars shape their surroundings before the first supernovae go off.
A study published in Nature Astronomy challenges a common account of how the infant Universe became transparent. Lead author Cody Carr did the work as a postdoctoral researcher at Zhejiang University in China and is now an Extremely Large Telescope Fellow at the University of Michigan. He and his colleagues used the Hubble Space Telescope to examine galaxies that resemble those of the early cosmos. They found that supernovae helped ionizing light escape galaxies only for a short time and then mostly got in its way. The team says that young stars, not exploding ones, did the early leaking.
The problem: making light, then getting it out
The 1 is the period when ultraviolet light stripped electrons from the neutral hydrogen that had filled the cosmos since it cooled. It ended within roughly the first billion years after the Big Bang, and afterward light could travel freely through intergalactic space. Carr calls it "the last major phase transition of the universe." Astronomers know it happened. They don't know which sources did most of the work or how the process unfolded.
The radiation in question is 2 light, with wavelengths shorter than 912 ångströms (91.2 nanometres). That is energetic enough to knock the electron off a hydrogen atom. The authors note that the early Universe had many UV-bright, compact star-forming galaxies, and their massive stars alone could have produced enough LyC to reionize the 3, the thin gas between galaxies. Production isn't the hard part. These photons are absorbed by the same neutral hydrogen and dust they are meant to ionize, starting with the gas inside their own galaxy. What matters is the 4, the share of LyC photons that actually leave. The authors write that it is uncertain how efficiently LyC escapes, and how radiation, stellar winds and supernovae each regulate that escape.
A leading idea is that supernovae open the doors. A supernova is enormously energetic, though most of its own light is optical rather than ionizing. Its blast and the winds it drives could clear low-density channels through a galaxy's gas, and LyC from hot young stars could then stream out through them. The article says cosmological hydrodynamic simulations, which model gas, gravity and radiation together, give supernovae a central role in this escape.
The method: a time series built from six galaxies
Galaxies from the reionization era are too distant to study this way, so the team used nearby proxies. These are local compact star-forming galaxies that closely resemble early ones. The team took medium-resolution Hubble spectra of six of them. The six were "otherwise similar" but spanned a range of 5, the time since their intense burst of star formation began.
That choice is the core of the method. No one can watch a single galaxy evolve over millions of years. Lining up similar galaxies caught at different ages works roughly like a set of snapshots of one process. (This is an analogy; each galaxy is a separate object, and the method assumes they would follow the same path.)
In each spectrum, the researchers traced the launch of a 6, an outflow carrying gas at several temperatures and ionization states at once, using individual absorption and emission lines. They then compared the state of the wind with each galaxy's measured LyC escape fraction. This links the physical condition of the outflowing gas directly to how much ionizing light gets out.
The results: a three-stage sequence
The data point to a sequence, which the paper's illustration shows as panels:
Youngest starbursts. Intense radiation and fast stellar winds from massive young stars drive a slow, volume-filling outflow, possibly with help from a few early supernovae from the most massive stars. That outflow pushes out the first material from the 7, the gas and dust between a galaxy's stars. Gas clumps into dense knots and leaves low-density paths with little dust or neutral gas between them. The authors call these "optimal conditions for LyC escape," and escape is fastest here.
Senior author Stephan McCandliss, director of the Center for Astrophysical Sciences at Johns Hopkins University, summarized it this way: supernova energy "stirred up the surroundings and increased, rather than decreased, the coverage of neutral gas and dust that suppresses ionizing radiation escape."
The authors conclude that young stars pushed ionizing radiation out of these galaxies before many supernovae had time to explode. "Basically, how these galaxies were leaking ionizing radiation isn't what we thought," Carr said. The article reports no specific escape-fraction values or starburst ages.
Why it conflicts with simulations
The result cuts against the simulations that give supernovae a leading role. The article's view is that observations should outrank models. Renyue Cen, a senior author who directs the Center for Cosmology and Computational Astrophysics at Zhejiang University, frames it as a modeling gap: "Our findings highlight the need to examine how radiation and winds from young stars shape the surrounding gas before the first supernovae explode." So the claim is not that the simulations' physics is wrong. It is that they may get the timing and balance of feedback wrong, overweighting supernovae and underweighting what happens in a starburst's first few million years.
What remains open
Sample size. Six galaxies is a small number for a sequence with three stages. More objects, especially at the youngest and oldest ages, would test whether the pattern holds.
Proxies. Local analogues resemble early galaxies but are not the same objects. Early galaxies had fewer heavy elements and probably different dust, and both affect how much light gets absorbed.
Total budget. The study looks at how escape changes inside individual galaxies. It does not by itself say how much of reionization these compact starbursts accounted for overall, compared with other sources such as the quasars and active galactic nuclei the article mentions.
Missing numbers. The article gives no figures for escape fractions or starburst ages, so readers can't judge how sharp the drop is from this report alone.
The finding is peer-reviewed, but it is one observational study set against a broad body of simulation work. A natural next test is to look at genuine reionization-era galaxies with telescopes such as the James Webb Space Telescope.
Remember
Ionizing light escaped most easily early on, when young massive stars had cleared gas but few supernovae had exploded.
Supernovae carve channels but also add neutral gas and dust, lowering the average escape of ionizing light.
The evidence is six nearby stand-in galaxies, which conflicts with simulations that give supernovae a central role.
Supernovae accumulate. More stars explode. The supernovae "likely destroy dense clouds and carve out lower channels," as the theory predicts. They also add neutral mass to the outflow (called 8), create dust, and spread the wind sideways so it covers more of the galaxy. The net effect is a lower average escape fraction.
Later. As gas and dust columns thicken, large supernova-driven winds suppress LyC escape completely.